Consumer Staples · NYSE: DG
Dollar General: how the business works
Dollar General sells food, cleaning supplies and other everyday basics through 21,148 small stores, with net sales of $42.7 billion in FY2025.
By Hardik Bhandare · Checked against filings: . Editorial policy. Corrections
Follow Dollar General
Email me when Dollar General's page is updated after earnings.
We'll send a confirmation email first. See our privacy policy.
Dollar General Corporation · Goodlettsville, Tennessee · Founded 1939
Updated for Q2 FY2026 · checked
- Net sales, FY2025 (ended Jan 30, 2026)
- $42.7B
- Net income, FY2025
- $1.5B
- Stores, Jul 31, 2026
- 21,148
- Employees, Feb 27, 2026
- ~194,000
- Founded
- 1939
The short version
Dollar General in 5 points
1 · What it sells
Dollar General sells food, cleaning supplies and other everyday basics, typically priced at $10 or less, through 21,148 small stores (Jul 31, 2026), with net sales of $42.7 billion in FY2025.
2 · Who pays it
Shoppers, mainly low and fixed income households, paid for consumables (82.0% of FY2025 net sales), seasonal items (10.1%), home products (5.2%) and apparel (2.7%).
3 · What it keeps from $100
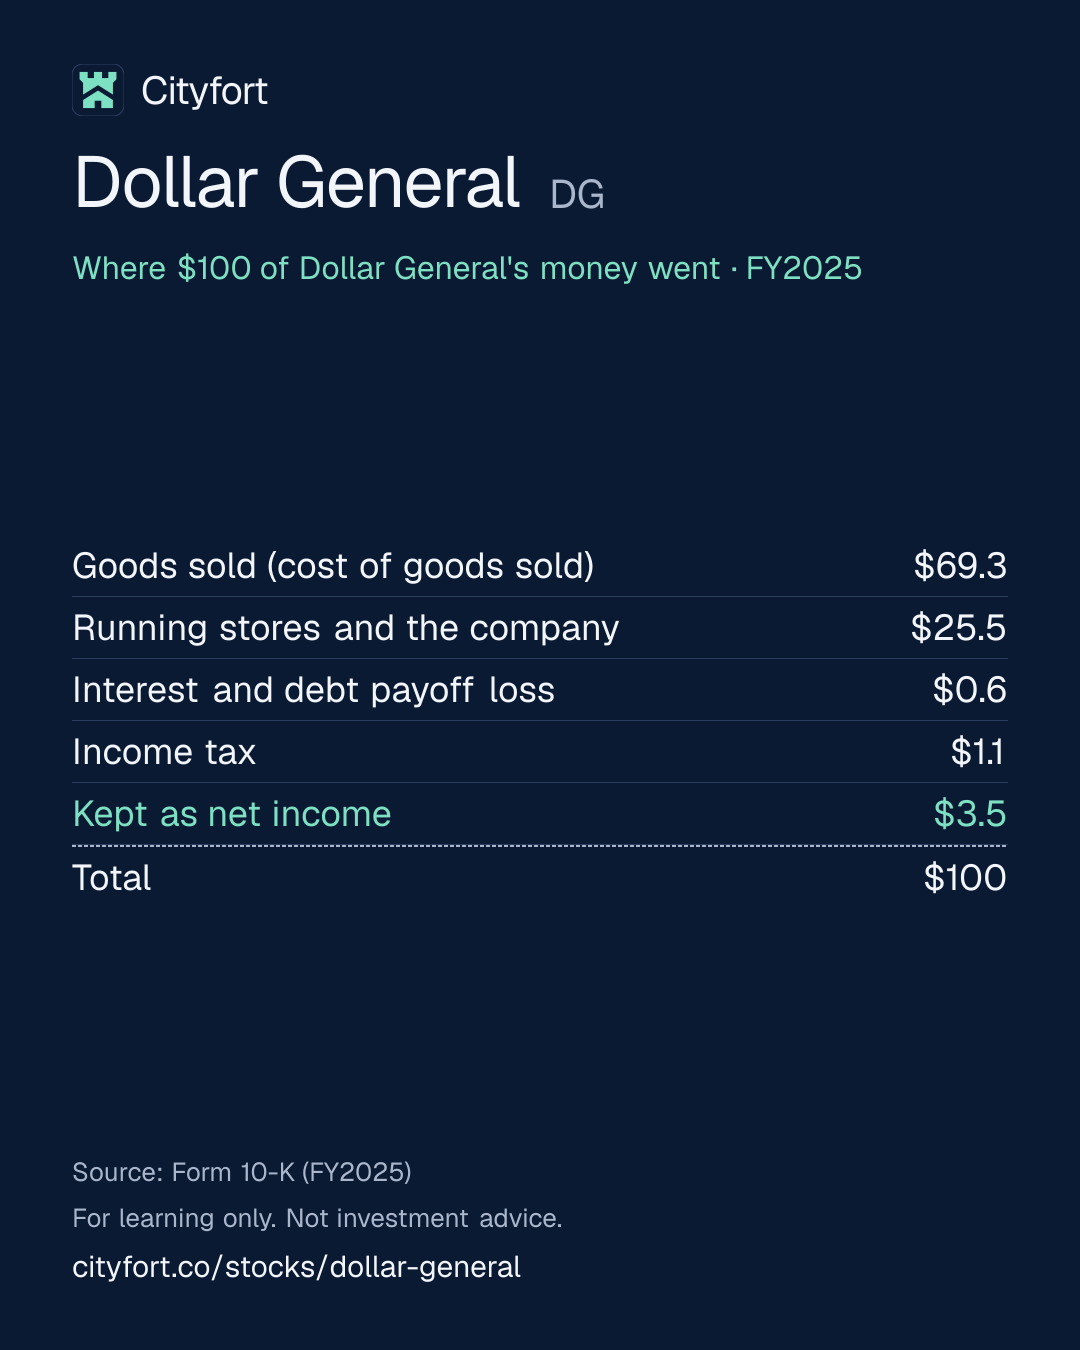
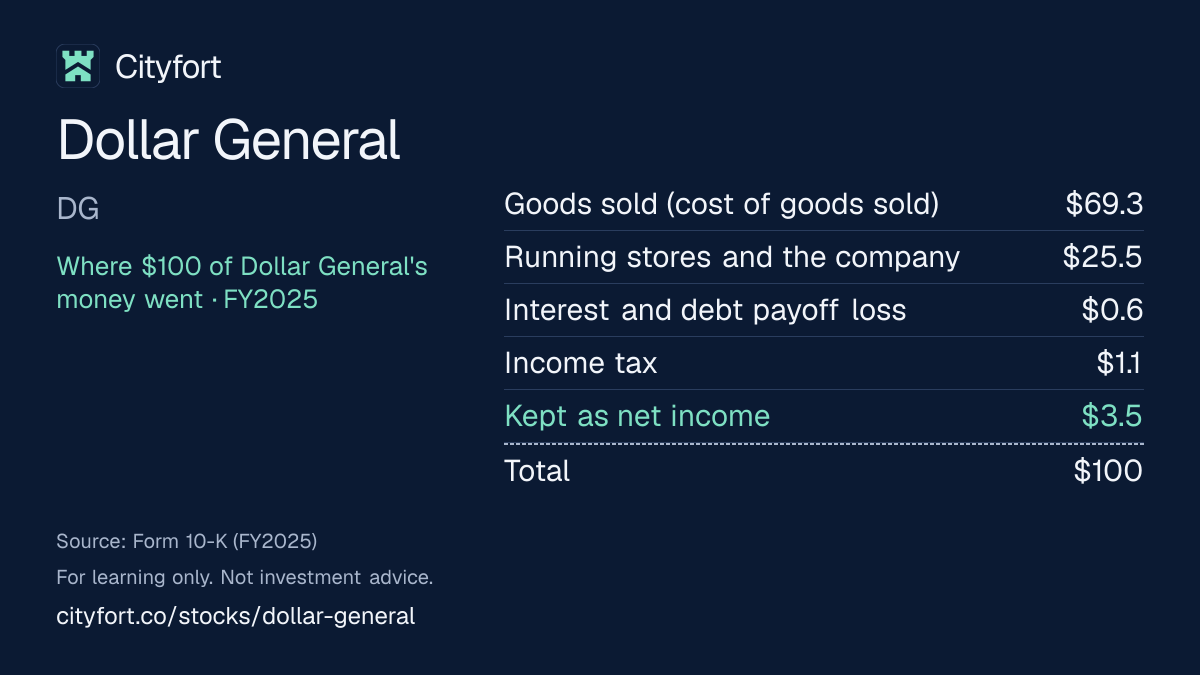
Of every $100 of FY2025 net sales, Dollar General kept $3.5 as net income and $5.2 as operating profit, after $69.3 for the goods it sold and $25.5 for running stores and the company.
4 · Where the operating profit comes from
Dollar General reports one segment and no profit by category, and says seasonal and home products carry its highest gross margins while consumables, 82.0% of FY2025 net sales, carry the lowest.
5 · The one thing to watch
Operating profit rose 29.2% to $769.2 million in Q2 FY2026, a quarter in which the company estimates tariff refunds added about 66 basis points to its 6.8% operating margin.
Sources: From Dollar General's FY2025 10-K and its Q2 FY2026 earnings release and 10-Q · checked
See the full receipt and the management scorecard below
01Where the money goes · FY2025
Where does $100 of Dollar General's money go?
Dollar General · FY2025
Receipt for every $100
| Goods sold (cost of goods sold) | $69.3 |
|---|---|
| Running stores and the company | $25.5 |
| Interest and debt payoff loss | $0.6 |
| Income tax | $1.1 |
| Kept as net income | $3.5 |
| Total | $100 |
Each line = amount ÷ total money in × 100. Lines may not add to exactly $100 because of rounding.
How this is worked out
Cityfort calculation from the FY2025 10-K. Of every $100 of FY2025 net sales (no other income was reported): each line = line ÷ $42,724.4 million × 100.
Save this receipt as an image:
1080 × 1350 PNG for Instagram, LinkedIn1200 × 675 PNG for X
Embed this receipt
Paste this code into a blog or website to show the receipt, with a link back to this page:
Each week: one company explained in 5 points, picked by earnings date.
Free, no tips, unsubscribe anytime.
We'll send a confirmation email. See our privacy policy.
02The business in one line
What does Dollar General do?
Shoppers pay Dollar General for everyday basics; $69.3 of every $100 of FY2025 net sales went on the goods themselves, $25.5 on running the stores and the company, and $3.5 was left as net income.
- About 80% of Dollar General's stores are in towns of 20,000 people or fewer, and about 75% of the US population lives within five miles of one. Its core customers are low and fixed income households.
- Consumables, such as food, paper and cleaning products, were 82.0% of FY2025 net sales. The company says they carry its lowest gross margins.
03Who pays it
Who pays Dollar General?
Shoppers buying consumables
82%
of revenue
Food, paper and cleaning products, health and beauty items, pet supplies and tobacco: $35.1 billion in FY2025. The company's core customers are low and fixed income households.
Shoppers buying seasonal items
10%
of revenue
Holiday goods, toys, small electronics and similar items: $4.3 billion in FY2025.
Shoppers buying home products
5%
of revenue
Kitchen, storage, bed and bath goods: $2.2 billion in FY2025.
Shoppers buying apparel
3%
of revenue
Basic clothing, shoes and diapers: $1.1 billion in FY2025.
- Shoppers buying consumables82%
- Shoppers buying seasonal items10%
- Shoppers buying home products5%
- Shoppers buying apparel3%
How spread out the customers are
Dollar General sells to the public, so no single customer is material. The shares above are product categories of FY2025 net sales. On the buying side, its two largest suppliers were about 11% and 8% of purchases in FY2025.
04Why it makes money
Why does Dollar General make money?
Dollar General earns a few dollars per $100 of sales from many small, low-cost stores that people visit often.
Dollar General keeps a limited range of items, which it says helps it buy in bulk and keep prices low. Everyday needs bring frequent trips, and seasonal and home goods add higher-margin sales. Operating profit per $100 of net sales fell from $9.4 in FY2021 to $5.2 in FY2025.
Operating profit per $100 of net sales
$9.4$5.2
FY2021 to FY2025
- Small stores open close to customers, often in small towns
- Low prices on everyday needs bring frequent trips
- A limited range of items supports bulk buying
- Own warehouses and trucks keep supply costs down
- Seasonal and home goods add higher-margin sales
- Cash from stores pays for new stores and remodels
↺ Step 6 feeds back into step 1.
05Business segments · FY2025
Which businesses make up Dollar General?
Consumables
82%Everyday basics such as food, paper and cleaning products. Dollar General has one reportable segment; these four are its product categories, and it reports no profit by category.
Revenue $35.1B
Seasonal
10%Holiday items, toys, small electronics and gardening supplies; one of the two categories with the highest gross margins.
Revenue $4.3B
Home products
5%Kitchen, storage, bed and bath goods; the other high-margin category.
Revenue $2.2B
Apparel
3%Basic clothing, shoes and diapers.
Revenue $1.1B
How the mix changed
- Consumables
- Seasonal
- Home products
- Apparel
Revenue by segment, FY2021 to FY2025.
US$
See the numbers
06The numbers · Consolidated · US$
How has Dollar General done?
Revenue
$42.7BFY2025
Net sales rose every year, from $34.2 billion in FY2021 to $42.7 billion in FY2025; FY2022 had 53 weeks.
US$
See the numbers
Net profit
$1.5BFY2025
Net income fell from $2.4 billion in FY2022 to $1.1 billion in FY2024, a year with $232 million of store review charges, then rose to $1.5 billion in FY2025.
US$
See the numbers
Profit kept per $100 of revenue
$3.5FY2025
Net income per $100 of net sales fell from $7.0 in FY2021 to $2.8 in FY2024, then rose to $3.5 in FY2025.
$ of profit per $100 of revenue (net margin)
See the numbers
Free cash flow
$2.4BFY2025
Free cash flow fell to $424 million in FY2022, a year in which $1.7 billion of cash went into inventories, and reached $2.4 billion in FY2025.
US$ · cash from operations minus spending on plants and equipment
See the numbers
See all yearly numbers
EBITDA here = operating income plus depreciation and amortization (from the cash flow statement). Fiscal years are the company's own (Friday closest to Jan 31. Dollar General names each fiscal year after the calendar year it starts in: FY2025 ended Jan 30, 2026, and Q2 FY2026 ended Jul 31, 2026. Some data vendors call FY2025 "FY2026". FY2022 had 53 weeks.). Net profit is the share belonging to the company's owners.
Download Dollar General's yearly and quarterly numbers (CSV, with source ids)
Learn: Fiscal years that don't end in December: Nvidia's FY2027 explained · Stock-based compensation and dilution: pay that becomes shares
Sources (14)
- Form 10-K for fiscal year 2023 (ended Feb 2, 2024)
- Form 10-K for fiscal year 2025 (ended Jan 30, 2026)
- Q3 fiscal 2024 earnings release (8-K Ex. 99, quarter ended Nov 1, 2024)
- SEC XBRL company facts, Dollar General Corp (figures as tagged in the 10-K and 10-Q filings)
- Q4 and fiscal 2024 earnings release with fiscal 2025 guidance and long-term financial framework (8-K Ex. 99)
- Q1 fiscal 2025 earnings release (8-K Ex. 99, quarter ended May 2, 2025)
- Q2 fiscal 2025 earnings release (8-K Ex. 99, quarter ended Aug 1, 2025)
- Q3 fiscal 2025 earnings release (8-K Ex. 99, quarter ended Oct 31, 2025)
- Form 10-Q for Q3 fiscal 2025 (13 weeks ended Oct 31, 2025)
- Q4 and fiscal 2025 earnings release with fiscal 2026 guidance (8-K Ex. 99, quarter ended Jan 30, 2026)
- Q1 fiscal 2026 earnings release (8-K Ex. 99, quarter ended May 1, 2026)
- Form 10-Q for Q1 fiscal 2026 (13 weeks ended May 1, 2026)
- Q2 fiscal 2026 earnings release (8-K Ex. 99, quarter ended Jul 31, 2026)
- Form 10-Q for Q2 fiscal 2026 (13 weeks ended Jul 31, 2026)
07Who runs it
Who runs Dollar General, and did they deliver?
Todd J. Vasos
Chief Executive Officer · since 2023
CEO again since Oct 2023, after first serving from Jun 2015 to Nov 2022. He is expected to hand over on Jan 1, 2027, then serve as Senior Advisor to Apr 2, 2027 and stay on the board.
Jerry W. "JJ" Fleeman Jr.
Chief Executive Officer-designate · since 2027
Expected to become CEO on Jan 1, 2027. He has been CEO of Ahold Delhaize USA since Apr 2023.
Donny H. Lau
Executive Vice President and Chief Financial Officer · since 2025
CFO since Oct 20, 2025; previously CFO of Zaxby's and earlier in Dollar General strategy and investor relations roles. He followed Kelly Dilts, who resigned in 2025.
Emily C. Taylor
Chief Operating Officer · since 2025
COO since Nov 16, 2025; previously Chief Merchandising Officer.
David P. Rowland
Chairman of the Board · since 2026
Chairman since Feb 4, 2026, after Michael M. Calbert, who stays a director.
What they said, and what happened
3 delivered · 3 too early to tell
Said on Mar 13, 2025
Dollar General guided FY2025 net sales growth of about 3.4% to 4.4%.
DeliveredWhat happened
Net sales grew 5.2%, above the range.
Said on Mar 13, 2025
Dollar General guided FY2025 diluted EPS of about $5.10 to $5.80.
DeliveredWhat happened
Diluted EPS was $6.85, above the range; the company had raised its guidance to $6.30 to $6.50 by Dec 4, 2025.
Said on Mar 13, 2025
Dollar General planned about 575 new US stores, about 2,000 Project Renovate and about 2,250 Project Elevate remodels, and about 45 relocations in FY2025.
DeliveredWhat happened
It opened 581 US stores and completed 2,000 Renovate and 2,254 Elevate remodels and 47 relocations.
Said on Mar 13, 2025
Dollar General set a long-term framework including an operating margin of about 6% to 7%, targeted to begin in 2028/2029, and diluted EPS growth of 10% or more.
Too early to tellWhat happened
The operating margin was 5.2% in FY2025 and 6.8% in Q2 FY2026, a quarter the company says tariff refunds lifted by about 66 basis points.
Said on Aug 27, 2026
Dollar General guided FY2026 diluted EPS of about $7.80 to $8.00, up from $7.20 to $7.45 (Jun 2, 2026) and $7.10 to $7.35 (Mar 12, 2026), including about $0.25 from tariff refunds.
Too early to tellWhat happened
FY2026 ends Jan 29, 2027. Diluted EPS was $4.49 in the first half (26 weeks to Jul 31, 2026).
Said on Aug 27, 2026
Dollar General said it expects share repurchases of up to $700 million in FY2026, its first since FY2022.
Too early to tellWhat happened
No shares were bought back in the first half of FY2026.
Sources (12)
- Form 10-K for fiscal year 2025 (ended Jan 30, 2026)
- 8-K filed Mar 24, 2026: CEO succession (Jerry W. Fleeman Jr. to succeed Todd Vasos)
- 8-K filed Aug 20, 2025: Donny Lau appointed CFO
- 8-K filed Jul 16, 2025: CFO Kelly Dilts resigns
- 8-K filed Nov 13, 2025: Emily Taylor appointed COO
- 8-K filed Feb 3, 2026: new Chairman; director retirement
- Q4 and fiscal 2024 earnings release with fiscal 2025 guidance and long-term financial framework (8-K Ex. 99)
- Q4 and fiscal 2025 earnings release with fiscal 2026 guidance (8-K Ex. 99, quarter ended Jan 30, 2026)
- Q3 fiscal 2025 earnings release (8-K Ex. 99, quarter ended Oct 31, 2025)
- Q2 fiscal 2026 earnings release (8-K Ex. 99, quarter ended Jul 31, 2026)
- Q1 fiscal 2026 earnings release (8-K Ex. 99, quarter ended May 1, 2026)
- Form 10-Q for Q2 fiscal 2026 (13 weeks ended Jul 31, 2026)
08What could go wrong
What could go wrong for Dollar General?
- Legal
FTC and states lawsuit
The FTC and various states sued on Oct 26, 2026, alleging violations of the FTC Act, the Gramm-Leach-Bliley Act and state laws. They seek a monetary judgment and civil penalties. Dollar General says an adverse outcome could have a material adverse effect, and it disclosed no amount.
Watch The legal note in the Q3 FY2026 10-Q and any court filings in the Middle District of Tennessee.
- Pricing
Thin margins with one-off help in Q2 FY2026
Operating profit rose 29.2% to $769.2 million in Q2 FY2026, a 6.8% margin. The company estimates tariff refunds added about 66 basis points to that margin and said on Aug 27, 2026 that it does not expect a material refund benefit in the second half.
Watch Operating margin in Q3 and Q4 FY2026, against 4.0% and 5.6% a year earlier.
- Demand
Customers with tight budgets
Dollar General's core customers are low and fixed income households. Consumables, its lowest-margin category, rose from 76.7% of net sales in FY2021 to 82.0% in FY2025.
Watch Same-store sales, traffic and the category mix in each 10-Q.
- Debt
Store leases on top of debt
Besides $4.6 billion of debt, Dollar General had $11.2 billion of operating lease liabilities at Jul 31, 2026.
Watch Operating lease cost ($1.99 billion in FY2025) and net debt in each filing.
- Regulation
Tariffs and imported goods
Direct imports were about 4% of purchases in FY2025, and the company says a substantial amount of imported goods comes from China. On Feb 20, 2026 the Supreme Court invalidated tariffs imposed under the IEEPA, and Q2 FY2026 results included tariff refunds.
Watch Gross margin and the tariff discussion in each 10-Q.
- Execution
New leadership team
A new CEO is expected on Jan 1, 2027, following a new CFO, COO and Chairman since Oct 2025.
Watch Officer changes reported on Form 8-K and the FY2026 earnings release.
- Concentration
Supplier concentration
The two largest suppliers were about 11% and 8% of purchases in FY2025.
Watch The supplier figures in the next 10-K.
Sources (11)
- 8-K filed Oct 26, 2026: FTC and states file lawsuit (Item 8.01)
- Q2 fiscal 2026 earnings release (8-K Ex. 99, quarter ended Jul 31, 2026)
- Q3 fiscal 2025 earnings release (8-K Ex. 99, quarter ended Oct 31, 2025)
- Q4 and fiscal 2025 earnings release with fiscal 2026 guidance (8-K Ex. 99, quarter ended Jan 30, 2026)
- Form 10-K for fiscal year 2025 (ended Jan 30, 2026)
- Form 10-K for fiscal year 2023 (ended Feb 2, 2024)
- Form 10-Q for Q2 fiscal 2026 (13 weeks ended Jul 31, 2026)
- 8-K filed Mar 24, 2026: CEO succession (Jerry W. Fleeman Jr. to succeed Todd Vasos)
- 8-K filed Aug 20, 2025: Donny Lau appointed CFO
- 8-K filed Nov 13, 2025: Emily Taylor appointed COO
- 8-K filed Feb 3, 2026: new Chairman; director retirement
09Both sides
What do supporters and critics point to?
What supporters point to
- Net sales rose every year, from $34.2 billion in FY2021 to $42.7 billion in FY2025.
- The company says same-store sales grew every year since 1990 except 2021, and they rose 3.5% in Q2 FY2026.
- Free cash flow rose from $424 million in FY2022 to $2.4 billion in FY2025.
- Net debt fell from $6.6 billion at the end of FY2022 to $3.0 billion at Jul 31, 2026.
- Operating profit rose 29.2% in Q2 FY2026, and the company met or beat its FY2025 sales, EPS and store targets.
What critics point to
- Operating profit per $100 of net sales was $5.2 in FY2025, down from $9.4 in FY2021.
- Net income was $1.5 billion in FY2025, below $2.4 billion in FY2021 and FY2022.
- The company estimates tariff refunds added about $0.25 to Q2 FY2026 diluted EPS of $2.48.
- The FTC and various states sued on Oct 26, 2026, alleging consumer law violations and seeking civil penalties.
- Operating lease liabilities of $11.2 billion at Jul 31, 2026 are more than twice its $4.6 billion of debt.
10What to watch next
What should you watch next at Dollar General?
Next event
Q3 FY2026 results
Date not announced yet.
Margins without tariff refunds
Q2 FY2026 operating profit was $769.2 million with about 66 basis points of help from tariff refunds; the company said on Aug 27, 2026 that it does not expect a material refund benefit in the second half.
The FTC and states lawsuit
Filed Oct 26, 2026 with no amount disclosed; the Q3 FY2026 10-Q legal note is the next place the company may update it.
CEO handover and buybacks
JJ Fleeman is expected to become CEO on Jan 1, 2027, and the company said on Aug 27, 2026 that it expects up to $700 million of buybacks in FY2026.
11Key dates
What are the key dates for Dollar General?
| Event | Date | Source |
|---|---|---|
| General Counsel moves to a senior advisory roleRhonda M. Taylor plans to retire after the advisory period. | 8-K filed Aug 28, 2026: General Counsel to retire | |
| New CEO expected to take overJJ Fleeman succeeds Todd Vasos, who stays on the board. | 8-K filed Mar 24, 2026: CEO succession (Jerry W. Fleeman Jr. to succeed Todd Vasos) | |
| Fiscal 2026 endsDollar General names this year FY2026, after the calendar year it starts in. | Form 10-K for fiscal year 2025 (ended Jan 30, 2026); Q2 fiscal 2026 earnings release (8-K Ex. 99, quarter ended Jul 31, 2026) |
Learn: Fiscal years that don't end in December: Nvidia's FY2027 explained
12Key facts
Key facts about Dollar General
- What does Dollar General do?
- Dollar General runs small discount stores that sell food, paper and cleaning products, health and beauty items, seasonal goods, home products and basic clothing, typically priced at $10 or less. Dollar General had 21,148 stores in 48 US states and Mexico on Jul 31, 2026.
- How does Dollar General make money, and what is its business model?
- Dollar General buys national-brand and private-brand goods and resells them in its own small stores near customers. In FY2025 (the year ended Jan 30, 2026) Dollar General had net sales of $42.7 billion and kept $5.2 of operating profit and $3.5 of net income per $100 of net sales.
- Is Dollar General profitable?
- Yes. Dollar General's net income was $1.5 billion in FY2025, up from $1.1 billion in FY2024 but below $2.4 billion in FY2021. FY2024 net income included $232 million of charges from a store portfolio review.
- What is Dollar General's revenue by segment?
- Dollar General reports one segment. By product category, FY2025 net sales were $35.1 billion from consumables (82.0%), $4.3 billion from seasonal items (10.1%), $2.2 billion from home products (5.2%) and $1.1 billion from apparel (2.7%).
- How much does Dollar General make from consumables?
- Consumables, such as paper and cleaning products, packaged and perishable food, snacks, health and beauty items, pet supplies and tobacco, brought Dollar General $35.1 billion of net sales in FY2025, or 82.0%. That share was 76.7% in FY2021.
- How much does Dollar General make from seasonal items, home products and apparel?
- In FY2025 Dollar General's seasonal items, such as holiday goods, toys and small electronics, brought in $4.3 billion. Home products brought in $2.2 billion and apparel $1.1 billion. Dollar General says seasonal and home products carry its highest gross margins.
- How many stores does Dollar General have?
- Dollar General had 21,148 stores on Jul 31, 2026, up from 18,130 at the end of FY2021. In FY2025 it opened 589 stores and closed 290, and 17 of its stores were in Mexico on Feb 27, 2026.
- Who owns Dollar General?
- Dollar General has one class of common stock, with 220.6 million shares outstanding on Aug 25, 2026. In Schedule 13GA filing by anyone who owns more than 5% of a company's shares and does not seek control. Learn more filings, Vanguard Capital Management reported 7.51% (Mar 31, 2026) and BlackRock 6.9% (Mar 31, 2025). Dollar General's directors and executive officers held less than 1% on Mar 19, 2026, according to its 2026 proxy.
- Does Dollar General pay a dividend?
- Yes. Dollar General has paid $0.59 a share each quarter since 2023, or $2.36 a year in FY2023, FY2024 and FY2025. It paid $519.5 million of dividends in FY2025 and has bought back no shares since FY2022.
Sources (8)
- Form 10-K for fiscal year 2025 (ended Jan 30, 2026)
- Form 10-Q for Q2 fiscal 2026 (13 weeks ended Jul 31, 2026)
- Form 10-K for fiscal year 2023 (ended Feb 2, 2024)
- Q4 and fiscal 2024 earnings release with fiscal 2025 guidance and long-term financial framework (8-K Ex. 99)
- Schedule 13G, Vanguard Capital Management LLC (7.51%, as of Mar 31, 2026)
- Schedule 13G/A, BlackRock, Inc. (6.9%, as of Mar 31, 2025)
- 2026 proxy statement (DEF 14A), annual meeting May 28, 2026
- Q2 fiscal 2026 earnings release (8-K Ex. 99, quarter ended Jul 31, 2026)
Terms on this page
- Capital expenditures (capex)
- Debt-to-equity
- Earnings per share (EPS)
- EBITDA
- Free cash flow
- Market cap
- Net debt
- Net margin
- P/E ratio
- Revenue vs net income
Each explains the term in plain English, with the same number from other companies on Cityfort.
Go deeper
More detail from the same filings. Open any section.
13What it sells
13What it sells
What does Dollar General sell?
Consumables ($35.1B, 82.0% of FY2025 net sales)
Paper and cleaning products, packaged food, perishables such as milk, eggs and frozen food, snacks, health and beauty items, pet supplies and tobacco.
Seasonal ($4.3B, 10.1%)
Holiday items, toys, batteries, small electronics, greeting cards, prepaid phones, gardening, hardware and automotive supplies.
Home products ($2.2B, 5.2%)
Kitchen supplies, cookware, small appliances, light bulbs, storage containers, candles and bed and bath goods.
Apparel ($1.1B, 2.7%)
Basic clothing for children and adults, socks, underwear, disposable diapers, shoes and accessories.
Other store formats
pOpshelf, a small-store format focused on non-consumables (180 standalone stores at the end of 2025, new openings paused from 2025), and Mi Super Dollar General stores in Mexico, opened from 2023.
What it does
- Does: Sells national brands and its own private brands, such as Clover Valley, often at lower prices than national brands
- Does: Runs its own distribution centers and a private truck fleet to supply its stores
- Does: Offers home delivery through its digital tools
- Does: Connects brands with its shoppers through the DG Media Network; money from brands is mostly recorded as a reduction of merchandise costs, not as sales
What it does not do
- Does not: Does not price everything at $1: prices are typically $10 or less
- Does not: Does not report results by region or profit by product category: it has one reportable segment
- Does not: Does not own most of its stores: most are leased
- Does not: Is not part of Dollar Tree or Family Dollar, which its 10-K names as competitors
14How the money flows
14How the money flows · FY2025
How does money flow through Dollar General?
Money in
- Net sales$42.7B
The company
Dollar General
$42.7B came in
Money out
- Cost of goods sold (the goods, freight and warehousing)$29.6B
- Selling, general and administrative costs (running stores and the company)$10.9B
- Interest and a loss on paying off debt early$239M
- Income tax$452M
- Net income$1.5B
- Shoppers paid Dollar General $42.7 billion for goods in FY2025.
- The goods themselves, with freight and warehousing, cost $29.6 billion.
- Running the stores and the company took $10.9 billion, including staff pay, rent and wear and tear on assets.
- That left $2.2 billion of operating profit. Interest and a loss on paying off debt early took $0.2 billion.
- After $0.5 billion of income tax, $1.5 billion was left as net income.
15What it needs to run
15What it needs to run
What does Dollar General need to run?
Small stores near customers
21,148 stores on Jul 31, 2026. A typical store has about 7,500 square feet of selling space; new stores are about 8,500. Most stores are leased, many on leases of up to 15 years.
Warehouses and trucks
20 distribution centers for non-refrigerated goods, 10 cold-storage centers and 4 combination centers, plus a private truck fleet.
People
About 194,000 full- and part-time employees on Feb 27, 2026. More than 70% of store managers were promoted from within.
Suppliers
The two largest suppliers were about 11% and 8% of purchases in FY2025. Direct imports were about 4% of purchases at cost, and a substantial amount of imported goods comes from China.
Store leases
Operating lease cost was $1.99 billion in FY2025, and operating lease liabilities were $11.1 billion on Jan 30, 2026.
16Competitors and what protects it
16Competitors and what protects it
Who does Dollar General compete with?
Walmart
NASDAQ: WMT
Named in Dollar General's FY2025 10-K as one of its primary direct competitors; it also sells groceries and household basics at low prices.
Family Dollar
Named in Dollar General's FY2025 10-K as one of its primary direct competitors.
Dollar Tree
NASDAQ: DLTR
Named in Dollar General's FY2025 10-K as one of its primary direct competitors.
What protects the business
Each strength is scored 1 (weak) to 5 (strong) for the business, with the reason. It is not a rating of the share.
- Stores close to customers4 of 5
Dollar General had 20,959 stores on Feb 27, 2026, and says about 75% of the US population lives within five miles of one.
- Low-cost small format3 of 5
A typical store has about 7,500 square feet of selling space and a limited range of items, with prices typically $10 or less.
- Own supply chain3 of 5
34 distribution centers, 10 of them cold storage, and a private truck fleet supply the stores.
- Steady store sales3 of 5
Same-store sales grew every year since 1990 except 2021, the company says, and rose 3.0% in FY2025.
Weak spot
Thin margins and low and fixed income core customers
Operating profit per $100 of net sales fell from $9.4 in FY2021 to $5.2 in FY2025. Its core customers are low and fixed income households, and consumables, its lowest-margin category, rose from 76.7% to 82.0% of net sales.
17Where growth could come from
17Where growth could come from
Where could Dollar General's growth come from?
Dollar General said in its Aug 27, 2026 earnings release that it expected FY2026 net sales growth of about 4.0% to 4.3% and same-store sales growth of about 2.5% to 2.9%. It expected diluted EPS of about $7.80 to $8.00, including about $0.25 from tariff refunds in Q2, and share repurchases of up to $700 million.
Store remodels
Working2,000 + 2,254 remodels, FY2025
Dollar General completed 2,000 full "Project Renovate" remodels and 2,254 lighter "Project Elevate" remodels in FY2025, in line with its plan of about 2,000 and 2,250. In the first half of FY2026 it completed 1,324 and 1,422.
Status: Working, on track against what the company said.
New stores
Working581 US + 8 Mexico, FY2025
Dollar General opened 581 US stores and 8 in Mexico in FY2025 and closed 290. The company said on Aug 27, 2026 that it plans about 450 US and about 10 Mexico openings in FY2026; it opened 315 and 6 in the first half.
Status: Working, on track against what the company said.
More customer visits
WorkingTraffic +2.0%, Q2 FY2026
Customer traffic rose 1.6% in FY2025 and 2.0% in Q2 FY2026, which the company called its fifth quarter in a row of traffic growth. Same-store sales rose 3.5% in Q2 FY2026.
Status: Working, on track against what the company said.
Rebuilding the operating margin
Mixed6.8% in Q2 FY2026
The long-term framework the company set out on Mar 13, 2025 targets an operating margin of about 6% to 7% from 2028/2029. Q2 FY2026 reached 6.8%, but the company estimates tariff refunds added about 66 basis points (0.66 percentage points). FY2025 was 5.2%.
Status: Mixed, partly on track.
pOpshelf
Behind180 standalone stores, end of 2025
Dollar General paused new pOpshelf openings from 2025 to review the format, and decided to close 45 pOpshelf stores in Q1 FY2025 after a store review.
Status: Behind, behind the company's own plan.
Mexico
Early17 stores, Feb 27, 2026
Dollar General opened its first Mi Super Dollar General stores in Mexico in 2023. The company says sales outside the US are not material.
Status: Early, too early to judge.
Status compares progress with what the company itself said it would do: Working = on track against what the company said; Mixed = partly on track; Behind = behind the company's own plan; New = recently announced; Early = too early to judge.
Sources (5)
- Q2 fiscal 2026 earnings release (8-K Ex. 99, quarter ended Jul 31, 2026)
- Q4 and fiscal 2025 earnings release with fiscal 2026 guidance (8-K Ex. 99, quarter ended Jan 30, 2026)
- Q4 and fiscal 2024 earnings release with fiscal 2025 guidance and long-term financial framework (8-K Ex. 99)
- Q1 fiscal 2026 earnings release (8-K Ex. 99, quarter ended May 1, 2026)
- Form 10-K for fiscal year 2025 (ended Jan 30, 2026)
18The company's own measures (non-GAAP)
18The company's own measures · FY2025 and Q2 FY2026
What do Dollar General's own measures show?
Official (GAAP): Net sales growth, FY2025
5.2%
Company's own measure: Same-store sales growth, FY2025
3.0%
Sales at stores open at least 13 full fiscal months and still open at the end of the period, compared with a year earlier, as Dollar General defines it. Net sales growth also includes new stores.
Official (GAAP): Net sales growth, Q2 FY2026
5.2%
Company's own measure: Same-store sales growth, Q2 FY2026
3.5%
Same definition. Customer traffic rose 2.0% and the average amount spent per visit 1.5%.
Official (GAAP): Net sales, FY2025
$42.7B
Company's own measure: Net sales per square foot, FY2025
270 $ per square foot
Sales of the last four quarters divided by average selling space, as Dollar General defines it; it was $263 in FY2024.
Official (GAAP): Merchandise inventories, Jan 30, 2026
$6.3B
Company's own measure: Inventory turnover, FY2025
4.5 times a year
Cost of goods sold of the last four quarters divided by average inventory, as Dollar General defines it; it was 4.1 in FY2024.
These are the company's own measures, defined by the company. They are not comparable across companies, and they are not added together. Each sits beside the nearest official (GAAP) figure.
Learn: Non-GAAP measures: what a company's "adjusted" numbers leave out
19Financial strength and debt
19Financial strength · Jul 31, 2026
How much debt does Dollar General have?
- Total debt$4.6B
- Cash and investments$1.6B
- Net debt (debt minus cash)$3.0B
- Net worth (shareholders' money)$9.3B
- Debt to equity
- 0.49×
- $ of debt for every $1 of shareholders' money
- Net debt is a Cityfort calculation from the Q2 FY2026 10-Q: total debt (current portion plus long-term obligations) minus cash.
- Operating lease liabilities of $11.2 billion at Jul 31, 2026 are not in total debt; some data vendors add them in.
- Net debt was $6.6 billion at the end of FY2022 (Feb 3, 2023) and $3.4 billion at the end of FY2025 (Jan 30, 2026).
- In FY2025 Dollar General redeemed $1.65 billion of notes before they were due. Its $2.375 billion revolving credit facility was undrawn and no commercial paper was outstanding at Jan 30, 2026.
20Who owns it
20Who owns it · ownership as of Mar 19, 2026
Who owns Dollar General?
- Officers and directors (as a group), shares
- 0.6%
Share classes
Holders of 5% or more
From the company's proxy statement (DEF 14A), later Schedule 13G filings and the share counts on its latest annual or quarterly report. Each holder row shows the date of its own filing.
Insider trades · Form 4 data as of Nov 6, 2026
What did Dollar General's insiders report trading?
Dollar General's insiders made 49 Form 4A filing an insider must make within two business days of buying or selling the company's shares. Learn more filings in the 12 months to Nov 6, 2026.
They reported no purchases and 9 sales (68,646 shares) in the open market or privately (codes P and S).
None of the sales were on forms with the Rule 10b5-1 plan box checked.
The same filings report 55 other share transactions (A: 31, F: 11, M: 7, D: 6).
They also report 7 transactions in options, stock units or other derivatives.
Insiders are a company's officers, directors and owners of more than 10% of a class of its shares. Most changes in their holdings must be reported to the SEC on a Form 4 within two business days. Source: SEC Form 4 filings on EDGAR.
- P
- a purchase in the open market or privately
- S
- a sale in the open market or privately
- A
- a grant, award or other acquisition from the company under Rule 16b-3
- D
- shares handed back to the company under Rule 16b-3
- F
- shares withheld or handed over to pay an exercise price or tax when an award is received, exercised or vests
- M
- exercise or conversion of an option or other derivative, exempt under Rule 16b-3
Code meanings: General Instruction 8 of Form 4 (SEC).
The latest 25 of 64 transactions
Shares: A = acquired, D = disposed of. A price the filing gives only in a footnote shows as “See filing”. The 10b5-1 box is checked when at least one trade on the form was made under a Rule 10b5-1 plan. A Form 4/A replaces the form it amends. See all of Dollar General's Form 4 filings on EDGAR.
Learn: How to read a proxy statement (DEF 14A): Nvidia's 2026 proxy · Form 4 insider filings: who files, the codes and the footnotes · Rule 10b5-1 trading plans: how insiders pre-schedule their trades
Sources (6)
- Form 10-Q for Q2 fiscal 2026 (13 weeks ended Jul 31, 2026)
- Schedule 13G, Vanguard Capital Management LLC (7.51%, as of Mar 31, 2026)
- Schedule 13G/A, BlackRock, Inc. (6.9%, as of Mar 31, 2025)
- 2026 proxy statement (DEF 14A), annual meeting May 28, 2026
- Schedule 13G, Vanguard Portfolio Management (5.24%, as of Jun 30, 2026)
- Schedule 13G, State Street Corporation (4.9%, as of Jun 30, 2026)
21What it does with profit
21What it does with profit
What does Dollar General do with its profit?
Dividend per share
$2.36FY2025
Dividend paid for each share, by financial year.
$ per share
See the numbers
Buyback · Jan 28, 2022
Bought back $2.5 billion of shares in FY2021.
$2.5B
Buyback · Feb 3, 2023
Bought back $2.7 billion of shares in FY2022, the last year with buybacks so far.
$2.7B
22Governance signals
22Governance signals
What do Dollar General's governance filings show?
- Auditor
- Ernst & Young LLP, since 2001
- Auditor changes
- None in the period covered
- Audit qualifications
- None reported
- Related-party dealings
- The 2026 proxy says there were no transactions above $120,000 with directors, officers, 5% holders or their families since the start of 2025, and none proposed. The Audit Committee reviews any such transaction.
- Credit rating
- Moody's and S&P (as stated in Dollar General's Aug 27, 2026 10-Q) Baa3 senior unsecured, P-3 commercial paper (Moody's) / BBB senior unsecured, A-2 commercial paper (S&P) (Stable (both)), Aug 27, 2026
A credit rating describes the company's ability to repay debt. It is not a rating of the share.
Flags to know about
regulatory
FTC and states lawsuit (filed Oct 26, 2026)
The FTC and various states sued Dollar General in federal court in Tennessee. They allege violations of the FTC Act, the Gramm-Leach-Bliley Act and state consumer protection and/or weights and measures laws, and seek an injunction, a monetary judgment and civil penalties. The FTC's non-public investigation, in which it issued a Civil Investigative Demand dated Jan 30, 2026, sought information on the company's marketing, advertising, offering for sale and sale of products. Dollar General says it intends to vigorously defend the matter and disclosed no amount.
other
Shareholder class action pending
A putative securities class action filed in November 2023, with a proposed class period of May 28, 2020 to Aug 28, 2024, is pending. The court dismissed it without prejudice on Jun 23, 2025 and later allowed an amended complaint. The defendants' new motion to dismiss was fully briefed on May 29, 2026. Related shareholder derivative suits are pending. The company says it cannot estimate any loss.
other
Moody's rating one notch lower than in early 2025
The FY2024 10-K (Mar 21, 2025) listed Moody's at Baa2 and S&P at BBB, both with negative outlooks. By the Q3 FY2025 10-Q (Dec 4, 2025), Moody's was Baa3 and both outlooks were stable.
other
Several leadership changes
A new CFO started in Oct 2025, a new COO in Nov 2025 and a new Chairman in Feb 2026. A new CEO is expected on Jan 1, 2027, and the General Counsel moves to an advisory role on Dec 7, 2026.
shares as collateral
Shares may not be used as collateral
Company policy prohibits directors and officers from hedging Dollar General stock or using it as collateral, and the proxy says none of the shares in its ownership table are used as collateral.
other
CEO pay ratio
FY2025 pay for CEO Todd Vasos was $8,163,197, against $18,876 for the median employee, a full-time store associate: a ratio of 432 to 1.
Sources (11)
- Form 10-K for fiscal year 2025 (ended Jan 30, 2026)
- 2026 proxy statement (DEF 14A), annual meeting May 28, 2026
- Form 10-Q for Q2 fiscal 2026 (13 weeks ended Jul 31, 2026)
- 8-K filed Oct 26, 2026: FTC and states file lawsuit (Item 8.01)
- Form 10-K for fiscal year 2024 (ended Jan 31, 2025)
- Form 10-Q for Q3 fiscal 2025 (13 weeks ended Oct 31, 2025)
- 8-K filed Aug 20, 2025: Donny Lau appointed CFO
- 8-K filed Nov 13, 2025: Emily Taylor appointed COO
- 8-K filed Feb 3, 2026: new Chairman; director retirement
- 8-K filed Mar 24, 2026: CEO succession (Jerry W. Fleeman Jr. to succeed Todd Vasos)
- 8-K filed Aug 28, 2026: General Counsel to retire
23What the market paid
23What the market paid · price as of Nov 5, 2026
What did the market pay for Dollar General on Nov 5, 2026?
Price as of Nov 5, 2026 (shown for education; prices change daily).
Price as of Nov 5, 2026: $138.00, the close shown in Nasdaq's historical price table for Dollar General. The shares list on the NYSE, and this price is from Nasdaq's site, not NYSE's. Times 220.6 million shares (Aug 25, 2026), that is a market value of about $30.4 billion (Cityfort calculation from the Nov 5, 2026 closing price and the Q2 FY2026 10-Q cover). P/E is price ÷ earnings per share: 17.9 on diluted EPS of $7.69 for the four quarters to Jul 31, 2026 (Cityfort calculation from the Q3 FY2025 to Q2 FY2026 earnings releases). The $0.59 quarterly dividend, times four, is 1.71% of this price.
- Share price
- $138.00
- Market value (market cap)
- $30.4B
- P/E
- 17.9×
More price-based ratios · as of Nov 5, 2026
Each ratio divides a number from the company's filings by the market value or share price on Nov 5, 2026. Prices change daily, so these ratios do too.
Price to sales (P/S)
0.7×
$30.4B market value ÷ $43.6B revenue (four quarters to Jul 31, 2026) = 0.7×
Cityfort calculation from the Nov 5, 2026 closing price and the Q3 FY2025 to Q2 FY2026 10-Ks and 10-Qs. Source: DG historical daily prices, Nasdaq's table for an NYSE-listed share (close of Nov 5, 2026: $138.00); Form 10-Q for Q2 fiscal 2026 (13 weeks ended Jul 31, 2026); Q3 fiscal 2025 earnings release (8-K Ex. 99, quarter ended Oct 31, 2025) and 7 more
How price ratios workDividend yield
1.71%
$2.36 dividends per share (FY2025) ÷ $138.00 share price = 1.71%
Cityfort calculation from the FY2025 10-K and the Nov 5, 2026 closing price. Source: DG historical daily prices, Nasdaq's table for an NYSE-listed share (close of Nov 5, 2026: $138.00); Form 10-Q for Q2 fiscal 2026 (13 weeks ended Jul 31, 2026); Q3 fiscal 2025 earnings release (8-K Ex. 99, quarter ended Oct 31, 2025) and 4 more
What dividend yield meansFree cash flow yield
7.9%
$2.4B free cash flow (FY2025) ÷ $30.4B market value = 7.9%
Cityfort calculation from the FY2025 10-K and the Nov 5, 2026 closing price. Source: DG historical daily prices, Nasdaq's table for an NYSE-listed share (close of Nov 5, 2026: $138.00); Form 10-Q for Q2 fiscal 2026 (13 weeks ended Jul 31, 2026); Q3 fiscal 2025 earnings release (8-K Ex. 99, quarter ended Oct 31, 2025) and 4 more
What free cash flow means
Shares used for the market value: 220.6 million ($138.00 × 220.6 million shares ≈ $30.4B). Source: Form 10-Q for Q2 fiscal 2026 (13 weeks ended Jul 31, 2026)
Source: DG historical daily prices, Nasdaq's table for an NYSE-listed share (close of Nov 5, 2026: $138.00); Form 10-Q for Q2 fiscal 2026 (13 weeks ended Jul 31, 2026); Q3 fiscal 2025 earnings release (8-K Ex. 99, quarter ended Oct 31, 2025) and 3 more
Sources (10)
- DG historical daily prices, Nasdaq's table for an NYSE-listed share (close of Nov 5, 2026: $138.00)
- Form 10-Q for Q2 fiscal 2026 (13 weeks ended Jul 31, 2026)
- Q3 fiscal 2025 earnings release (8-K Ex. 99, quarter ended Oct 31, 2025)
- Q4 and fiscal 2025 earnings release with fiscal 2026 guidance (8-K Ex. 99, quarter ended Jan 30, 2026)
- Q1 fiscal 2026 earnings release (8-K Ex. 99, quarter ended May 1, 2026)
- Q2 fiscal 2026 earnings release (8-K Ex. 99, quarter ended Jul 31, 2026)
- Form 10-Q for Q3 fiscal 2025 (13 weeks ended Oct 31, 2025)
- SEC XBRL company facts, Dollar General Corp (figures as tagged in the 10-K and 10-Q filings)
- Form 10-K for fiscal year 2025 (ended Jan 30, 2026)
- Form 10-Q for Q1 fiscal 2026 (13 weeks ended May 1, 2026)
24How it got here
24How it got here
How did Dollar General get here?
1939
Milestone
Founded as a wholesaler
J.L. Turner founded J.L. Turner and Son, Wholesale. The first Dollar General store opened in 1955.
1968
Milestone
Renamed and listed
The company took the name Dollar General Corporation, and its shares traded publicly from 1968.
2007
Business-model change
Taken private
Investment funds affiliated with KKR bought the company in July 2007. It listed again on the NYSE in November 2009, and those funds sold their last shares in December 2013.
2020
Business-model change
pOpshelf launched
Dollar General launched pOpshelf, a small-store format focused on non-consumables. New pOpshelf openings were paused from 2025.
2023
Crisis
Profit falls, CEO returns
Net income fell 31.2% to $1.7 billion in FY2023, and Todd Vasos returned as CEO in October 2023. The first stores in Mexico opened the same year.
2025
Crisis
Store closures
A store review led to $232 million of charges in Q4 FY2024 and the closing of 141 stores, 96 Dollar General and 45 pOpshelf, in Q1 FY2025.
2026
Milestone
CEO succession announced
On Mar 24, 2026 Dollar General said JJ Fleeman, CEO of Ahold Delhaize USA, would succeed Todd Vasos, expected on Jan 1, 2027.
2026
Crisis
FTC and states sue
The FTC and various states filed a lawsuit on Oct 26, 2026 alleging violations of federal and state consumer laws; Dollar General says it will defend it.
Sources (4)
- Form 10-K for fiscal year 2025 (ended Jan 30, 2026)
- Q4 and fiscal 2024 earnings release with fiscal 2025 guidance and long-term financial framework (8-K Ex. 99)
- 8-K filed Mar 24, 2026: CEO succession (Jerry W. Fleeman Jr. to succeed Todd Vasos)
- 8-K filed Oct 26, 2026: FTC and states file lawsuit (Item 8.01)
25Sources and changes
Where every number on this page comes from
Sources (30 documents)
- S1Form 10-K for fiscal year 2025 (ended Jan 30, 2026) · Dollar General Corporation (SEC EDGAR) · Tier 1: company or exchange filing · Mar 20, 2026
- S2Form 10-K for fiscal year 2024 (ended Jan 31, 2025) · Dollar General Corporation (SEC EDGAR) · Tier 1: company or exchange filing · Mar 21, 2025
- S3Form 10-K for fiscal year 2023 (ended Feb 2, 2024) · Dollar General Corporation (SEC EDGAR) · Tier 1: company or exchange filing · Mar 25, 2024
- S4Form 10-K for fiscal year 2022 (ended Feb 3, 2023, 53 weeks) · Dollar General Corporation (SEC EDGAR) · Tier 1: company or exchange filing · Mar 24, 2023
- S5Form 10-Q for Q2 fiscal 2026 (13 weeks ended Jul 31, 2026) · Dollar General Corporation (SEC EDGAR) · Tier 1: company or exchange filing · Aug 27, 2026
- S6Form 10-Q for Q1 fiscal 2026 (13 weeks ended May 1, 2026) · Dollar General Corporation (SEC EDGAR) · Tier 1: company or exchange filing · Jun 2, 2026
- S7Form 10-Q for Q3 fiscal 2025 (13 weeks ended Oct 31, 2025) · Dollar General Corporation (SEC EDGAR) · Tier 1: company or exchange filing · Dec 4, 2025
- S8Q2 fiscal 2026 earnings release (8-K Ex. 99, quarter ended Jul 31, 2026) · Dollar General Corporation (SEC EDGAR) · Tier 1: company or exchange filing · Aug 27, 2026
- S9Q1 fiscal 2026 earnings release (8-K Ex. 99, quarter ended May 1, 2026) · Dollar General Corporation (SEC EDGAR) · Tier 1: company or exchange filing · Jun 2, 2026
- S10Q4 and fiscal 2025 earnings release with fiscal 2026 guidance (8-K Ex. 99, quarter ended Jan 30, 2026) · Dollar General Corporation (SEC EDGAR) · Tier 1: company or exchange filing · Mar 12, 2026
- S11Q3 fiscal 2025 earnings release (8-K Ex. 99, quarter ended Oct 31, 2025) · Dollar General Corporation (SEC EDGAR) · Tier 1: company or exchange filing · Dec 4, 2025
- S12Q2 fiscal 2025 earnings release (8-K Ex. 99, quarter ended Aug 1, 2025) · Dollar General Corporation (SEC EDGAR) · Tier 1: company or exchange filing · Aug 28, 2025
- S13Q1 fiscal 2025 earnings release (8-K Ex. 99, quarter ended May 2, 2025) · Dollar General Corporation (SEC EDGAR) · Tier 1: company or exchange filing · Jun 3, 2025
- S14Q4 and fiscal 2024 earnings release with fiscal 2025 guidance and long-term financial framework (8-K Ex. 99) · Dollar General Corporation (SEC EDGAR) · Tier 1: company or exchange filing · Mar 13, 2025
- S15Q3 fiscal 2024 earnings release (8-K Ex. 99, quarter ended Nov 1, 2024) · Dollar General Corporation (SEC EDGAR) · Tier 1: company or exchange filing · Dec 5, 2024
- S162026 proxy statement (DEF 14A), annual meeting May 28, 2026 · Dollar General Corporation (SEC EDGAR) · Tier 1: company or exchange filing · Apr 7, 2026
- S178-K filed Oct 26, 2026: FTC and states file lawsuit (Item 8.01) · Dollar General Corporation (SEC EDGAR) · Tier 1: company or exchange filing · Oct 26, 2026
- S188-K filed Mar 24, 2026: CEO succession (Jerry W. Fleeman Jr. to succeed Todd Vasos) · Dollar General Corporation (SEC EDGAR) · Tier 1: company or exchange filing · Mar 24, 2026
- S198-K filed Feb 3, 2026: new Chairman; director retirement · Dollar General Corporation (SEC EDGAR) · Tier 1: company or exchange filing · Feb 3, 2026
- S208-K filed Aug 20, 2025: Donny Lau appointed CFO · Dollar General Corporation (SEC EDGAR) · Tier 1: company or exchange filing · Aug 20, 2025
- S218-K filed Jul 16, 2025: CFO Kelly Dilts resigns · Dollar General Corporation (SEC EDGAR) · Tier 1: company or exchange filing · Jul 16, 2025
- S228-K filed Nov 13, 2025: Emily Taylor appointed COO · Dollar General Corporation (SEC EDGAR) · Tier 1: company or exchange filing · Nov 13, 2025
- S238-K filed Aug 28, 2026: General Counsel to retire · Dollar General Corporation (SEC EDGAR) · Tier 1: company or exchange filing · Aug 28, 2026
- S24Schedule 13G, Vanguard Capital Management LLC (7.51%, as of Mar 31, 2026) · Vanguard Capital Management LLC (SEC EDGAR) · Tier 1: company or exchange filing · Apr 29, 2026
- S25Schedule 13G, Vanguard Portfolio Management (5.24%, as of Jun 30, 2026) · Vanguard Portfolio Management (SEC EDGAR) · Tier 1: company or exchange filing · Jul 31, 2026
- S26Schedule 13G/A, The Vanguard Group (0 shares, as of Mar 13, 2026) · The Vanguard Group (SEC EDGAR) · Tier 1: company or exchange filing · Mar 26, 2026
- S27Schedule 13G, State Street Corporation (4.9%, as of Jun 30, 2026) · State Street Corporation (SEC EDGAR) · Tier 1: company or exchange filing · Aug 7, 2026
- S28Schedule 13G/A, BlackRock, Inc. (6.9%, as of Mar 31, 2025) · BlackRock, Inc. (SEC EDGAR) · Tier 1: company or exchange filing · Apr 17, 2025
- S29DG historical daily prices, Nasdaq's table for an NYSE-listed share (close of Nov 5, 2026: $138.00) · Nasdaq, Inc. · Tier 1: company or exchange filing · Nov 5, 2026
- S31SEC XBRL company facts, Dollar General Corp (figures as tagged in the 10-K and 10-Q filings) · U.S. Securities and Exchange Commission · Tier 1: company or exchange filing · Nov 6, 2026
Changes to this page (v1 · Nov 6, 2026)
- v1 · Nov 6, 2026First version, through Q2 FY2026 (quarter ended Jul 31, 2026). (first version)
Numbers come only from tier 1 and tier 2 sources. Read how we research.
Disclaimer
For learning only. Cityfort is not a registered investment adviser or broker-dealer and does not recommend buying or selling any security. Prices shown are dated and may be out of date.
Investing in securities involves risk, including loss of capital. Before making any investment decision, do your own research and consider consulting a registered investment adviser or other qualified professional.
Cityfort, its owners and contributors may or may not hold securities of companies covered. Cityfort is not paid by any company it covers. Content is not an offer or solicitation to buy or sell any security, including in any initial public offering.
Read the positions policyRead the full disclaimerHide the full disclaimer
Cityfort publishes general educational content that explains how listed companies work. Cityfort is not registered with the US Securities and Exchange Commission or any state securities regulator as an investment adviser, and is not a broker-dealer or a member of FINRA. Cityfort does not provide investment, tax or legal advice, recommendations, ratings, price targets or any opinion on whether to buy, sell or hold any security. Nothing on the site is tailored to any person's circumstances.
All information is taken from publicly available sources, mainly company filings with the SEC, which are listed on each page with dates. We work to keep it accurate and correct errors publicly, but we do not guarantee that it is complete, accurate or up to date. Any market price or price-based ratio shown is dated, may be out of date by the time you read it, and is included only to explain concepts.
Statements by company management, including forward-looking statements and guidance, are reported as the company's statements, with their date and source; they are not our forecasts. Adjusted (non-GAAP) figures are the company's own measures and are shown next to the official (GAAP) figures.