Consumer Staples · NASDAQ: MNST
Monster Beverage: how the business works
Monster Beverage sells Monster Energy and other energy drinks in about 158 countries and territories, mostly through Coca-Cola bottlers, with net sales of $8.29 billion in FY2025.
By Hardik Bhandare · Checked against filings: . Editorial policy. Corrections
Follow Monster Beverage
Email me when Monster Beverage's page is updated after earnings.
We'll send a confirmation email first. See our privacy policy.
Monster Beverage Corporation · Corona, California
Updated for Q3 FY2026 · checked
- Net sales, FY2025
- $8.29B
- Net income, FY2025
- $1.91B
- Energy drink cases sold, FY2025
- 959.0M
- Owned by The Coca-Cola Company, Mar 17, 2026
- 20.9%
- Employees, Dec 31, 2025
- 6,891
The short version
Monster Beverage in 5 points
1 · What it sells
Monster Beverage sells energy drinks such as Monster Energy, Reign and Bang in about 158 countries and territories, with net sales of $8.29 billion in FY2025.
2 · Who pays it
In FY2025, Coca-Cola Europacific Partners paid about 15% of net sales, Coca-Cola Consolidated about 10%, The Coca-Cola Company's own subsidiaries about 3%, and other bottlers, distributors and retailers the other 72%.
3 · What it keeps from $100
Of every $100 that came in during FY2025, Monster kept $22.8 as net income after $6.9 of income tax, with interest and other income adding $63.2 million, while operating income was $29.17 per $100 of net sales.
4 · Where the operating profit comes from
The Monster Energy Drinks segment earned $2.98 billion of FY2025 segment operating income and Strategic Brands $240.8 million, while Alcohol Brands lost $127.0 million and corporate costs took $674.4 million.
5 · The one thing to watch
Q3 FY2026 net sales rose 16.7% to $2.56 billion, while gross margin fell to 54.7% from 55.7% a year earlier, which Monster attributed to aluminum can costs, geographic sales mix and freight-in costs.
Sources: From Monster Beverage's FY2025 10-K and its Q3 FY2026 earnings release · checked
See the full receipt and the management scorecard below
01Where the money goes · FY2025
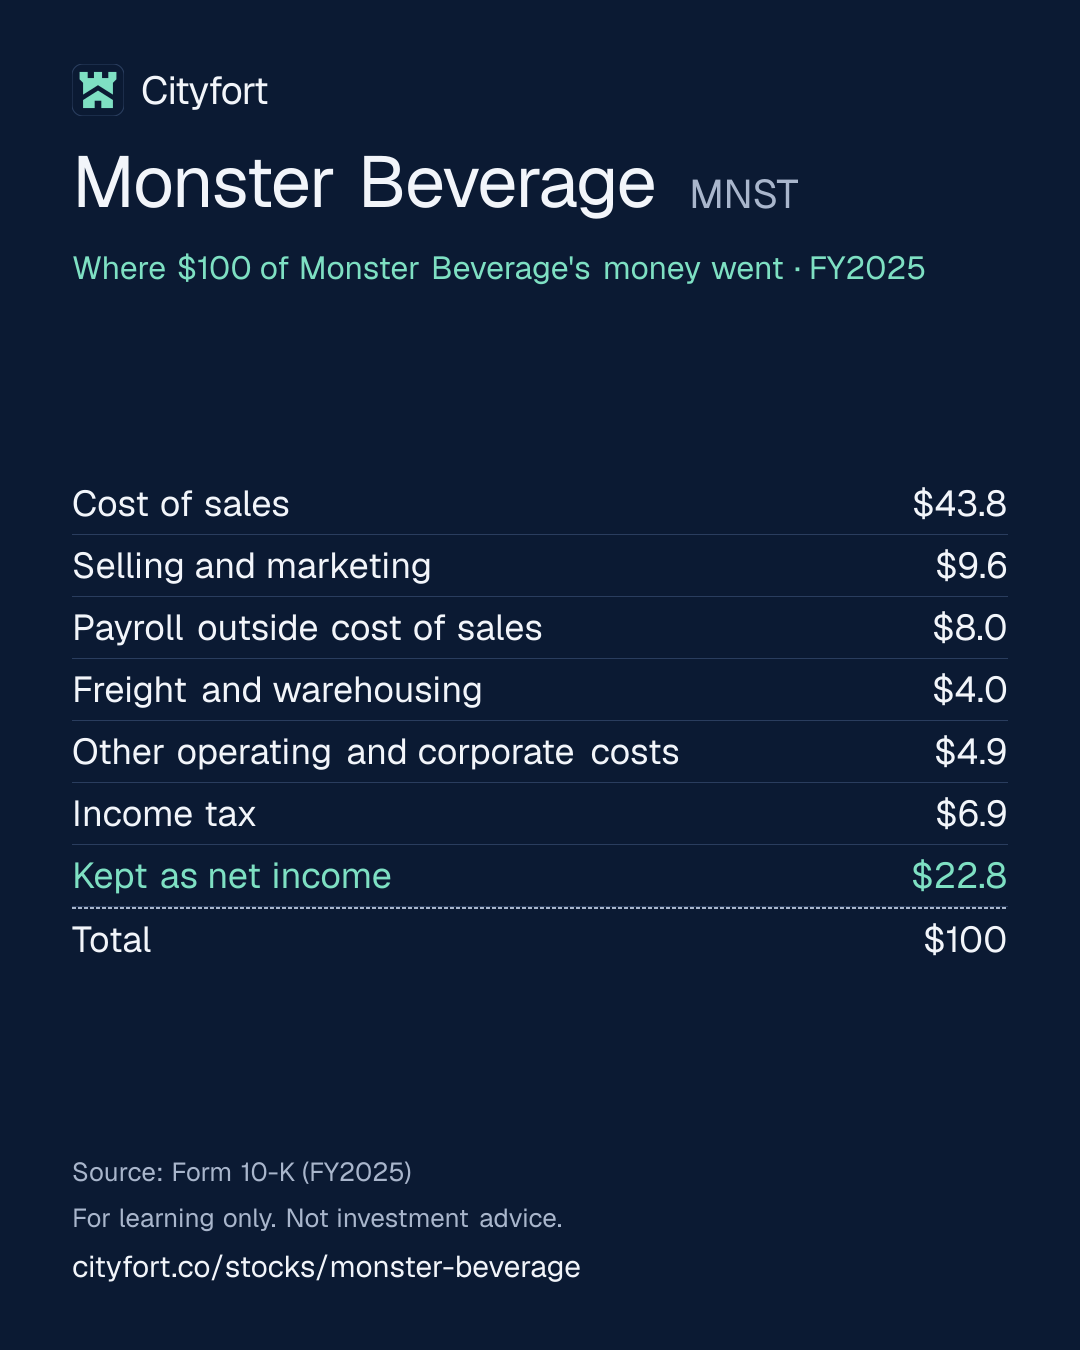
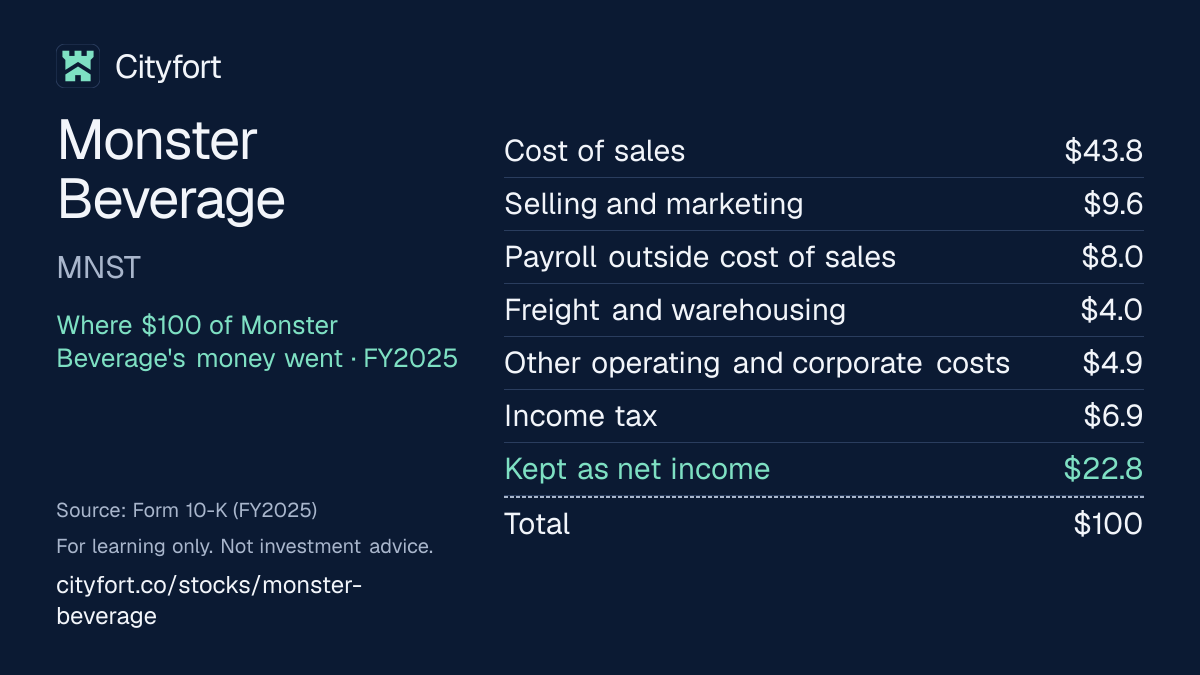
Where does $100 of Monster Beverage's money go?
Monster Beverage · FY2025
Receipt for every $100
| Cost of sales | $43.8 |
|---|---|
| Selling and marketing | $9.6 |
| Payroll outside cost of sales | $8.0 |
| Freight and warehousing | $4.0 |
| Other operating and corporate costs | $4.9 |
| Income tax | $6.9 |
| Kept as net income | $22.8 |
| Total | $100 |
Each line = amount ÷ total money in × 100. Lines may not add to exactly $100 because of rounding.
How this is worked out
Cityfort calculation from the FY2025 10-K. Of every $100 that came in during FY2025 (net sales of $8.29 billion plus $63.2 million of interest and other income, $8.36 billion in all): each line = line ÷ $8.36 billion × 100. Operating costs are grouped from the 10-K's segment note. Operating income was $29.17 per $100 of net sales alone.
Save this receipt as an image:
1080 × 1350 PNG for Instagram, LinkedIn1200 × 675 PNG for X
Embed this receipt
Paste this code into a blog or website to show the receipt, with a link back to this page:
Each week: one company explained in 5 points, picked by earnings date.
Free, no tips, unsubscribe anytime.
We'll send a confirmation email. See our privacy policy.
02The business in one line
What does Monster Beverage do?
Bottlers and distributors, most of them in Coca-Cola's network, pay Monster Beverage for its energy drinks; the biggest cost is the drinks themselves (cost of sales), then marketing and staff, and $22.97 of every $100 of FY2025 net sales was left as net income.
- Coca-Cola Europacific Partners made up about 15% of FY2025 net sales and Coca-Cola Consolidated about 10%. The Monster Energy Drinks segment made 92.4% of net sales.
- Of $8.29 billion of FY2025 net sales, cost of sales took $3.66 billion and operating expenses $2.21 billion. Operating income was $2.42 billion.
03Who pays it
Who pays Monster Beverage?
Coca-Cola Europacific Partners
15%
of revenue
A bottler in Coca-Cola's network, separate from The Coca-Cola Company. About 15% of FY2025 net sales, up from about 12% in FY2021.
Coca-Cola Consolidated
10%
of revenue
A US bottler in Coca-Cola's network. About 10% of FY2025 net sales, down from about 12% in FY2021.
The Coca-Cola Company's own subsidiaries
3%
of revenue
About 3% of FY2025 net sales, the 10-K says.
Other bottlers, distributors and retailers
72%
of revenue
The rest (Cityfort calculation from the FY2025 10-K). The 10-K names other Coca-Cola bottlers such as Coca-Cola Hellenic and Coca-Cola FEMSA, plus Reyes, Walmart, Costco and Amazon.
- Coca-Cola Europacific Partners15%
- Coca-Cola Consolidated10%
- The Coca-Cola Company's own subsidiaries3%
- Other bottlers, distributors and retailers72%
Customer concentration
Coca-Cola Europacific Partners made up about 15% of FY2025 net sales and Coca-Cola Consolidated about 10%. Bottlers in Coca-Cola's network are Monster's main distributors, and The Coca-Cola Company owns 20.9% of Monster.
- Largest customer
- 15%
04Why it makes money
Why does Monster Beverage make money?
Monster owns the brands and leaves most making and delivering of the drinks to partners, so it spends little on plants.
Capital spending was $132.3 million in FY2025, 1.6% of net sales (Cityfort calculation from the FY2025 10-K). Operating income was $29.17 per $100 of net sales in FY2025, against $32.44 in FY2021.
Operating income per $100 of net sales
$32.4$29.2
FY2021 to FY2025
- Monster markets its brands: $599.9 million of advertising and marketing in FY2025
- Bottlers and co-packers make most of the drinks
- Coca-Cola network bottlers deliver them to shops in about 158 countries and territories
- Energy drink cases sold rose from 613.4 million in FY2021 to 959.0 million in FY2025
- Little is spent on plants, so free cash flow was $1.97 billion in FY2025
- Cash pays for buybacks: $3.77 billion of stock bought in FY2024
↺ Step 6 feeds back into step 1.
05Business segments · FY2025
Which businesses make up Monster Beverage?
Monster Energy Drinks
92%Monster Energy, Reign and Bang drinks. It earned $2.98 billion of segment operating income in FY2025, before $674.4 million of corporate costs that Monster does not split by segment.
Revenue $7.7B · Operating profit $3.0B
Strategic Brands
6%Brands bought from Coca-Cola in 2015 plus Predator and Fury, sold mostly as concentrates. It earned $240.8 million of segment operating income in FY2025.
Revenue $469M · Operating profit $241M
Alcohol Brands
2%Craft beers, flavored malt beverages and hard seltzers since February 2022. It lost $127.0 million in FY2025, including impairments.
Revenue $135M · Operating profit −$127M
Other
0%Flavors from AFF sold to other companies.
Revenue $25M · Operating profit $3.4M
How the mix changed
- Monster Energy Drinks
- Strategic Brands
- Alcohol Brands
- Other
Revenue by segment, FY2021 to FY2025.
US$
See the numbers
06The numbers · Consolidated · US$
How has Monster Beverage done?
Revenue
$8.3BFY2025
Net sales rose every year, from $5.54 billion in FY2021 to $8.29 billion in FY2025, and reached $2.56 billion in Q3 FY2026, up 16.7% from a year earlier.
US$
See the numbers
Net profit
$1.9BFY2025
Net income fell in FY2022 and FY2024 and reached $1.91 billion in FY2025; earnings per share on this page are adjusted for the Aug 2026 2-for-1 stock split (Cityfort calculation from the 10-Ks, 10-Qs and earnings releases).
US$
See the numbers
Profit kept per $100 of revenue
$23.0FY2025
Net income per $100 of net sales was $24.9 in FY2021, fell to $18.9 in FY2022 and was $23.0 in FY2025.
$ of profit per $100 of revenue (net margin)
See the numbers
Free cash flow
$2.0BFY2025
Free cash flow was $1.97 billion in FY2025, more than net income of $1.91 billion, as capital spending fell to $132.3 million from $264.1 million in FY2024.
US$ · cash from operations minus spending on plants and equipment
See the numbers
See all yearly numbers
EBITDA here = operating income plus depreciation and amortization (from the cash flow statement). Fiscal years are the company's own (Fiscal year ends on Dec 31 (calendar year)). Net profit is the share belonging to the company's owners.
Download Monster Beverage's yearly and quarterly numbers (CSV, with source ids)
Learn: Fiscal years that don't end in December: Nvidia's FY2027 explained · Stock-based compensation and dilution: pay that becomes shares
Sources (16)
- Form 10-K for fiscal year 2023 (ended Dec 31, 2023)
- Form 10-K for fiscal year 2022 (ended Dec 31, 2022)
- Form 10-K for fiscal year 2025 (ended Dec 31, 2025)
- Q4 and full-year 2024 earnings release (8-K Exhibit 99.1)
- SEC XBRL company facts, Monster Beverage Corp (figures as tagged in the 10-K and 10-Q filings)
- Q1 2025 earnings release (8-K Exhibit 99.1)
- Form 10-Q for Q1 fiscal 2026 (three months ended Mar 31, 2026)
- Q2 2025 earnings release (8-K Exhibit 99.1)
- Form 10-Q for Q2 fiscal 2026 (three months ended Jun 30, 2026)
- Q3 2025 earnings release (8-K Exhibit 99.1)
- Q3 2026 earnings release (8-K Exhibit 99.1)
- Form 10-Q for Q3 fiscal 2025 (three months ended Sep 30, 2025)
- Q4 and full-year 2025 earnings release (8-K Exhibit 99.1)
- Q1 2026 earnings release (8-K Exhibit 99.1)
- Q2 2026 earnings release (8-K Exhibit 99.1)
- Form 10-Q for Q3 fiscal 2026 (three months ended Sep 30, 2026)
07Who runs it
Who runs Monster Beverage, and did they deliver?
Hilton H. Schlosberg
Chief Executive Officer and Vice Chairman · since 2025
Sole CEO since Jun 13, 2025, after serving as Co-CEO with Rodney Sacks. His 2025 total pay was $19.28 million; Monster's CEO pay ratio was 218 to 1.
Rodney C. Sacks
Chairman
Co-CEO until Jun 12, 2025, and still Chairman. His 2025 total pay was $13.85 million.
Thomas J. Kelly
Chief Financial Officer
2025 total pay of $2.71 million. Matthew S. Burroughs was elected Chief Accounting Officer and Deputy CFO on Sep 3, 2026.
Emelie C. Tirre
Chief Strategy Officer
Takes on the Americas and Caribbean on an interim basis from Dec 1, 2026, after Rob Gehring leaves on Nov 30, 2026 to join The Coca-Cola Company.
Guy P. Carling
CEO, EMEA and Other Strategic Partners
Runs Europe, the Middle East and Africa. 2025 total pay of $3.70 million.
What they said, and what happened
3 delivered · 1 too early to tell
Said on Mar 10, 2025
Monster said Rodney Sacks would step down as Co-CEO on Jun 12, 2025 and Hilton Schlosberg would become sole CEO.
DeliveredWhat happened
Schlosberg has been sole CEO since Jun 13, 2025, and Sacks remains Chairman.
Said on Jul 8, 2026
Monster said it would carry out a 2-for-1 stock split, with the new shares issued on Aug 10, 2026.
DeliveredWhat happened
The shares were issued on Aug 10, 2026 and traded on a split-adjusted basis from Aug 11, 2026.
Said on Aug 6, 2026
Monster said in its Q2 FY2026 release that its 2026 marketing strategy includes increased marketing investments across new platforms and partnerships.
DeliveredWhat happened
Selling expenses were $260.1 million in Q3 FY2026 (10.1% of net sales), against $214.6 million a year earlier.
Said on Sep 25, 2026
Monster said Emelie Tirre would oversee the Americas and Caribbean on an interim basis from Dec 1, 2026, after Rob Gehring's departure.
Too early to tellWhat happened
The change takes effect on Dec 1, 2026. The 8-K names no permanent head of the Americas.
Sources (8)
- 8-K filed Mar 10, 2025: Co-CEO transition (Item 5.02)
- 2026 proxy statement (DEF 14A), annual meeting May 14, 2026
- Form 10-K for fiscal year 2025 (ended Dec 31, 2025)
- 8-K filed Sep 4, 2026: Chief Accounting Officer elected (Item 5.02)
- 8-K filed Sep 25, 2026: CEO Americas to resign (Item 5.02)
- 8-K filed Jul 8, 2026: two-for-one stock split (Item 8.01, Exhibit 99.1)
- Q3 2026 earnings release (8-K Exhibit 99.1)
- Q2 2026 earnings release (8-K Exhibit 99.1)
08What could go wrong
What could go wrong for Monster Beverage?
- Concentration
Two Coca-Cola bottlers make up a quarter of net sales
Coca-Cola Europacific Partners made up about 15% of FY2025 net sales and Coca-Cola Consolidated about 10%. Bottlers in Coca-Cola's network are Monster's main distributors worldwide.
Watch The customer shares in the FY2026 10-K.
- Competition
Coca-Cola is owner, distributor and competitor
The Coca-Cola Company owns 20.9% of Monster, and Monster's 10-K names it among its competitors. Monster's CEO of the Americas leaves on Nov 30, 2026 to lead Coca-Cola's North America operating unit.
Watch Who permanently leads Monster's Americas business after the interim arrangement from Dec 1, 2026.
- Raw-material prices
Aluminum can and freight costs
Gross margin was 54.7% in Q3 FY2026, against 55.7% a year earlier. Monster pointed to higher aluminum can costs, geographic sales mix and freight-in costs, partly offset by price increases. Its risk factors name tariffs on aluminum.
Watch Gross margin in the Q4 FY2026 results.
- Regulation
Rules on energy drinks
Monster's 10-K lists limits on buying energy drinks with SNAP food benefits in some US states, FDA reviews of food chemicals and dyes, and container-size limits considered in Colombia, Costa Rica and the Dominican Republic.
Watch New state SNAP limits or FDA actions named in the next 10-K or 10-Q.
- Execution
Alcohol Brands keeps losing money
The segment has lost money every year since Monster bought it in February 2022. Impairments were $38.4 million in FY2023, $138.8 million in FY2024 and $53.7 million in FY2025.
Watch The segment's operating loss, $26.0 million in the first nine months of FY2026.
- Currency
More sales in other currencies
Sales outside the US were 41% of FY2025 net sales, and foreign currency transaction losses were $11.9 million in FY2025. Latin America sales rose 48.8% in Q3 FY2026, mainly from Brazil.
Watch The gap between reported growth (16.7% in Q3 FY2026) and growth excluding currency moves (16.3%).
Sources (5)
09Both sides
What do supporters and critics point to?
What supporters point to
- Net sales rose every year from FY2021 to FY2025, to $8.29 billion, and Q3 FY2026 net sales of $2.56 billion were up 16.7%.
- Monster had no borrowings at Sep 30, 2026 and held $3.70 billion of cash and short-term investments.
- Free cash flow was $1.97 billion in FY2025, more than net income of $1.91 billion.
- Sales outside the US rose from 39.3% of net sales in Q4 FY2024 to 46.8% in Q3 FY2026.
- Monster's Dec 2, 2025 slides quote Nielsen data giving its energy drinks a 34.7% US value share.
What critics point to
- Two Coca-Cola bottlers made up about 25% of FY2025 net sales, and The Coca-Cola Company, a 20.9% owner, is also a named competitor.
- Alcohol Brands has lost money every year since 2022, with impairments of $38.4 million, $138.8 million and $53.7 million in FY2023 to FY2025.
- Gross margin fell to 54.7% in Q3 FY2026 from 55.7%, with higher aluminum can costs among the reasons Monster gave.
- Average net sales per energy drink case fell from $8.99 in FY2021 to $8.48 in FY2025.
- Operating income per $100 of net sales was $29.17 in FY2025, against $32.44 in FY2021.
10What to watch next
What should you watch next at Monster Beverage?
Next event
Q4 FY2026 results
Date not announced yet.
Can and freight costs
Gross margin was 54.7% in Q3 FY2026, against 55.7% a year earlier, with aluminum can and freight-in costs among the reasons Monster gave.
Who runs the Americas
Rob Gehring leaves on Nov 30, 2026 for Coca-Cola. Emelie Tirre covers the Americas on an interim basis from Dec 1; the Sep 25, 2026 8-K names no permanent head.
Alcohol Brands
The segment lost $26.0 million in the first nine months of FY2026, and its Q3 net sales were $28.5 million, against $33.0 million a year earlier.
11Key dates
What are the key dates for Monster Beverage?
| Event | Date | Source |
|---|---|---|
| Rob Gehring, CEO of the Americas, leaves MonsterHe joins The Coca-Cola Company as president of its North America operating unit. | 8-K filed Sep 25, 2026: CEO Americas to resign (Item 5.02) | |
| Emelie Tirre takes on the Americas and Caribbean on an interim basis | 8-K filed Sep 25, 2026: CEO Americas to resign (Item 5.02) |
12Key facts
Key facts about Monster Beverage
- What does Monster Beverage do?
- Monster Beverage develops, markets and sells energy drinks, mainly under the Monster Energy, Reign and Bang brands, in about 158 countries and territories. Most of its drinks are made by third-party bottlers and co-packers. Monster Beverage's net sales were $8.29 billion in FY2025 (year ended Dec 31, 2025).
- How does Monster Beverage make money, and what is its business model?
- Monster Beverage sells packaged energy drinks and drink concentrates mainly to bottlers and distributors, most of them in Coca-Cola's network, which resell them to shops. In FY2025 Monster Beverage had net sales of $8.29 billion; after cost of sales of $3.66 billion and operating expenses of $2.21 billion, operating income was $2.42 billion.
- Is Monster Beverage profitable?
- Yes. Monster Beverage reported net income of $1.91 billion on net sales of $8.29 billion in FY2025, up from net income of $1.51 billion in FY2024. In the first nine months of FY2026 (to Sep 30, 2026) its net income was $1.72 billion, up 18.3% from a year earlier.
- What is Monster Beverage's revenue by segment?
- In FY2025 Monster Beverage's Monster Energy Drinks segment made $7.67 billion of net sales (92.4%), Strategic Brands $468.7 million (5.7%), Alcohol Brands $134.7 million (1.6%) and Other $25.0 million. The Alcohol Brands segment had an operating loss of $127.0 million.
- What is Monster Beverage's Monster Energy Drinks segment?
- Monster Beverage's Monster Energy Drinks segment sells ready-to-drink Monster Energy, Reign and Bang drinks, mostly to bottlers and distributors. The segment made $7.67 billion of net sales and $2.98 billion of segment operating income in FY2025.
- What are Monster Beverage's Strategic Brands?
- Monster Beverage's Strategic Brands segment holds energy drink brands bought from The Coca-Cola Company in 2015 and the lower-priced Predator and Fury brands, sold mostly as concentrates to bottlers. The segment made $468.7 million of net sales and $240.8 million of segment operating income in FY2025.
- Does Monster Beverage sell alcohol?
- Yes. Monster Beverage's Alcohol Brands segment, built on the Monster Brewing Company it bought in February 2022, sells craft beers, flavored malt beverages and hard seltzers, mainly to US beer distributors. The segment had net sales of $134.7 million and an operating loss of $127.0 million in FY2025.
- Who are Monster Beverage's biggest customers?
- Monster Beverage's largest customers are Coca-Cola bottlers: Coca-Cola Europacific Partners made up about 15% of FY2025 net sales and Coca-Cola Consolidated about 10%. Other customers named in Monster Beverage's FY2025 10-K include Walmart, Costco and Amazon.
- Who owns Monster Beverage?
- The Coca-Cola Company owned 20.9% of Monster Beverage's common stock in the 2026 proxy statementThe yearly filing about shareholder votes, the board and executive pay. Learn more (holdings as of Mar 17, 2026). Monster Beverage's officers and directors as a group held 8.1%, mostly through Chairman Rodney Sacks and CEO Hilton Schlosberg. Monster Beverage has one class of stock with one vote per share.
- How much of Monster Beverage's sales come from outside the US?
- Monster Beverage's net sales outside the US were $3.44 billion in FY2025, 41% of the total. In Q3 FY2026 (quarter ended Sep 30, 2026) sales outside the US were $1.20 billion of $2.56 billion.
Terms on this page
- Capital expenditures (capex)
- Customer concentration
- Debt-to-equity
- Earnings per share (EPS)
- EBITDA
- Free cash flow
- Market cap
- Net debt
- Net margin
- P/E ratio
Each explains the term in plain English, with the same number from other companies on Cityfort.
Go deeper
More detail from the same filings. Open any section.
13What it sells
13What it sells
What does Monster Beverage sell?
Monster Energy Drinks (92.4% of FY2025 net sales)
Ready-to-drink cans of Monster Energy, Reign and Bang, sold mostly to bottlers and full-service beverage distributors, and in some cases straight to retailers.
Strategic Brands (5.7%)
Energy drink brands bought from The Coca-Cola Company in 2015, plus the lower-priced Predator and Fury. Mostly sold as concentrates or beverage bases that bottlers turn into finished drinks.
Alcohol Brands (1.6%)
Craft beers, flavored malt beverages and hard seltzers, sold mainly to US beer distributors. It came with the Monster Brewing Company purchase in 2022.
Other (0.3%)
Flavors made by AFF, Monster's flavor maker, and sold to other companies.
What it does
- Does: Develops and markets energy drinks sold in about 158 countries and territories
- Does: Sells mostly to bottlers and distributors, led by bottlers in Coca-Cola's network
- Does: Owns production plants in Phoenix, Arizona and Norwalk, California, and flavor plants in Ireland and California
What it does not do
- Does not: Does not make most of its drinks itself: third-party bottlers and co-packers make most of them
- Does not: Is not part of The Coca-Cola Company, which owns 20.9% of its stock
- Does not: Does not pay a cash dividend
- Does not: Does not report net sales by country, only by region
14How the money flows
14How the money flows · FY2025
How does money flow through Monster Beverage?
Money in
- Net sales$8.3B
- Interest and other income, net$63.2M
The company
Monster Beverage
$8.4B came in
Money out
- Cost of sales$3.7B
- Selling and marketing$804M
- Payroll outside cost of sales$670M
- Distribution (freight and warehousing)$331M
- Other operating and corporate costs, including Alcohol Brands impairments$409M
- Income tax$577M
- Net income$1.9B
- Bottlers, distributors and retailers paid Monster $8.29 billion in FY2025, and interest and other income added $63.2 million.
- Cost of sales took $3.66 billion, leaving gross profit of $4.63 billion.
- Selling and marketing took $803.5 million, payroll outside cost of sales $669.7 million, and freight and warehousing $331.1 million.
- Other operating and corporate costs, including Alcohol Brands impairments, took $408.6 million, leaving operating income of $2.42 billion.
- After $577.1 million of income tax, $1.91 billion was left as net income.
15What it needs to run
15What it needs to run
What does Monster Beverage need to run?
Coca-Cola's bottler network
Bottlers in The Coca-Cola Company's network are Monster's main distributors around the world. Two of them made up about 25% of FY2025 net sales.
Bottlers, co-packers and its own plants
Most drinks are made by third-party bottlers and co-packers. Monster owns production plants in Phoenix, Arizona and Norwalk, California, and flavor plants in Athy, Ireland and San Fernando, California.
Aluminum cans
Monster named higher aluminum can costs as one reason gross margin fell to 54.7% in Q3 FY2026. Its risk factors list tariffs on aluminum.
Marketing
Advertising and marketing costs were $599.9 million in FY2025, up from $417.6 million in FY2021.
People
6,891 employees in 80 countries at Dec 31, 2025, of whom 4,555 worked in sales and marketing.
16Where it sells
16Where it sells · FY2025
Where does Monster Beverage sell?
- US and Canada61%
- Europe, Middle East and Africa23%
- Latin America and Caribbean8%
- Asia Pacific (including Oceania)8%
17Competitors and what protects it
17Competitors and what protects it
Who does Monster Beverage compete with?
Red Bull
Named in Monster's FY2025 10-K as a direct US competitor and as a competitor in international markets, including non-carbonated Red Bull in China and Asia.
Celsius
NASDAQ: CELH
Named in Monster's FY2025 10-K as a direct US competitor. The 10-K notes that Celsius Holdings bought Alani Nutrition, maker of Alani Nu, another named rival.
PepsiCo
NASDAQ: PEP
Named in Monster's FY2025 10-K among the companies whose products compete with Monster's.
Keurig Dr Pepper
Named in Monster's FY2025 10-K. The 10-K says Keurig Dr Pepper distributes the C4 and Bloom energy drinks and agreed to buy GHOST.
The Coca-Cola Company
NYSE: KO
Named in Monster's FY2025 10-K among the companies whose products compete with Monster's, while also owning 20.9% of Monster and the bottler network that distributes most of its drinks.
What protects the business
Each strength is scored 1 (weak) to 5 (strong) for the business, with the reason. It is not a rating of the share.
- Distribution through Coca-Cola bottlers4 of 5
Bottlers in Coca-Cola's network are Monster's main distributors, and its drinks are sold in about 158 countries and territories.
- Brand share4 of 5
Monster's Dec 2, 2025 slides quote Nielsen data giving its energy drinks a 34.7% US value share and 36.3% in Canada (4 weeks to Oct 25, 2025 in the US and Nov 1, 2025 in Canada).
- Low plant spending3 of 5
Most drinks are made by third parties. Capital spending was $132.3 million in FY2025, against free cash flowCash from operations minus spending on buildings and equipment. Learn more of $1.97 billion.
Weak spot
Reliance on Coca-Cola's network
Two Coca-Cola bottlers made up about 25% of FY2025 net sales, and The Coca-Cola Company, which owns 20.9% of Monster, is also named in the 10-K as a competitor.
18Where growth could come from
18Where growth could come from
Where could Monster Beverage's growth come from?
Monster gives no numeric financial guidance in its earnings releases. In its Q4 FY2025 release (Feb 26, 2026) it said it remains "excited about our planned new product offerings for the remainder of 2026 and beyond." Its Dec 2, 2025 slides quoted a GlobalData forecast of 8.0% a year growth in global off-trade (store) retail sales of energy drinks through 2030, a third-party forecast.
Sales outside the US
Working46.8% of Q3 FY2026 net sales
Sales outside the US were $1.20 billion of $2.56 billion in Q3 FY2026, against 39.3% of net sales in Q4 FY2024 (Cityfort calculation from the earnings releases). Latin America sales rose 48.8% in Q3 FY2026, mainly from Brazil, Monster said.
Status: Working, on track against what the company said.
Energy drink volume
Working884.3M cases in 9M FY2026, vs 720.8M
Cases of energy drinks sold (192-ounce equivalents) rose 22.7% in the first nine months of FY2026 (Cityfort calculation from the earnings releases). They rose from 613.4 million in FY2021 to 959.0 million in FY2025.
Status: Working, on track against what the company said.
Pricing
Mixed$8.30 average net sales per case, Q3 FY2026
Monster raised US prices in Q4 FY2024 and Q4 FY2025. Average net sales per energy drink case still fell from $8.99 in FY2021 to $8.48 in FY2025.
Status: Mixed, partly on track.
Strategic Brands
Working$156.4M in Q3 FY2026, vs $130.5M
Net sales of the brands bought from Coca-Cola and the lower-priced Predator and Fury rose in Q3 FY2026. The segment earned $79.6 million of operating income in the quarter.
Status: Working, on track against what the company said.
Alcohol Brands
Behind$134.7M of FY2025 net sales, vs $184.9M in FY2023
The segment has lost money every year since its February 2022 purchase. It lost $26.0 million in the first nine months of FY2026.
Status: Behind, behind the company's own plan.
Status compares progress with what the company itself said it would do: Working = on track against what the company said; Mixed = partly on track; Behind = behind the company's own plan; New = recently announced; Early = too early to judge.
Sources (7)
- Q4 and full-year 2025 earnings release (8-K Exhibit 99.1)
- Investor meeting slides, Dec 2, 2025 (8-K Item 7.01, Exhibit 99.1)
- Q3 2026 earnings release (8-K Exhibit 99.1)
- Q4 and full-year 2024 earnings release (8-K Exhibit 99.1)
- Form 10-K for fiscal year 2025 (ended Dec 31, 2025)
- Form 10-K for fiscal year 2023 (ended Dec 31, 2023)
- Form 10-Q for Q3 fiscal 2026 (three months ended Sep 30, 2026)
19The company's own measures (non-GAAP)
19The company's own measures · FY2025 and Q3 FY2026
What do Monster Beverage's own measures show?
Official (GAAP): Operating income, FY2025
$2.4B
Company's own measure: Adjusted operating income, FY2025
$2.6B
Monster's own measure. It leaves out the whole Alcohol Brands segment ($53.7 million of impairments and $73.3 million of operating losses), $19.5 million of litigation provisions and $16.8 million of stock pay tied to retirement terms.
Official (GAAP): Diluted EPS, FY2025 (as filed, before the Aug 2026 split)
$1.94
Company's own measure: Adjusted diluted EPS, FY2025 (as filed, before the Aug 2026 split)
$2.06
Monster's own measure, leaving out the same items after tax. Both figures are on the share count before the Aug 2026 split.
Official (GAAP): Operating income, Q3 FY2026
$719M
Company's own measure: Adjusted operating income, Q3 FY2026
$748M
Leaves out the Alcohol Brands segment's $9.0 million loss, $0.5 million of litigation costs and the $19.9 million Kona, Hawaii property impairment. Monster's 2026 releases do not adjust for retirement-clause stock pay, and from the Q2 FY2026 release its 2025 comparisons are shown on that basis (Q3 FY2025: $698.4 million, against $705.8 million first reported).
Official (GAAP): Diluted EPS, Q3 FY2026
$0.29
Company's own measure: Adjusted diluted EPS, Q3 FY2026
$0.30
Monster's own measure, leaving out the same items after tax; after the Aug 2026 split.
Official (GAAP): Reported net sales growth, Q3 FY2026
16.7%
Company's own measure: Net sales growth excluding currency moves, Q3 FY2026
16.3%
Monster's measure of growth with exchange-rate changes taken out.
Official (GAAP): Net sales, FY2025
$8.3B
Company's own measure: Gross billings, FY2025
$9.8B
Monster's own presentation: sales before $1,573.3 million of promotional allowances, commissions and other deductions that reduce net sales, +$40.0 million of deferred revenue recognized.
Official (GAAP)
No official figure measures this; it is the company's own operating measure.
Company's own measure: Energy drink cases sold, FY2025
959 million cases
Cases of 192-ounce equivalents of the Monster Energy Drinks and Strategic Brands segments. Average net sales per case was $8.48, down from $8.99 in FY2021. The nearest GAAP line is net sales of $8.29 billion.
Official (GAAP)
No official figure measures this; it is the company's own operating measure.
Company's own measure: Energy drink cases sold, Q3 FY2026
304.9 million cases
Same measure for the quarter, against 258.4 million in Q3 FY2025. Average net sales per case was $8.30.
These are the company's own measures, defined by the company. They are not comparable across companies, and they are not added together. Each sits beside the nearest official (GAAP) figure.
Learn: Non-GAAP measures: what a company's "adjusted" numbers leave out
Sources (7)
- Q4 and full-year 2025 earnings release (8-K Exhibit 99.1)
- Q3 2026 earnings release (8-K Exhibit 99.1)
- Q2 2026 earnings release (8-K Exhibit 99.1)
- Q1 2026 earnings release (8-K Exhibit 99.1)
- Q3 2025 earnings release (8-K Exhibit 99.1)
- Form 10-K for fiscal year 2025 (ended Dec 31, 2025)
- Form 10-K for fiscal year 2023 (ended Dec 31, 2023)
20Financial strength and debt
20Financial strength · Sep 30, 2026
How much debt does Monster Beverage have?
- Total debt$0M
- Cash and investments$3.7B
- Net cash (cash minus debt)$3.7B
- Net worth (shareholders' money)$9.8B
- Debt to equity
- 0×
- $ of debt for every $1 of shareholders' money
- Cash and investments are cash and equivalents ($2,148.4 million) plus short-term investments ($1,555.9 million). Net cash is a Cityfort calculation from the Q3 FY2026 earnings release; the Dec 31, 2025 figure is a Cityfort calculation from the FY2025 10-K.
- Monster also held $927.0 million of long-term investments at Sep 30, 2026, not counted above.
- Its $500 million revolving credit line, which runs to May 2029, was undrawn. A $750 million term loan taken in May 2024 was repaid in April 2025.
- Monster had accrued $30.8 million for loss contingencies at Sep 30, 2026.
21Who owns it
21Who owns it · ownership as of Mar 17, 2026
Who owns Monster Beverage?
- Officers and directors (as a group), shares
- 8.1%
Share classes
Holders of 5% or more
From the company's proxy statement (DEF 14A), later Schedule 13G filings and the share counts on its latest annual or quarterly report. Each holder row shows the date of its own filing.
Insider trades · Form 4 data as of Nov 6, 2026
What did Monster Beverage's insiders report trading?
Monster Beverage's insiders made 44 Form 4A filing an insider must make within two business days of buying or selling the company's shares. Learn more filings in the 12 months to Nov 6, 2026.
They reported no purchases and 11 sales (461,681 shares) in the open market or privately (codes P and S).
None of the sales were on forms with the Rule 10b5-1 plan box checked.
The same filings report 90 other share transactions (M: 50, F: 19, G: 8, J: 8, A: 5).
They also report 91 transactions in options, stock units or other derivatives.
Insiders are a company's officers, directors and owners of more than 10% of a class of its shares. Most changes in their holdings must be reported to the SEC on a Form 4 within two business days. Source: SEC Form 4 filings on EDGAR.
- P
- a purchase in the open market or privately
- S
- a sale in the open market or privately
- A
- a grant, award or other acquisition from the company under Rule 16b-3
- F
- shares withheld or handed over to pay an exercise price or tax when an award is received, exercised or vests
- M
- exercise or conversion of an option or other derivative, exempt under Rule 16b-3
- G
- a bona fide gift
- J
- another acquisition or disposition, described in a footnote
Code meanings: General Instruction 8 of Form 4 (SEC).
The latest 25 of 101 transactions
Shares: A = acquired, D = disposed of. A price the filing gives only in a footnote shows as “See filing”. The 10b5-1 box is checked when at least one trade on the form was made under a Rule 10b5-1 plan. A Form 4/A replaces the form it amends. See all of Monster Beverage's Form 4 filings on EDGAR.
Learn: How to read a proxy statement (DEF 14A): Nvidia's 2026 proxy · Form 4 insider filings: who files, the codes and the footnotes · Rule 10b5-1 trading plans: how insiders pre-schedule their trades
Sources (6)
- Form 10-Q for Q3 fiscal 2026 (three months ended Sep 30, 2026)
- 2026 proxy statement (DEF 14A), annual meeting May 14, 2026
- Schedule 13D/A, The Coca-Cola Company and European Refreshments (204,243,204 shares, 21.0%)
- Form 10-K for fiscal year 2025 (ended Dec 31, 2025)
- Schedule 13G/A, The Vanguard Group (0 shares reported, as of Mar 13, 2026)
- Schedule 13G, Vanguard Capital Management (5.36%, as of Mar 31, 2026)
22What it does with profit
22What it does with profit
What does Monster Beverage do with its profit?
Buyback · Dec 31, 2022
FY2022: purchases of common stock held in treasury.
$771M
Buyback · Dec 31, 2023
FY2023: purchases of common stock held in treasury.
$659M
Buyback · Dec 31, 2024
FY2024: share purchases in the year Monster ran a modified "Dutch auction" tender offer for its own stock.
$3.8B
Buyback · Dec 31, 2025
FY2025: shares withheld for taxes on employee stock awards; no buyback-program purchases.
$104M
Buyback · Mar 31, 2026
Q1 FY2026: about 1.4 million shares at an average of $73.86, before the split.
$100M
Buyback · Sep 30, 2026
Q3 FY2026: about 2.3 million shares at an average of $43.87, after the split.
$100M
23Governance signals
23Governance signals
What do Monster Beverage's governance filings show?
- Auditor
- Ernst & Young LLP, since 2023
- Auditor changes
- None in the period covered
- Audit qualifications
- None reported
- Related-party dealings
- Monster sometimes charters an aircraft indirectly owned by Chairman Rodney Sacks: $0.06 million in FY2025, $0.05 million in FY2024 and $0.14 million in FY2023. It also consolidates a Kona, Hawaii coffee property held in a 50-50 partnership with one of its directors, which it wrote down by $19.9 million in Q3 FY2026.
- Credit rating
- No public credit rating found in a search of rating agency sites on Nov 7, 2026
Flags to know about
shares as collateral
Shares used as loan collateral by the Chairman
The 2026 proxy says Rodney Sacks has used 100,000 shares (before the Aug 2026 split) as loan collateral, about 0.1% of the shares he beneficially owns. Monster's insider trading policy bars this unless its compliance officer allows it.
related party · Sep 30, 2026
Kona property held with a director
Monster consolidates a Kona, Hawaii coffee property owned through a 50-50 partnership with a director the 10-Q does not name. In Q3 FY2026 it wrote the property down by $19.9 million to $20.0 million and classed it as held for sale.
other
Coca-Cola's three roles
The Coca-Cola Company owns 20.9% of Monster and nominates one director. Bottlers in its network are Monster's main distributors, and Monster's 10-K names Coca-Cola among its competitors. Rob Gehring, CEO of Monster's Americas business, leaves on Nov 30, 2026 to lead Coca-Cola's North America operating unit.
disclosure
What Monster does not report
Monster gives no numeric financial guidance and reports net sales by region, not by country. Its earnings releases point to a call webcast archived on its website for about a year.
24What the market paid
24What the market paid · price as of Nov 5, 2026
What did the market pay for Monster Beverage on Nov 5, 2026?
Price as of Nov 5, 2026 (shown for education; prices change daily).
Price as of Nov 5, 2026: Monster closed at $47.83 on Nasdaq, from Nasdaq's historical price table. Times 1,957.5 million shares (Oct 30, 2026) that is a market value of about $93.6 billion (Cityfort calculation from the Nov 5, 2026 Nasdaq closing price and the Q3 FY2026 10-Q). P/E is price ÷ earnings per share: 43.5 on $1.10 of diluted EPS in the four quarters to Q3 FY2026, adjusted for the Aug 2026 split (Cityfort calculation from the Q4 FY2025 and Q3 FY2026 earnings releases). Monster pays no dividend.
- Share price
- $47.83
- Market value (market cap)
- $93.6B
- P/E
- 43.5×
More price-based ratios · as of Nov 5, 2026
Each ratio divides a number from the company's filings by the market value or share price on Nov 5, 2026. Prices change daily, so these ratios do too.
Price to sales (P/S)
9.8×
$93.6B market value ÷ $9.6B revenue (four quarters to Sep 30, 2026) = 9.8×
Cityfort calculation from the Nov 5, 2026 closing price and the Q4 FY2025 to Q3 FY2026 10-Ks and 10-Qs. Source: MNST historical daily prices, Nasdaq (close of Nov 5, 2026: $47.83); Form 10-Q for Q3 fiscal 2026 (three months ended Sep 30, 2026); Q3 2026 earnings release (8-K Exhibit 99.1) and 7 more
How price ratios workFree cash flow yield
2.1%
$2.0B free cash flow (FY2025) ÷ $93.6B market value = 2.1%
Cityfort calculation from the FY2025 10-K and the Nov 5, 2026 closing price. Source: MNST historical daily prices, Nasdaq (close of Nov 5, 2026: $47.83); Form 10-Q for Q3 fiscal 2026 (three months ended Sep 30, 2026); Q3 2026 earnings release (8-K Exhibit 99.1) and 2 more
What free cash flow means
Shares used for the market value: 1,957.5 million ($47.83 × 1,957.5 million shares ≈ $93.6B). Source: Form 10-Q for Q3 fiscal 2026 (three months ended Sep 30, 2026); 2026 proxy statement (DEF 14A), annual meeting May 14, 2026
Source: MNST historical daily prices, Nasdaq (close of Nov 5, 2026: $47.83); Form 10-Q for Q3 fiscal 2026 (three months ended Sep 30, 2026); Q3 2026 earnings release (8-K Exhibit 99.1) and 1 more
Sources (11)
- MNST historical daily prices, Nasdaq (close of Nov 5, 2026: $47.83)
- Form 10-Q for Q3 fiscal 2026 (three months ended Sep 30, 2026)
- Q3 2026 earnings release (8-K Exhibit 99.1)
- Q4 and full-year 2025 earnings release (8-K Exhibit 99.1)
- Form 10-K for fiscal year 2025 (ended Dec 31, 2025)
- Form 10-Q for Q3 fiscal 2025 (three months ended Sep 30, 2025)
- Q1 2026 earnings release (8-K Exhibit 99.1)
- Form 10-Q for Q1 fiscal 2026 (three months ended Mar 31, 2026)
- Q2 2026 earnings release (8-K Exhibit 99.1)
- Form 10-Q for Q2 fiscal 2026 (three months ended Jun 30, 2026)
- 2026 proxy statement (DEF 14A), annual meeting May 14, 2026
25How it got here
25How it got here
How did Monster Beverage get here?
1992
Milestone
Hansen Natural buys the Hansen's business
Hansen Natural Corporation bought the Hansen's natural soda and apple juice business, which traces back to a 1930s Los Angeles juice seller. It later added energy drinks.
2012
Milestone
Renamed Monster Beverage
Hansen Natural Corporation changed its name to Monster Beverage Corporation.
2015
Business-model change
Deal with Coca-Cola
Monster bought energy drink brands from The Coca-Cola Company and gave up its non-energy drink business.
2016
Milestone
Buys its flavor supplier
Monster bought AFF, a long-time flavor supplier and partner.
2022
Business-model change
Moves into alcohol
Monster bought Monster Brewing Company in February 2022, paying $329.5 million for acquisitions that year.
2023
Milestone
Buys Bang Energy; first stock split
Monster bought the Bang Energy drink business, paying $363.4 million for acquisitions in FY2023. A 2-for-1 stock split was issued on Mar 27, 2023.
2024
Milestone
Tender offer for its own stock
Monster ran a modified "Dutch auction" tender offer for its own stock, and its share purchases for the year totaled $3,771.9 million. In May 2024 it also took a $750 million term loan, repaid in April 2025.
2024
Crisis
Alcohol write-down
Monster recorded $138.8 million of impairments on its Alcohol Brands goodwill, intangibles and equipment.
2025
Milestone
One CEO
Rodney Sacks stepped down as Co-CEO on Jun 12, 2025, staying Chairman; Hilton Schlosberg became sole CEO.
2026
Milestone
Second 2-for-1 split
New shares were issued on Aug 10, 2026, doubling the share count to about 1.96 billion.
Sources (6)
- Form 10-K for fiscal year 2025 (ended Dec 31, 2025)
- EDGAR filing list, Monster Beverage Corp (CIK 0000865752)
- Form 10-K for fiscal year 2023 (ended Dec 31, 2023)
- 8-K filed Mar 10, 2025: Co-CEO transition (Item 5.02)
- 8-K filed Jul 8, 2026: two-for-one stock split (Item 8.01, Exhibit 99.1)
- Form 10-Q for Q3 fiscal 2026 (three months ended Sep 30, 2026)
26Sources and changes
Where every number on this page comes from
Sources (28 documents)
- S1Form 10-K for fiscal year 2025 (ended Dec 31, 2025) · Monster Beverage Corporation (SEC EDGAR) · Tier 1: company or exchange filing · Feb 27, 2026
- S2Form 10-K for fiscal year 2023 (ended Dec 31, 2023) · Monster Beverage Corporation (SEC EDGAR) · Tier 1: company or exchange filing · Feb 29, 2024
- S3Form 10-K for fiscal year 2022 (ended Dec 31, 2022) · Monster Beverage Corporation (SEC EDGAR) · Tier 1: company or exchange filing · Mar 1, 2023
- S4Form 10-Q for Q3 fiscal 2026 (three months ended Sep 30, 2026) · Monster Beverage Corporation (SEC EDGAR) · Tier 1: company or exchange filing · Nov 6, 2026
- S5Form 10-Q for Q2 fiscal 2026 (three months ended Jun 30, 2026) · Monster Beverage Corporation (SEC EDGAR) · Tier 1: company or exchange filing · Aug 7, 2026
- S6Form 10-Q for Q1 fiscal 2026 (three months ended Mar 31, 2026) · Monster Beverage Corporation (SEC EDGAR) · Tier 1: company or exchange filing · May 8, 2026
- S7Form 10-Q for Q3 fiscal 2025 (three months ended Sep 30, 2025) · Monster Beverage Corporation (SEC EDGAR) · Tier 1: company or exchange filing · Nov 7, 2025
- S8Q3 2026 earnings release (8-K Exhibit 99.1) · Monster Beverage Corporation (SEC EDGAR) · Tier 1: company or exchange filing · Nov 5, 2026
- S9Q2 2026 earnings release (8-K Exhibit 99.1) · Monster Beverage Corporation (SEC EDGAR) · Tier 1: company or exchange filing · Aug 6, 2026
- S10Q1 2026 earnings release (8-K Exhibit 99.1) · Monster Beverage Corporation (SEC EDGAR) · Tier 1: company or exchange filing · May 7, 2026
- S11Q4 and full-year 2025 earnings release (8-K Exhibit 99.1) · Monster Beverage Corporation (SEC EDGAR) · Tier 1: company or exchange filing · Feb 26, 2026
- S12Q3 2025 earnings release (8-K Exhibit 99.1) · Monster Beverage Corporation (SEC EDGAR) · Tier 1: company or exchange filing · Nov 6, 2025
- S13Q2 2025 earnings release (8-K Exhibit 99.1) · Monster Beverage Corporation (SEC EDGAR) · Tier 1: company or exchange filing · Aug 7, 2025
- S14Q1 2025 earnings release (8-K Exhibit 99.1) · Monster Beverage Corporation (SEC EDGAR) · Tier 1: company or exchange filing · May 8, 2025
- S15Q4 and full-year 2024 earnings release (8-K Exhibit 99.1) · Monster Beverage Corporation (SEC EDGAR) · Tier 1: company or exchange filing · Feb 27, 2025
- S162026 proxy statement (DEF 14A), annual meeting May 14, 2026 · Monster Beverage Corporation (SEC EDGAR) · Tier 1: company or exchange filing · Mar 27, 2026
- S178-K filed Jul 8, 2026: two-for-one stock split (Item 8.01, Exhibit 99.1) · Monster Beverage Corporation (SEC EDGAR) · Tier 1: company or exchange filing · Jul 8, 2026
- S188-K filed May 15, 2026: annual meeting votes and new $500 million repurchase program (Items 5.07, 8.01) · Monster Beverage Corporation (SEC EDGAR) · Tier 1: company or exchange filing · May 15, 2026
- S198-K filed Sep 25, 2026: CEO Americas to resign (Item 5.02) · Monster Beverage Corporation (SEC EDGAR) · Tier 1: company or exchange filing · Sep 25, 2026
- S208-K filed Sep 4, 2026: Chief Accounting Officer elected (Item 5.02) · Monster Beverage Corporation (SEC EDGAR) · Tier 1: company or exchange filing · Sep 4, 2026
- S228-K filed Mar 10, 2025: Co-CEO transition (Item 5.02) · Monster Beverage Corporation (SEC EDGAR) · Tier 1: company or exchange filing · Mar 10, 2025
- S23Investor meeting slides, Dec 2, 2025 (8-K Item 7.01, Exhibit 99.1) · Monster Beverage Corporation (SEC EDGAR) · Tier 1: company or exchange filing · Dec 2, 2025
- S24Schedule 13D/A, The Coca-Cola Company and European Refreshments (204,243,204 shares, 21.0%) · The Coca-Cola Company (SEC EDGAR) · Tier 1: company or exchange filing · Jan 28, 2025
- S25Schedule 13G, Vanguard Capital Management (5.36%, as of Mar 31, 2026) · Vanguard Capital Management (SEC EDGAR) · Tier 1: company or exchange filing · Apr 30, 2026
- S26Schedule 13G/A, The Vanguard Group (0 shares reported, as of Mar 13, 2026) · The Vanguard Group (SEC EDGAR) · Tier 1: company or exchange filing · Mar 27, 2026
- S27MNST historical daily prices, Nasdaq (close of Nov 5, 2026: $47.83) · Nasdaq, Inc. · Tier 1: company or exchange filing · Nov 5, 2026
- S28SEC XBRL company facts, Monster Beverage Corp (figures as tagged in the 10-K and 10-Q filings) · U.S. Securities and Exchange Commission · Tier 1: company or exchange filing · Nov 7, 2026
- S29EDGAR filing list, Monster Beverage Corp (CIK 0000865752) · U.S. Securities and Exchange Commission · Tier 1: company or exchange filing · Nov 7, 2026
Changes to this page (v1 · Nov 7, 2026)
- v1 · Nov 7, 2026First version, through Q3 FY2026 (quarter ended Sep 30, 2026). (first version)
Numbers come only from tier 1 and tier 2 sources. Read how we research.
Disclaimer
For learning only. Cityfort is not a registered investment adviser or broker-dealer and does not recommend buying or selling any security. Prices shown are dated and may be out of date.
Investing in securities involves risk, including loss of capital. Before making any investment decision, do your own research and consider consulting a registered investment adviser or other qualified professional.
Cityfort, its owners and contributors may or may not hold securities of companies covered. Cityfort is not paid by any company it covers. Content is not an offer or solicitation to buy or sell any security, including in any initial public offering.
Read the positions policyRead the full disclaimerHide the full disclaimer
Cityfort publishes general educational content that explains how listed companies work. Cityfort is not registered with the US Securities and Exchange Commission or any state securities regulator as an investment adviser, and is not a broker-dealer or a member of FINRA. Cityfort does not provide investment, tax or legal advice, recommendations, ratings, price targets or any opinion on whether to buy, sell or hold any security. Nothing on the site is tailored to any person's circumstances.
All information is taken from publicly available sources, mainly company filings with the SEC, which are listed on each page with dates. We work to keep it accurate and correct errors publicly, but we do not guarantee that it is complete, accurate or up to date. Any market price or price-based ratio shown is dated, may be out of date by the time you read it, and is included only to explain concepts.
Statements by company management, including forward-looking statements and guidance, are reported as the company's statements, with their date and source; they are not our forecasts. Adjusted (non-GAAP) figures are the company's own measures and are shown next to the official (GAAP) figures.