Consumer Staples · NYSE: PM
Philip Morris International: how the business works
Philip Morris International sells Marlboro and other cigarettes outside the US, plus IQOS heated tobacco and ZYN nicotine pouches, with net revenues of $40.6 billion in FY2025.
By Hardik Bhandare · Checked against filings: . Editorial policy. Corrections
Follow Philip Morris International
Email me when Philip Morris International's page is updated after earnings.
We'll send a confirmation email first. See our privacy policy.
Philip Morris International Inc. · Stamford, Connecticut · Founded 1987
Updated for Q3 FY2026 · checked
- Net revenues, FY2025 (after excise taxes)
- $40.6B
- Net income, FY2025
- $11.3B
- Smoke-free share of net revenues, FY2025
- 41.5%
- Markets selling its cigarettes, 2025
- About 170
- Employees, Dec 31, 2025
- About 84,900
The short version
Philip Morris International in 5 points
1 · What it sells
Philip Morris International sells Marlboro and other cigarettes outside the US, plus IQOS heated tobacco, ZYN nicotine pouches and VEEV e-vapor, with net revenues of $40.6 billion in FY2025.
2 · Who pays it
In FY2025, cigarette buyers outside the US paid 57.7% of PMI's net revenues, smoke-free buyers outside the US 34.4% and US buyers, mainly of ZYN, 7.9%.
3 · What it keeps from $100
Of every $100 that came in during FY2025, PMI kept $27.4 as net income, which included income from equity investments and securities, and operating income was $36.6 per $100 of net revenues.
4 · Where the operating profit comes from
PMI measures segment profit as gross profit, and in FY2025 International Combustibles earned 56.9% of it, International Smoke-Free 35.1% and the US 8.1%.
5 · The one thing to watch
US smoke-free revenue was $758 million in Q3 FY2026, up from $605 million a year earlier, after $543 million in Q1 FY2026, down from $818 million.
Sources: From PMI's FY2025 10-K, its Mar 13, 2026 segment recast and its Q1 and Q3 FY2026 10-Qs · checked
See the full receipt and the management scorecard below
01Where the money goes · FY2025
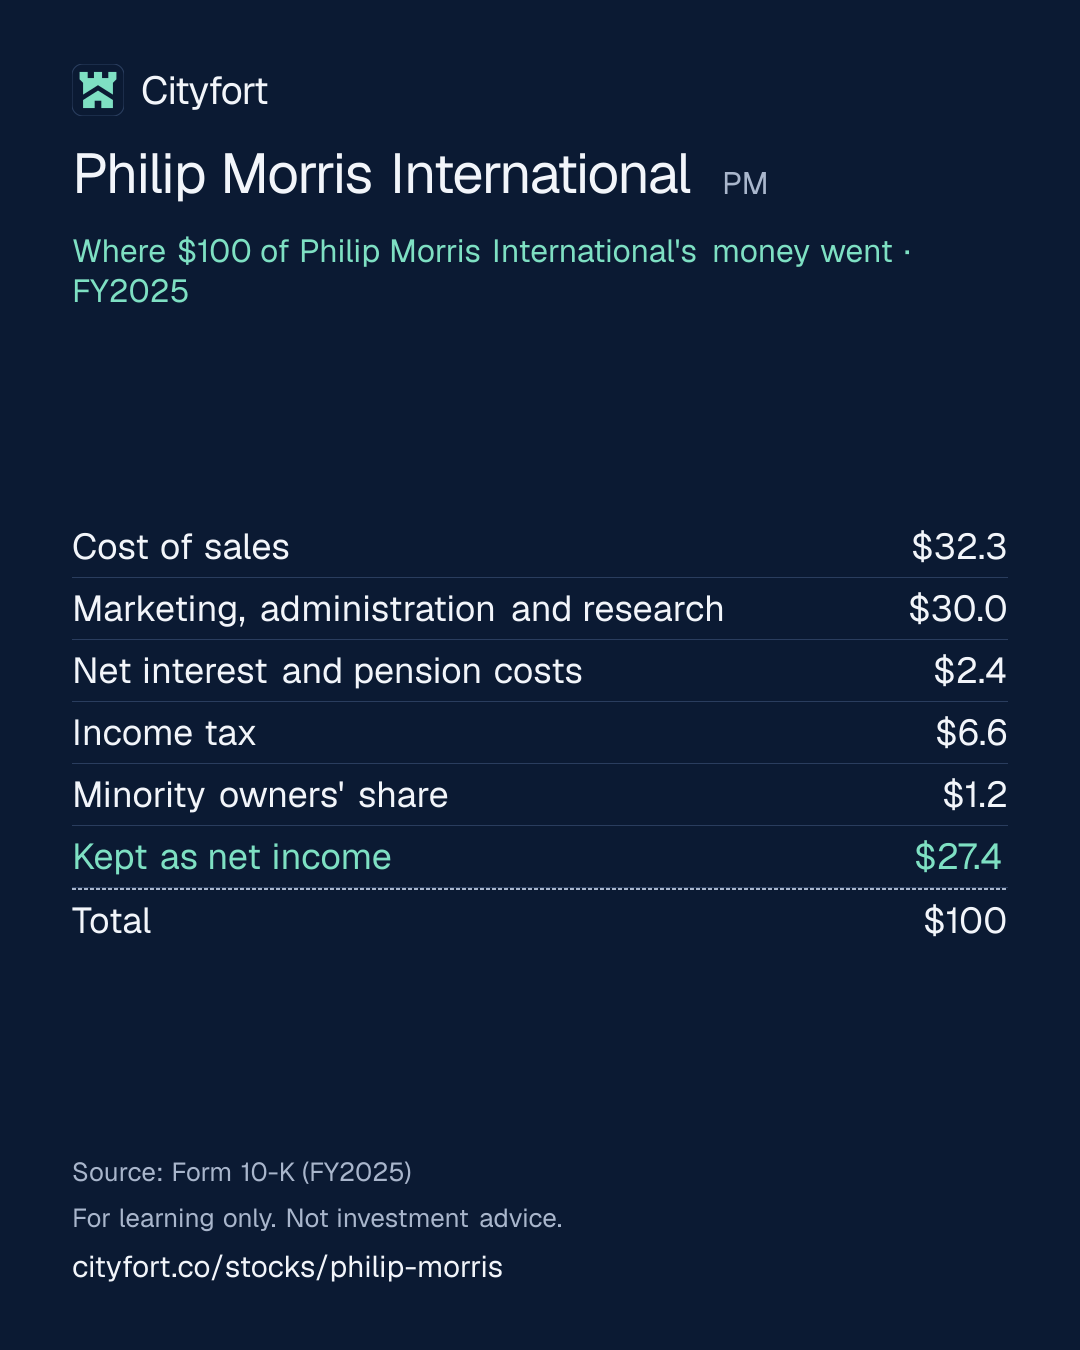
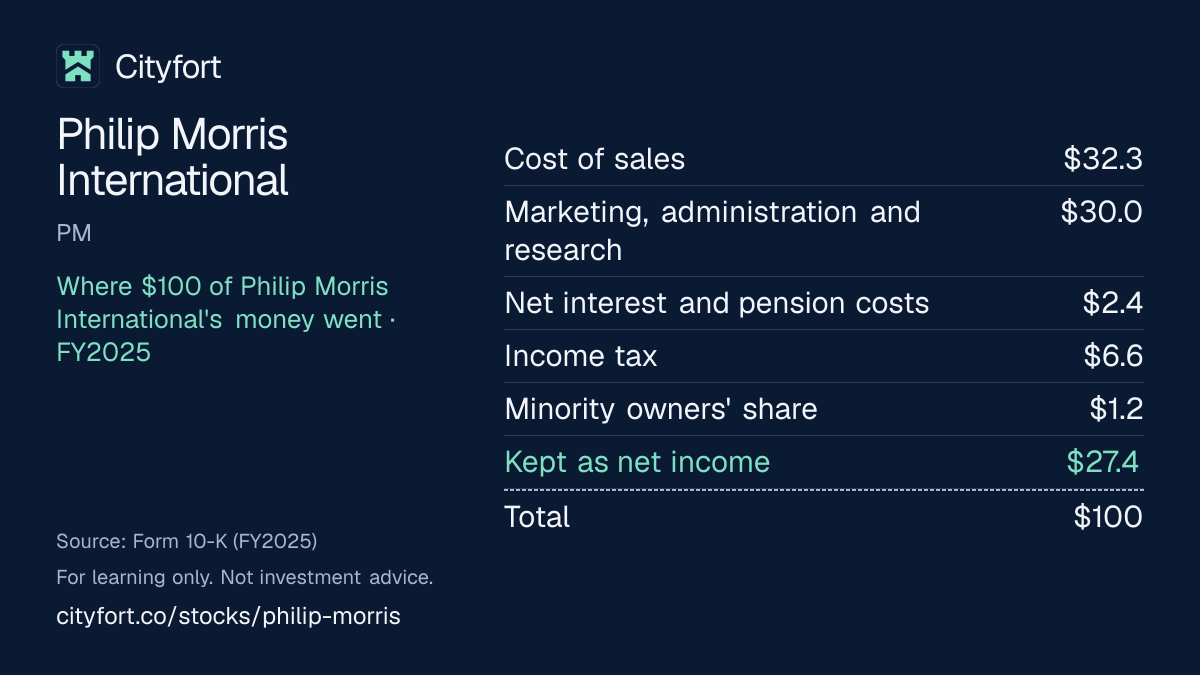
Where does $100 of Philip Morris International's money go?
Philip Morris International · FY2025
Receipt for every $100
| Cost of sales | $32.3 |
|---|---|
| Marketing, administration and research | $30.0 |
| Net interest and pension costs | $2.4 |
| Income tax | $6.6 |
| Minority owners' share | $1.2 |
| Kept as net income | $27.4 |
| Total | $100 |
Each line = amount ÷ total money in × 100. Lines may not add to exactly $100 because of rounding.
How this is worked out
Cityfort calculation from the FY2025 10-K. Of every $100 that came in during FY2025: each line = line ÷ $41.4 billion (net revenues of $40.6 billion plus $705 million of income from equity investments and securities) × 100. Because of that income, net income here ($27.4) is lower than net income ÷ net revenues ($27.9).
Save this receipt as an image:
1080 × 1350 PNG for Instagram, LinkedIn1200 × 675 PNG for X
Embed this receipt
Paste this code into a blog or website to show the receipt, with a link back to this page:
Each week: one company explained in 5 points, picked by earnings date.
Free, no tips, unsubscribe anytime.
We'll send a confirmation email. See our privacy policy.
02The business in one line
What does Philip Morris International do?
Distributors, wholesalers and retailers in about 170 markets pay PMI for cigarettes and smoke-free products; of every $100 that came in during FY2025, $32.3 went on making the goods, $30.0 on marketing, administration and research, and $27.4 was left as net income.
- Cigarettes and other combustible tobacco were 58.5% of FY2025 net revenues. Smoke-free products such as IQOS and ZYN were 41.5%, up from 29.7% in FY2021.
- PMI counts revenue after excise taxes. Those taxes were $53.2 billion in FY2025, more than the $40.6 billion of net revenues.
03Who pays it
Who pays Philip Morris International?
Cigarette buyers outside the US
58%
of revenue
Distributors, wholesalers and retailers buying cigarettes and other combustible tobacco: the International Combustibles segment, $23.4 billion or 57.7% of FY2025 net revenues.
Smoke-free buyers outside the US
34%
of revenue
The same trade buying IQOS devices and sticks, ZYN, VEEV and wellness products: the International Smoke-Free segment, $14.0 billion or 34.4%.
US buyers
8%
of revenue
The U.S. segment, $3.2 billion or 7.9%: $2.9 billion of smoke-free products, mainly ZYN, and $358 million of combustible tobacco.
- Cigarette buyers outside the US58%
- Smoke-free buyers outside the US34%
- US buyers8%
Customer concentration
In many markets PMI sells to distributors. In FY2025 one distributor in Europe bought 12% of net revenues and one in East Asia, Australia and duty-free 10%; PMI does not name them. Sales to related parties were $4.6 billion, including $2.8 billion to the Megapolis Group, which includes PMI's distributor in Russia, 23% owned by PMI.
- Largest customer
- 12%
04Why it makes money
Why does Philip Morris International make money?
Consumers rebuy the same brands, so PMI keeps a large share of each sale even as cigarette volumes fall.
PMI kept $67.1 of gross profit per $100 of FY2025 net revenues after making its products. Price rises have offset falling cigarette volumes: FY2025 cigarette shipments fell 1.5% while combustible revenue rose 2.5%. Marketing, administration and research rose from $26.7 to $30.4 per $100 between FY2021 and FY2025 as PMI built its smoke-free business.
Operating income per $100 of net revenues
$41.3$36.6
FY2021 to FY2025
- Adult smokers in about 170 markets buy the same cigarette brands again and again
- PMI raises prices, which has offset falling cigarette volumes
- Cash from cigarettes pays for research and launches of IQOS, ZYN and VEEV
- Smoke-free products grew to 41.5% of net revenues in FY2025
- What is left pays dividends and interest on debt
↺ Step 5 feeds back into step 1.
05Business segments · FY2025 (recast under the segments PMI adopted on Jan 1, 2026)
Which businesses make up Philip Morris International?
International Combustibles
58%Cigarettes and other combustible tobacco outside the US. FY2025 gross profit, PMI's segment profit measure, was $15.5 billion: 56.9% of the segments' total.
Revenue $23.4B
International Smoke-Free
34%IQOS, ZYN, VEEV and wellness products outside the US. Gross profit was $9.6 billion, 35.1% of the total, and revenue rose from $12.1 billion in FY2024.
Revenue $14.0B
U.S.
8%Mainly ZYN, plus IQOS, wellness and $358 million of combustible tobacco. Gross profit was $2.2 billion, 8.1% of the total.
Revenue $3.2B
How the mix changed
- International Combustibles
- International Smoke-Free
- U.S.
Revenue by segment, FY2024 to FY2025.
US$
See the numbers
06The numbers · Consolidated · US$
How has Philip Morris International done?
Revenue
$40.6BFY2025
Net revenues, which leave out excise taxes, rose every year from $31.4 billion in FY2021 to $40.6 billion in FY2025, and were $11.4 billion in Q3 FY2026.
US$
See the numbers
Net profit
$11.3BFY2025
Net income fell to $7.1 billion in FY2024 after a $2.3 billion write-down of the Canadian unit RBH, which caused a Q4 FY2024 loss, then rose to $11.3 billion in FY2025.
US$
See the numbers
Profit kept per $100 of revenue
$27.9FY2025
Net income per $100 of net revenues ranged from $18.6 in FY2024 to $29.0 in FY2021, and was $27.9 in FY2025.
$ of profit per $100 of revenue (net margin)
See the numbers
Free cash flow
$10.7BFY2025
Free cash flow (cash from operations minus capital spending), a Cityfort calculation from the FY2023 and FY2025 10-Ks, was $10.7 billion in FY2025, against $8.6 billion of dividends paid.
US$ · cash from operations minus spending on plants and equipment
See the numbers
See all yearly numbers
EBITDA here = operating income plus depreciation and amortization (from the cash flow statement). Fiscal years are the company's own (Dec 31; PMI's fiscal year is the calendar year, so Q3 FY2026 is July to September 2026. Net revenues leave out excise taxes. From 2026 PMI moved currency gains and losses and stock award costs into a new line, which changes gross profit but not operating income or net income.). Net profit is the share belonging to the company's owners. Total net income differs from net profit to the company's owners: Total net income includes the share of minority owners in some subsidiaries ($500 million).
Download Philip Morris International's yearly and quarterly numbers (CSV, with source ids)
Learn: Fiscal years that don't end in December: Nvidia's FY2027 explained · Stock-based compensation and dilution: pay that becomes shares
Sources (8)
- Form 10-K, fiscal year 2023 (ended Dec 31, 2023)
- Form 10-K, fiscal year 2022 (ended Dec 31, 2022)
- Form 10-K, fiscal year 2025 (ended Dec 31, 2025)
- Select financial information, Q4 FY2025 (Form 8-K Ex. 99.2, Feb 6, 2026)
- Form 10-Q, Q1 FY2026 (quarter ended Mar 31, 2026)
- Form 10-Q, Q2 FY2026 (quarter ended Jun 30, 2026)
- Form 10-Q, Q3 FY2026 (quarter ended Sep 30, 2026)
- Earnings release, Q3 FY2026 (Form 8-K Ex. 99.1, Oct 21, 2026)
07Who runs it
Who runs Philip Morris International, and did they deliver?
Jacek Olczak
Group Chief Executive Officer · since 2021
CEO since May 2021, titled Group CEO PMI since January 2026. Earlier Chief Operating Officer (2018 to 2021) and Chief Financial Officer (2012 to 2017). His 2025 total pay in the proxy was $29,072,171.
André Calantzopoulos
Chairman of the Board · since 2024
Chairman since May 2024, Executive Chairman from May 2021 to May 2024, and CEO before May 2021. He holds 986,075 shares, including 398,412 held by his spouse.
Emmanuel Babeau
Group Chief Financial Officer
Named in the 2026 proxy as Group Chief Financial Officer; his contract provides for severance if he is dismissed without cause.
What they said, and what happened
4 too early to tell
Said on Feb 6, 2026
PMI forecast on Feb 6, 2026 diluted EPS of $7.87 to $8.02 for 2026, and adjusted diluted EPS of $8.38 to $8.53.
Too early to tellWhat happened
On Oct 21, 2026 PMI cut the reported range to $7.11 to $7.26, after the RBH write-down and losses on equity holdings, and the adjusted range to $8.29 to $8.44. It kept growth excluding currency at 7.5% to 9.5%.
Said on Feb 6, 2026
PMI forecast on Feb 6, 2026 organic net revenue growth of 5% to 7% and organic operating income growth of 7% to 9% for 2026.
Too early to tellWhat happened
PMI kept both ranges on Oct 21, 2026. In Q3 FY2026 organic net revenue grew 7.1% and organic operating income 10.5%.
Said on Feb 6, 2026
PMI said it aims for net debt close to 2.0 times adjusted EBITDAOperating profit before wear-and-tear charges (depreciation and amortization). As a margin: per $100 of sales. by the end of 2026, with no share repurchases.
Too early to tellWhat happened
PMI repeated the aim on Oct 21, 2026. The outcome is due with FY2026 results.
Said on Feb 6, 2026
PMI forecast on Feb 6, 2026 that its 2026 cigarette volume would fall about 3%, with total volume broadly stable.
Too early to tellWhat happened
On Oct 21, 2026 PMI said it expects total volume to grow. Q3 FY2026 cigarette shipments were flat at 158.0 billion units.
08What could go wrong
What could go wrong for Philip Morris International?
- Regulation
Fewer smokers and tighter rules
PMI's 10-K says tax-paid cigarette use keeps falling in many markets, and governments add taxes, flavor bans, plain packs and generation bans. Combustible tobacco was 58.5% of FY2025 net revenues.
Watch Cigarette shipments each quarter: down 1.5% in FY2025, flat in Q3 FY2026.
- Regulation
US growth depends on FDA decisions
PMI's 10-K says its US success depends on an evolving legal and regulatory framework. ZYN variants won FDA authorizations in 2026, but IQOS ILUMA still awaits one.
Watch FDA decisions on IQOS ILUMA and new ZYN products.
- Pricing
Smoke-free products taxed like cigarettes
PMI says it may fail to get lower taxes for smoke-free products than for cigarettes. Germany classified TEREA sticks as cigarettes for excise tax, a $176 million charge in FY2025.
Watch Excise changes on heated tobacco in large markets.
- Other
Business in Russia
Russia was about 6% of PMI's 2025 net revenues and 9% of its cigarette and heated tobacco shipments. About $2.3 billion of cash sat there at Dec 31, 2025, mostly in rubles, and PMI says a sale would likely bring a material impairment.
Watch Russia notes in each 10-Q, and the Russian cash balance.
- Debt
Debt and currencies
PMI had $47.6 billion of debt at Sep 30, 2026, including euro-denominated notes. Most revenue is earned outside the US, so currency moves change dollar results.
Watch Net debt, credit ratings and the currency effect PMI states each quarter.
- Concentration
One plant makes US ZYN
PMI's 10-K says its Kentucky plant supplies substantially all of its capacity for ZYN sales in the US.
Watch Any disruption PMI reports at the plant, and US ZYN shipments.
- Legal
Tobacco lawsuits
Seven health care cost recovery cases were pending at Dec 31, 2025, in which plaintiffs seek reimbursement of health care costs allegedly caused by tobacco products. PMI's 10-K says the amounts sought could range into the billions of dollars.
Watch The litigation note in each 10-Q.
- Other
Write-downs move net income
RBH write-downs cut net income by $2,316 million in FY2024 and $511 million in Q2 FY2026. Fair-value changes on holdings in India and Sri Lanka also move profit: a $339 million after-tax loss in the first nine months of 2026.
Watch Items PMI lists between reported and adjusted EPS.
09Both sides
What do supporters and critics point to?
What supporters point to
- Smoke-free products rose from 29.7% of net revenues in FY2021 to 41.5% in FY2025.
- Net revenues rose every year from FY2021 to FY2025, from $31.4 billion to $40.6 billion.
- Q3 FY2026 operating income rose 14.1% to $4.9 billion, or 10.5% on PMI's organic measure.
- Free cash flow was $10.7 billion in FY2025, and PMI raised its quarterly dividend 8.8% to $1.60 in September 2026.
- The FDA authorized 20 ZYN variants as modified-risk products on Jun 30, 2026, and authorized 11 ZYN ULTRA variants for sale (PMTA) on Aug 21, 2026.
What critics point to
- PMI had $47.6 billion of debt and a stockholders' deficit of $7.9 billion at Sep 30, 2026.
- Dividends paid were 101.9% of net income in FY2023 and 116.2% in FY2024.
- US smoke-free revenue fell to $543 million in Q1 FY2026 from $818 million a year earlier.
- PMI cut its 2026 diluted EPS range to $7.11 to $7.26 on Oct 21, 2026, from $7.87 to $8.02 in February.
- About $2.3 billion of PMI's cash at Dec 31, 2025 was held in Russia, mostly in rubles.
10What to watch next
What should you watch next at Philip Morris International?
Next event
Q4 FY2026 and full-year 2026 results
Date not announced yet.
ZYN and IQOS in the US
US smoke-free revenue was $758 million in Q3 FY2026, up from $605 million, after falling in Q1 FY2026. IQOS ILUMA still awaits FDA authorization.
Debt aim
PMI said on Oct 21, 2026 that it aims for net debt close to 2.0 times adjusted EBITDA, its own measure, by the end of 2026. Debt was $47.6 billion at Sep 30, 2026.
Cigarette volume
PMI forecast in February 2026 a cigarette volume decline of about 3%. Q3 FY2026 cigarette shipments were flat at 158.0 billion units.
11Key facts
Key facts about Philip Morris International
- What does Philip Morris International do?
- Philip Morris International (PMI) makes and sells cigarettes, led by Marlboro, in about 170 markets outside the US, plus smoke-free products: IQOS heated tobacco, ZYN nicotine pouches and VEEV e-vapor. PMI's net revenues were $40.6 billion in FY2025, the year ended Dec 31, 2025.
- How does Philip Morris International make money?
- Philip Morris International's business model is selling tobacco and nicotine products to distributors, wholesalers and retailers, who resell them to adult consumers. In FY2025, combustible tobacco brought PMI $23.8 billion (58.5% of net revenues) and smoke-free products $16.9 billion (41.5%). Of every $100 that came in, PMI kept $27.4 as net income.
- Is Philip Morris International profitable?
- Yes. Philip Morris International's net income was $11.3 billion in FY2025, up from $7.1 billion in FY2024, when a $2.3 billion write-down of its Canadian unit RBH cut profit. PMI's FY2025 operating income was $14.9 billion. In Q3 FY2026 (July to September 2026), PMI's net income was $3.3 billion.
- What is Philip Morris International's revenue by segment?
- Philip Morris International has reported three segments since Jan 1, 2026. Under that split, FY2025 net revenues were $23.4 billion for International Combustibles (57.7%), $14.0 billion for International Smoke-Free (34.4%) and $3.2 billion for the U.S. (7.9%). PMI measures segment profit as gross profit.
- Who owns Philip Morris International?
- Philip Morris International has one class of common stock, with one vote per share and 1,558.7 million shares on Oct 16, 2026. PMI's 2026 proxy lists Capital World Investors with 8.17% and BlackRock with 6.22%, from earlier filings. In 2026 filings, Vanguard Capital Management reported 7.48% and Capital Research Global Investors 5.1% (both at Mar 31, 2026).
- How big is IQOS for Philip Morris International?
- Philip Morris International shipped 155.1 billion heated tobacco units, the sticks used in IQOS devices, in FY2025, up 11.0%. PMI's International Smoke-Free segment, mainly IQOS outside the US, had net revenues of $14.0 billion in FY2025, up from $12.1 billion in FY2024.
- How big is ZYN for Philip Morris International?
- Philip Morris International shipped 20.7 billion oral nicotine units, mainly ZYN pouches, in FY2025, up 18.5%. In the US, PMI shipped 793.7 million cans of nicotine pouches in FY2025, up 36.7%, and 3.2 billion ZYN pouches in Q3 FY2026, up 4.2%. PMI bought ZYN's maker, Swedish Match, in November 2022.
- Does Philip Morris International sell Marlboro in the US?
- No. Philip Morris International owns the Marlboro trademark rights outside the US only, according to its FY2025 10-K. Marlboro was about 43% of PMI's 2025 cigarette shipment volume. PMI's U.S. segment sells mainly smoke-free products: $2.9 billion of its $3.2 billion of FY2025 net revenues.
- Where does Philip Morris International sell its products?
- Philip Morris International sells mostly outside the US. Under its old regional segments, Europe was 42.1% of FY2025 net revenues, South and Southeast Asia, CIS, Middle East and Africa 29.6%, East Asia, Australia and duty-free 16.3%, and the Americas 11.9%. Japan, PMI's largest market, brought in $4.2 billion in FY2025.
- Is Philip Morris International part of Altria?
- No. Philip Morris International was spun off from Altria and became a separate public company on the NYSE in March 2008. Altria held the US rights to IQOS until Apr 30, 2024, under a 2022 agreement that gave PMI the full US rights.
Sources (8)
- Form 10-K, fiscal year 2025 (ended Dec 31, 2025)
- Form 10-Q, Q3 FY2026 (quarter ended Sep 30, 2026)
- Form 8-K Ex. 99.1: recast 2025 vs 2024 results under the new segments (Mar 13, 2026)
- Definitive proxy statement (DEF 14A), 2026 annual meeting
- Schedule 13G, Vanguard Capital Management (event Mar 31, 2026)
- Schedule 13G, Capital Research Global Investors (event Mar 31, 2026)
- Earnings release, Q3 FY2026 (Form 8-K Ex. 99.1, Oct 21, 2026)
- Form 10-K, fiscal year 2023 (ended Dec 31, 2023)
Terms on this page
- Capital expenditures (capex)
- Customer concentration
- Dividend payout ratio
- Earnings per share (EPS)
- EBITDA
- Free cash flow
- Interest coverage
- Market cap
- Net debt
- Net margin
Each explains the term in plain English, with the same number from other companies on Cityfort.
Go deeper
More detail from the same filings. Open any section.
12What it sells
12What it sells
What does Philip Morris International sell?
Cigarettes and other combustible tobacco ($23.8B in FY2025)
607.4 billion cigarettes shipped in FY2025, down 1.5%. Marlboro was about 43% of that volume, and the top five international brands 81%.
IQOS heated tobacco
An electronic device that heats tobacco sticks (TEREA, HEETS) instead of burning them. PMI shipped 155.1 billion sticks in FY2025, up 11.0%.
ZYN nicotine pouches
Small pouches held under the lip. PMI shipped 20.7 billion oral nicotine units in FY2025, up 18.5%, and 793.7 million cans of pouches in the US.
VEEV e-vapor
E-cigarettes. Shipments doubled to 3.3 billion units in FY2025, still small next to heated tobacco.
Wellness (Aspeya)
Mainly oral wellness products, including cannabinoid (CBD) items where allowed. Net revenues were $238 million in FY2025.
What it does
- Does: Sells cigarettes in about 170 markets and smoke-free products in 110 markets (Q3 FY2026)
- Does: Makes its products in 50 factories, 11 of them for heated tobacco sticks and 10 for oral nicotine
- Does: Sells ZYN, IQOS and wellness products in the US through its U.S. segment
What it does not do
- Does not: Does not own Marlboro in the US: its 10-K says its Marlboro trademark rights cover markets outside the US
- Does not: Is not part of Altria: it became a separate company in March 2008
- Does not: Does not count excise taxes as revenue: they were $53.2 billion in FY2025
- Does not: No longer owns Vectura, the inhaled-medicine maker it sold on Dec 31, 2024
13How the money flows
13How the money flows · FY2025
How does money flow through Philip Morris International?
Money in
- Net revenues (after excise taxes)$40.6B
- Income from equity investments and securities$705M
The company
Philip Morris International
$41.4B came in
Money out
- Cost of sales (making and shipping the products)$13.4B
- Marketing, administration and research (including a $41 million goodwill write-down)$12.4B
- Net interest and pension costs$1.0B
- Income tax$2.7B
- Minority owners' share of subsidiaries' profit$500M
- Net income to PMI$11.3B
- Distributors, wholesalers and retailers paid PMI $40.6 billion of net revenues in FY2025, after $53.2 billion of excise taxes.
- Making and shipping the products cost $13.4 billion, leaving $27.3 billion of gross profit.
- Marketing, administration and research took $12.3 billion, plus a $41 million goodwill write-down, leaving $14.9 billion of operating income.
- Net interest and pension costs took $1.0 billion and income tax $2.7 billion, while equity investments and securities added $705 million.
- Minority owners of some subsidiaries took $500 million, leaving $11.3 billion of net income for PMI.
14What it needs to run
14What it needs to run
What does Philip Morris International need to run?
Factories
50 factories at the end of 2025: 11 make heated tobacco sticks and 10 make oral nicotine products.
The ZYN plant in Kentucky
PMI's 10-K says this plant supplies substantially all of its capacity for ZYN sales in the US.
Brands and trademarks
Marlboro (outside the US), IQOS, IQOS ILUMA, TEREA, HEETS, VEEV and ZYN, which PMI owns or has the right to use where they are sold.
Research
Research and development cost $756 million in FY2025. PMI says it has invested over $16 billion in smoke-free products since 2008.
People
About 84,900 employees worldwide at Dec 31, 2025, including temporary and part-time staff.
15Where it sells
15Where it sells · FY2025 (the four regions PMI reported until 2025)
Where does Philip Morris International sell?
- Europe42%
- South and Southeast Asia, CIS, Middle East and Africa30%
- East Asia, Australia and PMI duty-free16%
- Americas12%
16Competitors and what protects it
16Competitors and what protects it
Who does Philip Morris International compete with?
Altria Group
NYSE: MO
Named as a competitor in PMI's FY2025 10-K. PMI was spun off from Altria in 2008. Altria's FY2025 operating income was $9.9 billion, against PMI's $14.9 billion.
British American Tobacco
Named as a competitor in PMI's FY2025 10-K. On Feb 1, 2024 the two companies' subsidiaries signed an eight-year agreement settling certain pending legal proceedings between them.
Japan Tobacco
Named as a competitor in PMI's FY2025 10-K. Japan is PMI's largest market, with $4.2 billion of FY2025 net revenues, and PMI says IQOS holds 68% of Japan's heated tobacco category.
Imperial Brands
Named as a competitor in PMI's FY2025 10-K, and in the tobacco peer group of PMI's CAGNY 2026 presentation.
What protects the business
Each strength is scored 1 (weak) to 5 (strong) for the business, with the reason. It is not a rating of the share.
- Brands4 of 5
Marlboro was about 43% of PMI's 2025 cigarette shipments, and its top five international brands 81%.
- Lead in heated tobacco4 of 5
PMI says it has about three-quarters of heated tobacco volume, and that it has invested over $16 billion in smoke-free products since 2008.
- Reach and scale4 of 5
Cigarettes in about 170 markets, a market share of at least 15% in about 100 of them, and 50 factories.
- US product authorizations3 of 5
The FDA authorized 20 ZYN variants as modified-risk products on Jun 30, 2026, and authorized 11 ZYN ULTRA variants for sale (PMTA) on Aug 21, 2026. IQOS ILUMA still awaits US authorization.
Weak spot
Cigarettes still bring in most of the money
Combustible tobacco was 58.5% of FY2025 net revenues, and International Combustibles 56.9% of segment gross profit. Cigarette shipments fell 1.5% in FY2025, and PMI's 10-K lists taxes, flavor bans and plain packaging among the risks.
Sources (5)
- Form 10-K, fiscal year 2025 (ended Dec 31, 2025)
- XBRL company facts, Altria Group (CIK 0000764180), FY2025 10-K values
- Earnings release, Q3 FY2026 (Form 8-K Ex. 99.1, Oct 21, 2026)
- CAGNY 2026 presentation slides (Form 8-K exhibit, Feb 18, 2026)
- Form 8-K Ex. 99.1: recast 2025 vs 2024 results under the new segments (Mar 13, 2026)
17Where growth could come from
17Where growth could come from
Where could Philip Morris International's growth come from?
PMI said on Oct 21, 2026 that it expects 2026 organic net revenue growth of 5% to 7% and organic operating income growth of 7% to 9%. It expects 2026 diluted EPS of $7.11 to $7.26, and adjusted diluted EPS of $8.29 to $8.44. On Feb 6, 2026 it set 2026 to 2028 targets of 6% to 8% a year organic net revenue growth and 9% to 11% adjusted EPS growth excluding currency, with no buybacks. Organic growth and adjusted EPS are PMI's own measures.
IQOS heated tobacco
MixedSticks +11.0% in FY2025, +1.5% in Q3 FY2026
PMI shipped 155.1 billion heated tobacco sticks in FY2025 and 41.5 billion in Q3 FY2026. International Smoke-Free revenue was $3.9 billion in Q3 FY2026, about level with a year earlier.
Status: Mixed, partly on track.
ZYN in the US
MixedUS smoke-free revenue $758M, Q3 FY2026
US smoke-free revenue was $758 million in Q3 FY2026, up from $605 million a year earlier. In Q1 FY2026 it was $543 million, down from $818 million. US ZYN shipments rose 4.2% to 3.2 billion pouches in Q3 FY2026.
Status: Mixed, partly on track.
Cigarette pricing
WorkingCombustible revenue +2.5% in FY2025
Combustible revenue rose from $23.2 billion to $23.8 billion in FY2025 while cigarette shipments fell 1.5%. Combustible net revenues rose 6.4% in Q3 FY2026.
Status: Working, on track against what the company said.
VEEV e-vapor
Early3.3 billion units in FY2025
E-vapor shipments doubled in FY2025 and rose 61.6% to 1.4 billion units in Q3 FY2026, small next to heated tobacco.
Status: Early, too early to judge.
IQOS in the US
EarlySold in Austin, Texas since Mar 27, 2025
PMI regained the full US rights to IQOS from Altria on Apr 30, 2024. It sells IQOS 3.0, the blade version, in a limited roll-out while it waits for FDA authorization of IQOS ILUMA.
Status: Early, too early to judge.
Status compares progress with what the company itself said it would do: Working = on track against what the company said; Mixed = partly on track; Behind = behind the company's own plan; New = recently announced; Early = too early to judge.
18The company's own measures (non-GAAP)
18The company's own measures · FY2025 and Q3 FY2026 (July to September 2026)
What do Philip Morris International's own measures show?
Official (GAAP): Diluted EPS, FY2025
$7.26
Company's own measure: Adjusted diluted EPS, FY2025
$7.54
PMI adds back items such as amortization of acquired intangibles ($0.50 a share), restructuring ($0.14) and the German excise charge ($0.10), and takes out gains such as $0.18 from equity holdings in India and Sri Lanka.
Official (GAAP): Diluted EPS, Q3 FY2026
$2.12
Company's own measure: Adjusted diluted EPS, Q3 FY2026
$2.36
Adds back amortization of intangibles ($0.13), the loss on equity holdings ($0.06), a Dutch pension buy-out loss ($0.04) and a Swedish Match financing tax item ($0.01).
Official (GAAP): Operating income, FY2025
$14.9B
Company's own measure: Operating companies income, FY2025
$15.5B
PMI's segment total from 2026: operating income before the "corporate expenses and other" line, which holds items such as currency gains and losses and stock award costs. International was $15.2 billion and the U.S. $322 million.
Official (GAAP): Net revenue growth, Q3 FY2026 (reported)
5.5%
Company's own measure: Organic net revenue growth, Q3 FY2026
7.1%
PMI's organic growth uses adjusted results and leaves out currency, acquisitions and divestitures.
Official (GAAP): Operating income growth, Q3 FY2026 (reported)
14.1%
Company's own measure: Organic operating income growth, Q3 FY2026
10.5%
Same definition as organic net revenue growth.
These are the company's own measures, defined by the company. They are not comparable across companies, and they are not added together. Each sits beside the nearest official (GAAP) figure.
Learn: Non-GAAP measures: what a company's "adjusted" numbers leave out
19Financial strength and debt
19Financial strength · Sep 30, 2026
How much debt does Philip Morris International have?
- Total debt$47.6B
- Cash and investments$6.7B
- Net debt (debt minus cash)$40.9B
- Net worth (shareholders' money)−$7.9B
- Interest cover
- 15.4×
- how many times operating profit covers interest
- Debt is short-term borrowings plus long-term debt, without leases; PMI states total debt of $47.6 billion at Sep 30, 2026. Net debt and the 3.3 times figure are a Cityfort calculation from the Q3 FY2026 10-Q and the FY2025 10-K.
- PMI's stockholders' deficit was $7.9 billion at Sep 30, 2026: total liabilities exceed total assets. At Dec 31, 2025 shares bought back at a cost of $35.6 billion and $12.3 billion of accumulated other comprehensive losses drove the deficit, so debt-to-equity is not shown.
- About $2.3 billion of the $4.9 billion of cash at Dec 31, 2025 was held by PMI's Russian business, mostly in rubles.
- Interest coverage (FY2025 operating income ÷ net interest expense of $966 million) is a Cityfort calculation from the FY2025 10-K.
- At Sep 30, 2026 PMI had $1.9 billion of commercial paper outstanding and $6.0 billion of unused revolving credit. PMI said on Oct 21, 2026 that it aims for net debt close to 2.0 times its adjusted EBITDA, its own measure, by the end of 2026.
20Who owns it
20Who owns it · ownership as of Mar 13, 2026
Who owns Philip Morris International?
- Officers and directors (as a group), shares
- 0.1%
Share classes
Holders of 5% or more
From the company's proxy statement (DEF 14A), later Schedule 13G filings and the share counts on its latest annual or quarterly report. Each holder row shows the date of its own filing.
Insider trades · Form 4 data as of Nov 6, 2026
What did Philip Morris International's insiders report trading?
Philip Morris International's insiders made 24 Form 4A filing an insider must make within two business days of buying or selling the company's shares. Learn more filings in the 12 months to Nov 6, 2026.
They reported no purchases and 7 sales (158,150 shares) in the open market or privately (codes P and S).
None of the sales were on forms with the Rule 10b5-1 plan box checked.
The same filings report 32 other share transactions (A: 23, F: 9).
Insiders are a company's officers, directors and owners of more than 10% of a class of its shares. Most changes in their holdings must be reported to the SEC on a Form 4 within two business days. Source: SEC Form 4 filings on EDGAR.
- P
- a purchase in the open market or privately
- S
- a sale in the open market or privately
- A
- a grant, award or other acquisition from the company under Rule 16b-3
- F
- shares withheld or handed over to pay an exercise price or tax when an award is received, exercised or vests
Code meanings: General Instruction 8 of Form 4 (SEC).
The latest 25 of 39 transactions
Shares: A = acquired, D = disposed of. A price the filing gives only in a footnote shows as “See filing”. The 10b5-1 box is checked when at least one trade on the form was made under a Rule 10b5-1 plan. A Form 4/A replaces the form it amends. See all of Philip Morris International's Form 4 filings on EDGAR.
Learn: How to read a proxy statement (DEF 14A): Nvidia's 2026 proxy · Form 4 insider filings: who files, the codes and the footnotes · Rule 10b5-1 trading plans: how insiders pre-schedule their trades
Sources (5)
21What it does with profit
21What it does with profit
What does Philip Morris International do with its profit?
Dividend per share
$5.64FY2025
Dividend paid for each share, by financial year.
$ per share
See the numbers
Buyback · Dec 31, 2021
FY2021: paid $775 million for its own shares.
$775M
Buyback · Dec 31, 2022
FY2022: paid $209 million for its own shares. None since.
$209M
22Governance signals
22Governance signals
What do Philip Morris International's governance filings show?
- Auditor
- PricewaterhouseCoopers SA, since 2008
- Auditor changes
- None in the period covered
- Audit qualifications
- None reported
- Related-party dealings
- PMI sold $4.6 billion of products to related parties in FY2025, such as companies it partly owns; $2.8 billion went to the Megapolis Group, which includes TKM, its 23%-owned distributor in Russia. The 2026 proxy reports the Group Controller's wife as an employee paid about $750,000 in 2025, and a $300,000-a-year consulting deal with a former director's firm.
- Credit rating
- Moody's, S&P and Fitch (as stated in PMI's Q3 FY2026 10-Q) A2 / P-1 (Moody's); A- / A-2 (S&P); A / F1 (Fitch) (Positive (Moody's), Positive (S&P), Stable (Fitch), at Sep 30, 2026), Sep 30, 2026
A credit rating describes the company's ability to repay debt. It is not a rating of the share.
Flags to know about
other
Canadian unit RBH
PMI's Canadian subsidiary RBH has been outside its consolidated accounts since Mar 22, 2019, when it obtained court protection under Canada's Companies' Creditors Arrangement Act. A plan resolving Canadian tobacco claims, with a CAD 32.5 billion global settlement amount shared with two other companies, took effect on Aug 29, 2025. PMI wrote down its RBH investment by $2,316 million in FY2024 and $511 million in Q2 FY2026; it was carried at $51 million at Sep 30, 2026.
regulatory
German excise ruling on TEREA
In August 2024 Germany's Main Customs Office classified TEREA heated tobacco sticks as cigarettes for excise tax, with an assessment of EUR 151 million (about $176 million) for Feb 15, 2023 to Aug 1, 2024. PMI recorded the charge in FY2025.
other
Health care cost recovery cases
At Dec 31, 2025 seven health care cost recovery cases were pending (one in Brazil, one in South Korea, five in Nigeria), down from 17 a year earlier. In these cases plaintiffs seek reimbursement of health care costs allegedly caused by tobacco products.
related party
Related-person transactions
The 2026 proxy reports that the wife of the Group Controller is a PMI employee paid about $750,000 in 2025, and that a former director's firm has a two-year consulting agreement at $300,000 a year from Jan 1, 2026. Both were reviewed under PMI's related-person policy.
shares as collateral
PMI stock as collateral
PMI's policy bars directors and executive officers from using PMI stock as collateral, hedging it or selling it short.
disclosure
Segments changed in 2026
From Jan 1, 2026 PMI reports three segments measured by gross profit, with marketing costs not allocated, in place of four regions measured by operating income. The new segments are recast only for 2024 and 2025.
23What the market paid
23What the market paid · price as of Nov 5, 2026
What did the market pay for Philip Morris International on Nov 5, 2026?
Price as of Nov 5, 2026 (shown for education; prices change daily).
Price as of Nov 5, 2026: $201.50, the close shown in Nasdaq's historical price table for PMI (Nasdaq data); the shares list on the NYSE. Times 1,558.7 million shares (Oct 16, 2026), that is a market value of about $314.1 billion (Cityfort calculation from the Nov 5, 2026 closing price and the Q3 FY2026 10-Q cover). P/E is price ÷ earnings per share: 29.4 on diluted EPS of $6.85 for the four quarters to Sep 30, 2026 (Cityfort calculation from the Q4 FY2025 earnings release and the Q1 to Q3 FY2026 10-Qs). That EPS includes the $511 million RBH write-down in Q2 FY2026. The quarterly dividend of $1.60 adds up to $6.40 a year, 3.2% of that price. Price-to-book is not shown because PMI has a stockholders' deficit.
- Share price
- $201.50
- Market value (market cap)
- $314.1B
- P/E
- 29.4×
More price-based ratios · as of Nov 5, 2026
Each ratio divides a number from the company's filings by the market value or share price on Nov 5, 2026. Prices change daily, so these ratios do too.
Price to sales (P/S)
7.3×
$314.1B market value ÷ $43.1B revenue (four quarters to Sep 30, 2026) = 7.3×
Cityfort calculation from the Nov 5, 2026 closing price and the Q4 FY2025 to Q3 FY2026 10-Qs and earnings releases. Source: PM historical closing prices, Nasdaq's table for an NYSE-listed share (close of Nov 5, 2026: $201.50); Form 10-Q, Q3 FY2026 (quarter ended Sep 30, 2026); Form 10-Q, Q2 FY2026 (quarter ended Jun 30, 2026) and 3 more
How price ratios workDividend yield
2.80%
$5.64 dividends per share (FY2025) ÷ $201.50 share price = 2.80%
Cityfort calculation from the FY2025 10-K and the Nov 5, 2026 closing price. Source: PM historical closing prices, Nasdaq's table for an NYSE-listed share (close of Nov 5, 2026: $201.50); Form 10-Q, Q3 FY2026 (quarter ended Sep 30, 2026); Form 10-Q, Q2 FY2026 (quarter ended Jun 30, 2026) and 5 more
What dividend yield meansFree cash flow yield
3.4%
$10.7B free cash flow (FY2025) ÷ $314.1B market value = 3.4%
Cityfort calculation from the FY2025 10-K and the Nov 5, 2026 closing price. Source: PM historical closing prices, Nasdaq's table for an NYSE-listed share (close of Nov 5, 2026: $201.50); Form 10-Q, Q3 FY2026 (quarter ended Sep 30, 2026); Form 10-Q, Q2 FY2026 (quarter ended Jun 30, 2026) and 4 more
What free cash flow means
Shares used for the market value: 1,558.66 million ($201.50 × 1,558.66 million shares ≈ $314.1B). Source: Form 10-Q, Q3 FY2026 (quarter ended Sep 30, 2026)
Source: PM historical closing prices, Nasdaq's table for an NYSE-listed share (close of Nov 5, 2026: $201.50); Form 10-Q, Q3 FY2026 (quarter ended Sep 30, 2026); Form 10-Q, Q2 FY2026 (quarter ended Jun 30, 2026) and 3 more
Sources (8)
- PM historical closing prices, Nasdaq's table for an NYSE-listed share (close of Nov 5, 2026: $201.50)
- Form 10-Q, Q3 FY2026 (quarter ended Sep 30, 2026)
- Form 10-Q, Q2 FY2026 (quarter ended Jun 30, 2026)
- Form 10-Q, Q1 FY2026 (quarter ended Mar 31, 2026)
- Select financial information, Q4 FY2025 (Form 8-K Ex. 99.2, Feb 6, 2026)
- Earnings release, Q3 FY2026 (Form 8-K Ex. 99.1, Oct 21, 2026)
- XBRL company facts, Philip Morris International (CIK 0001413329)
- Form 10-K, fiscal year 2025 (ended Dec 31, 2025)
24How it got here
24How it got here
How did Philip Morris International get here?
1987
Milestone
Incorporated
Philip Morris International Inc. was incorporated in Virginia in 1987.
2008
Business-model change
Spun off from Altria
PMI became a separate public company on the NYSE in March 2008, selling outside the US.
2014
Business-model change
IQOS launched
PMI first introduced IQOS heated tobacco in Nagoya, Japan.
2019
Crisis
Canadian unit seeks court protection
RBH obtained court protection under Canada's Companies' Creditors Arrangement Act on Mar 22, 2019, and left PMI's consolidated accounts.
2022
Business-model change
US IQOS rights regained
On Oct 20, 2022 PMI agreed with Altria to end their IQOS arrangement, giving PMI full US rights from Apr 30, 2024.
2022
Business-model change
Swedish Match bought
PMI bought Swedish Match, maker of ZYN, on Nov 11, 2022, using $14.0 billion of cash net of the cash acquired.
2024
Crisis
RBH write-down
PMI wrote down its RBH investment by $2,316 million, which caused a Q4 FY2024 net loss.
2025
Milestone
Canadian settlement plan in force
A plan with a CAD 32.5 billion global settlement amount for RBH and two other tobacco companies took effect on Aug 29, 2025.
2026
Business-model change
New segments
From Jan 1, 2026 PMI reports International Smoke-Free, International Combustibles and U.S. segments.
2026
Milestone
FDA authorizations for ZYN
The FDA authorized 20 ZYN variants as modified-risk products on Jun 30, 2026, and authorized 11 ZYN ULTRA variants for sale (PMTA) on Aug 21, 2026.
25Sources and changes
Where every number on this page comes from
Sources (19 documents)
- S1Form 10-K, fiscal year 2025 (ended Dec 31, 2025) · Philip Morris International Inc. (SEC EDGAR) · Tier 1: company or exchange filing · Feb 6, 2026
- S2Form 10-K, fiscal year 2023 (ended Dec 31, 2023) · Philip Morris International Inc. (SEC EDGAR) · Tier 1: company or exchange filing · Feb 8, 2024
- S3Form 10-K, fiscal year 2022 (ended Dec 31, 2022) · Philip Morris International Inc. (SEC EDGAR) · Tier 1: company or exchange filing · Feb 10, 2023
- S4Form 10-Q, Q3 FY2026 (quarter ended Sep 30, 2026) · Philip Morris International Inc. (SEC EDGAR) · Tier 1: company or exchange filing · Oct 23, 2026
- S5Form 10-Q, Q2 FY2026 (quarter ended Jun 30, 2026) · Philip Morris International Inc. (SEC EDGAR) · Tier 1: company or exchange filing · Jul 24, 2026
- S6Form 10-Q, Q1 FY2026 (quarter ended Mar 31, 2026) · Philip Morris International Inc. (SEC EDGAR) · Tier 1: company or exchange filing · Apr 24, 2026
- S7Earnings release, Q3 FY2026 (Form 8-K Ex. 99.1, Oct 21, 2026) · Philip Morris International Inc. (SEC EDGAR) · Tier 1: company or exchange filing · Oct 21, 2026
- S8Earnings release, Q4 FY2025 and full year 2025 (Form 8-K Ex. 99.1, Feb 6, 2026) · Philip Morris International Inc. (SEC EDGAR) · Tier 1: company or exchange filing · Feb 6, 2026
- S9Select financial information, Q4 FY2025 (Form 8-K Ex. 99.2, Feb 6, 2026) · Philip Morris International Inc. (SEC EDGAR) · Tier 1: company or exchange filing · Feb 6, 2026
- S10Form 8-K Ex. 99.1: recast 2025 vs 2024 results under the new segments (Mar 13, 2026) · Philip Morris International Inc. (SEC EDGAR) · Tier 1: company or exchange filing · Mar 13, 2026
- S11Definitive proxy statement (DEF 14A), 2026 annual meeting · Philip Morris International Inc. (SEC EDGAR) · Tier 1: company or exchange filing · Mar 26, 2026
- S12Schedule 13G, Vanguard Capital Management (event Mar 31, 2026) · Vanguard Capital Management (SEC EDGAR) · Tier 1: company or exchange filing · Apr 30, 2026
- S13Schedule 13G, Capital Research Global Investors (event Mar 31, 2026) · Capital Research Global Investors (SEC EDGAR) · Tier 1: company or exchange filing · May 14, 2026
- S14Schedule 13G/A, Capital International Investors (event Mar 31, 2026) · Capital International Investors (SEC EDGAR) · Tier 1: company or exchange filing · May 14, 2026
- S15Schedule 13G/A, The Vanguard Group (event Mar 13, 2026) · The Vanguard Group (SEC EDGAR) · Tier 1: company or exchange filing · Mar 27, 2026
- S17CAGNY 2026 presentation slides (Form 8-K exhibit, Feb 18, 2026) · Philip Morris International Inc. (SEC EDGAR) · Tier 1: company or exchange filing · Feb 18, 2026
- S18PM historical closing prices, Nasdaq's table for an NYSE-listed share (close of Nov 5, 2026: $201.50) · Nasdaq · Tier 1: company or exchange filing · Nov 5, 2026
- S19XBRL company facts, Philip Morris International (CIK 0001413329) · SEC EDGAR (data.sec.gov) · Tier 1: company or exchange filing · Nov 6, 2026
- S20XBRL company facts, Altria Group (CIK 0000764180), FY2025 10-K values · SEC EDGAR (data.sec.gov) · Tier 1: company or exchange filing · Nov 6, 2026
Changes to this page (v1 · Nov 6, 2026)
- v1 · Nov 6, 2026First version, through Q3 FY2026 (quarter ended Sep 30, 2026). (first version)
Numbers come only from tier 1 and tier 2 sources. Read how we research.
Disclaimer
For learning only. Cityfort is not a registered investment adviser or broker-dealer and does not recommend buying or selling any security. Prices shown are dated and may be out of date.
Investing in securities involves risk, including loss of capital. Before making any investment decision, do your own research and consider consulting a registered investment adviser or other qualified professional.
Cityfort, its owners and contributors may or may not hold securities of companies covered. Cityfort is not paid by any company it covers. Content is not an offer or solicitation to buy or sell any security, including in any initial public offering.
Read the positions policyRead the full disclaimerHide the full disclaimer
Cityfort publishes general educational content that explains how listed companies work. Cityfort is not registered with the US Securities and Exchange Commission or any state securities regulator as an investment adviser, and is not a broker-dealer or a member of FINRA. Cityfort does not provide investment, tax or legal advice, recommendations, ratings, price targets or any opinion on whether to buy, sell or hold any security. Nothing on the site is tailored to any person's circumstances.
All information is taken from publicly available sources, mainly company filings with the SEC, which are listed on each page with dates. We work to keep it accurate and correct errors publicly, but we do not guarantee that it is complete, accurate or up to date. Any market price or price-based ratio shown is dated, may be out of date by the time you read it, and is included only to explain concepts.
Statements by company management, including forward-looking statements and guidance, are reported as the company's statements, with their date and source; they are not our forecasts. Adjusted (non-GAAP) figures are the company's own measures and are shown next to the official (GAAP) figures.