Consumer Staples · NASDAQ: MDLZ
Mondelez: how the business works
Mondelez makes snacks such as Oreo biscuits and Cadbury chocolate and sells them in over 150 countries, with $38.5 billion of net revenues in FY2025.
By Hardik Bhandare · Checked against filings: . Editorial policy. Corrections
Follow Mondelez
Email me when Mondelez's page is updated after earnings.
We'll send a confirmation email first. See our privacy policy.
Mondelēz International, Inc. · Chicago, Illinois · Founded 2000
Updated for Q3 FY2026 · checked
- Net revenues, FY2025
- $38.5B
- Operating income, FY2025
- $3.5B
- Net income, FY2025
- $2.5B
- Employees, Dec 31, 2025
- About 91,000
- Net revenues from outside the US, FY2025
- 75.8%
The short version
Mondelez in 5 points
1 · What it sells
Mondelez sells biscuits such as Oreo and chocolate such as Cadbury Dairy Milk and Milka, which were 47.7% and 32.9% of FY2025 net revenues of $38.5 billion.
2 · Who pays it
No single customer pays a tenth of net revenues; by region, stores and distributors in Europe paid 39.0% in FY2025, North America 27.7%, AMEA 20.6% and Latin America 12.7%.
3 · What it keeps from $100
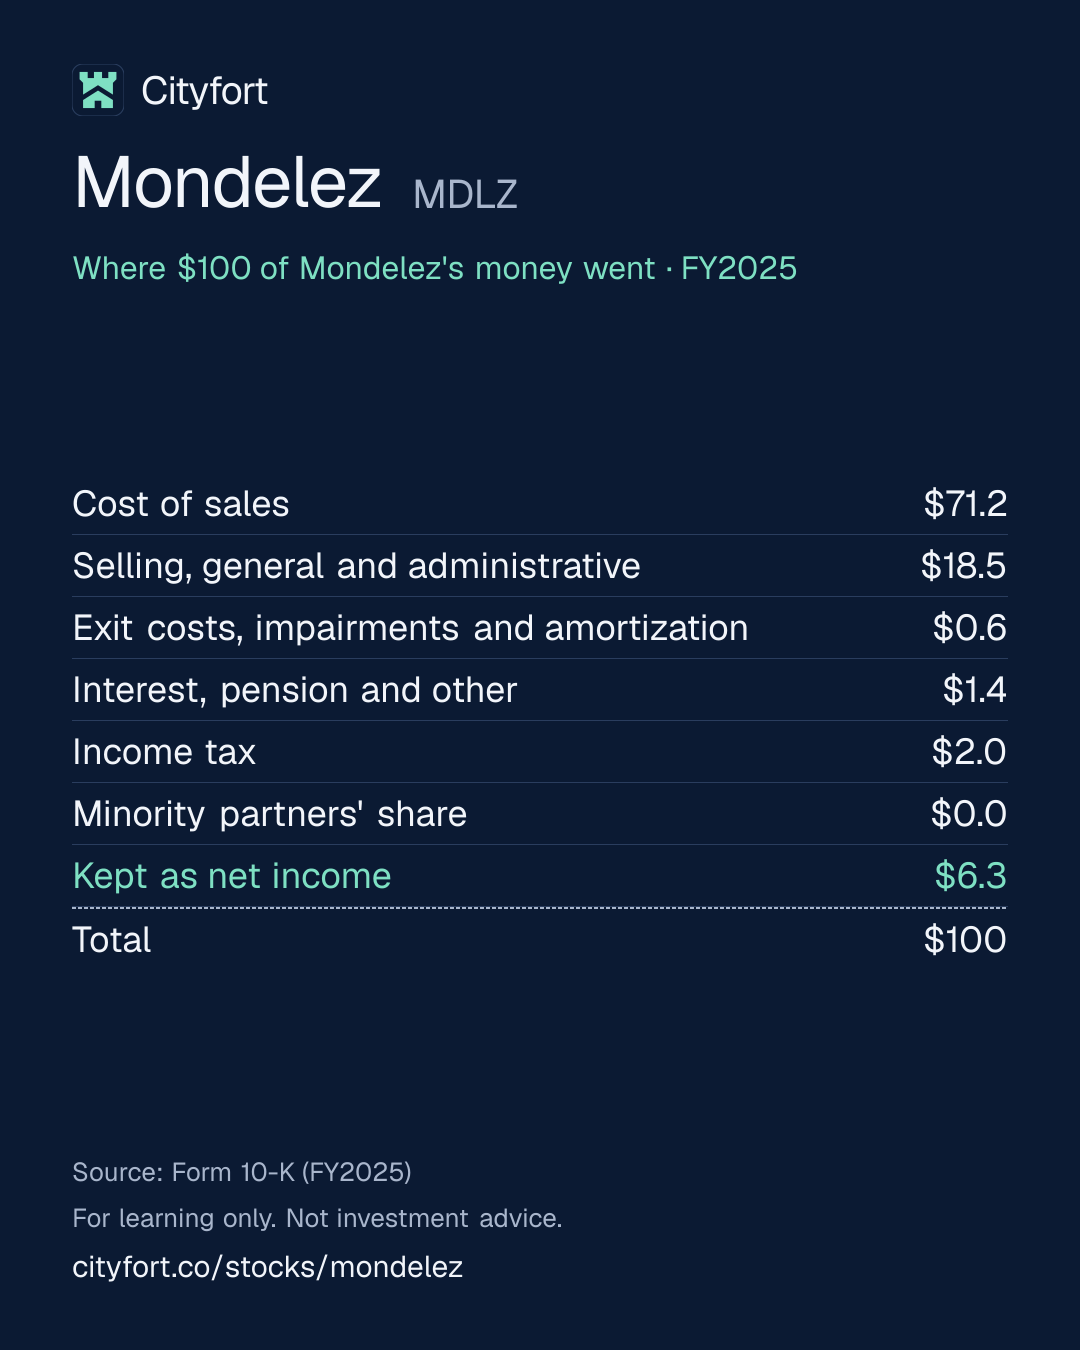
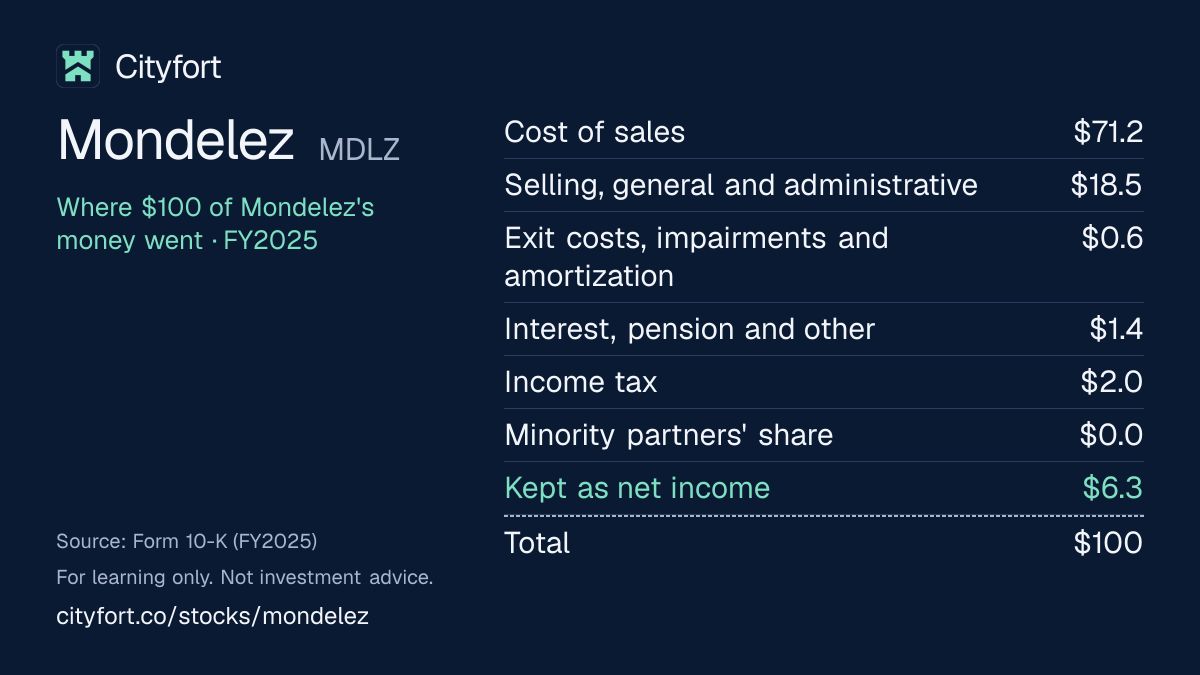
Of every $100 that came in during FY2025, Mondelez kept $6.32 as net income, after a $1,341 million paper loss on cocoa and other hedges cut operating income to $3,548 million and a $169 million one-off payment added to it.
4 · Where the operating profit comes from
North America earned 36.1% of FY2025 segment operating income on 27.7% of net revenues, and Europe 34.5% on 39.0%.
5 · The one thing to watch
Gross margin was 39.4% in Q3 FY2026, against 26.8% a year earlier, and $543 million of hedge gains were part of that quarter's $1,758 million operating income.
Sources: From Mondelez's FY2025 10-K, Q3 FY2026 10-Q and Q3 FY2026 earnings release · checked
See the full receipt and the management scorecard below
01Where the money goes · FY2025
Where does $100 of Mondelez's money go?
Mondelez · FY2025
Receipt for every $100
| Cost of sales | $71.2 |
|---|---|
| Selling, general and administrative | $18.5 |
| Exit costs, impairments and amortization | $0.6 |
| Interest, pension and other | $1.4 |
| Income tax | $2.0 |
| Minority partners' share | $0.0 |
| Kept as net income | $6.3 |
| Total | $100 |
Each line = amount ÷ total money in × 100. Lines may not add to exactly $100 because of rounding.
How this is worked out
Cityfort calculation from the FY2025 10-K. Of every $100 that came in during FY2025: each line = line ÷ $38.8 billion of money in ($38.5 billion of net revenues plus $234 million of equity-method investment earnings and gains) × 100.
Save this receipt as an image:
1080 × 1350 PNG for Instagram, LinkedIn1200 × 675 PNG for X
Embed this receipt
Paste this code into a blog or website to show the receipt, with a link back to this page:
Each week: one company explained in 5 points, picked by earnings date.
Free, no tips, unsubscribe anytime.
We'll send a confirmation email. See our privacy policy.
02The business in one line
What does Mondelez do?
Stores and distributors in over 150 countries pay Mondelez for its biscuits and chocolate; most of the money goes on ingredients and making the snacks, and $6.32 of every $100 was left as net income in FY2025.
- In FY2025, biscuits and baked snacks were 47.7% of net revenues and chocolate 32.9%. Sales outside the US made up 75.8%.
- Of every $100 that came in during FY2025, cost of sales took $71.19. That included a $1,341 million paper loss on cocoa and other hedges.
03Who pays it
Who pays Mondelez?
Stores and distributors in Europe
39%
of revenue
Europe was 39.0% of FY2025 net revenues ($15.0 billion), the largest region. Chocolate was more than half of it.
Stores and distributors in North America
28%
of revenue
27.7% of FY2025 net revenues ($10.7 billion), mostly biscuits and baked snacks.
Stores and distributors in Asia, Middle East and Africa (AMEA)
21%
of revenue
20.6% of FY2025 net revenues ($7.9 billion).
Stores and distributors in Latin America
13%
of revenue
12.7% of FY2025 net revenues ($4.9 billion).
- Stores and distributors in Europe39%
- Stores and distributors in North America28%
- Stores and distributors in Asia, Middle East and Africa (AMEA)21%
- Stores and distributors in Latin America13%
How spread out the customers are
No single customer accounted for 10% or more of FY2025 net revenues. Buyers range from supermarket chains and club stores to gas stations and online sellers. Mondelez gives no top-5 or top-10 customer share.
04Why it makes money
Why does Mondelez make money?
Mondelez earns money when the prices it charges for snacks stay ahead of what it pays for cocoa, wheat, sugar and dairy.
In FY2025, cost of sales rose 24.4% to $27.6 billion as cocoa and other costs rose. Mondelez raised prices, but buyers took fewer or cheaper snacks, and segment operating income fell 16.0% to $5,278 million.
Segment operating income per $100 of net revenues (before hedge gains or losses and corporate costs)
$16.6$13.7
FY2021 to FY2025
- Brands such as Oreo, Cadbury Dairy Milk and Milka
- Stores in over 150 countries stock them; no customer pays 10% or more
- Mondelez buys cocoa, wheat, dairy and sugar and hedges their prices
- When costs rise it raises prices: pricing added 8.0 points to FY2025 organic growth
- Higher prices can cut volume: volume and mix took 3.7 points off in FY2025
- Cash pays dividends and buybacks: $4.9 billion in FY2025
↺ Step 6 feeds back into step 1.
05Business segments · FY2025
Which businesses make up Mondelez?
Europe
39%Chocolate, biscuits and other snacks across Europe. 34.5% of FY2025 segment operating income, a 12.1% margin. Shares here are of total segment operating income of $5,278 million, before hedge results, corporate costs and amortization.
Revenue $15.0B · Operating profit $1.8B
North America
28%Mainly biscuits and baked snacks in the US and Canada. 36.1% of segment operating income, a 17.8% margin, the highest of the four regions.
Revenue $10.7B · Operating profit $1.9B
Asia, Middle East and Africa (AMEA)
21%Snacks in markets across Asia, the Middle East and Africa. 18.7% of segment operating income, a 12.4% margin.
Revenue $7.9B · Operating profit $985M
Latin America
13%Snacks in Latin America. 10.8% of segment operating income, an 11.6% margin.
Revenue $4.9B · Operating profit $569M
How the mix changed
- Europe
- North America
- Asia, Middle East and Africa (AMEA)
- Latin America
Revenue by segment, FY2021 to FY2025.
US$
See the numbers
06The numbers · Consolidated · US$
How has Mondelez done?
Revenue
$38.5BFY2025
Net revenues rose every year, from $28.7 billion in FY2021 to $38.5 billion in FY2025, and were $9,967 million in Q3 FY2026, up 2.3% from a year earlier.
US$
See the numbers
Net profit
$2.5BFY2025
Net income swings with hedge gains and losses and one-off items: it was $4.6 billion in FY2024, $2.5 billion in FY2025 after a $1,341 million hedge loss, and $1,305 million in Q3 FY2026.
US$
See the numbers
Profit kept per $100 of revenue
$6.4FY2025
Net margin fell from 15.0% in FY2021 to 6.4% in FY2025, as gross margin dropped to 28.4% from 39.1% in FY2024 on higher cocoa and other costs and hedge losses.
$ of profit per $100 of revenue (net margin)
See the numbers
Free cash flow
$3.2BFY2025
Cash from operations minus capital spending stayed between $3.0 billion and $3.6 billion a year from FY2021 to FY2025, while net income moved between $2.5 billion and $5.0 billion.
US$ · cash from operations minus spending on plants and equipment
See the numbers
See all yearly numbers
EBITDA here = operating income plus depreciation and amortization (from the cash flow statement). Fiscal years are the company's own (Calendar year; FY2025 ended Dec 31, 2025. Quarters end Mar 31, Jun 30, Sep 30 and Dec 31.). Net profit is the share belonging to the company's owners.
Download Mondelez's yearly and quarterly numbers (CSV, with source ids)
Learn: Fiscal years that don't end in December: Nvidia's FY2027 explained · Stock-based compensation and dilution: pay that becomes shares
Sources (10)
- Form 10-K, fiscal year 2023 (ended Dec 31, 2023)
- Form 10-K, fiscal year 2025 (ended Dec 31, 2025)
- Q4 and FY 2024 earnings release (8-K Exhibit 99.1, Feb 4, 2025)
- Q1 2025 earnings release (8-K Exhibit 99.1, Apr 29, 2025)
- Q2 2025 earnings release (8-K Exhibit 99.1, Jul 29, 2025)
- Q3 2025 earnings release (8-K Exhibit 99.1, Oct 28, 2025)
- Q4 and FY 2025 earnings release (8-K Exhibit 99.1, Feb 3, 2026)
- Q1 2026 earnings release (8-K Exhibit 99.1, Apr 28, 2026)
- Q2 2026 earnings release (8-K Exhibit 99.1, Jul 28, 2026)
- Q3 2026 earnings release (8-K Exhibit 99.1, Oct 29, 2026)
07Who runs it
Who runs Mondelez, and did they deliver?
Dirk Van de Put
Chairman and Chief Executive Officer · since 2017
CEO and director since November 2017, Chairman since April 2018; previously CEO of McCain Foods. 2025 total pay was $24.5 million, against $22.3 million in 2024.
Luca Zaramella
Executive Vice President and Chief Operating Officer · since 2026
COO from Feb 1, 2026; he had been CFO since 2018 and kept that role until Jul 1, 2026. 2025 total pay was $9.7 million.
Amit Banati
Executive Vice President and Chief Financial Officer · since 2026
CFO from Jul 1, 2026; previously CFO of Kenvue and Kellanova.
What they said, and what happened
2 missed · 1 delivered · 3 too early to tell
Said on Feb 4, 2025
Mondelez said it expected 2025 Organic Net Revenue growth of about 5%.
MissedWhat happened
On Oct 28, 2025 it changed this to 4%+. Organic growth was 4.3% for FY2025, and reported net revenues rose 5.8%.
Said on Feb 4, 2025
Mondelez said it expected 2025 Adjusted EPS to decline about 10% at constant currency, citing "unprecedented cocoa cost inflation".
MissedWhat happened
On Oct 28, 2025 it changed this to a decline of about 15%. Adjusted EPS fell 14.6% at constant currency to $2.92; GAAP diluted EPS fell to $1.89 from $3.42.
Said on Feb 4, 2025
Mondelez said it expected 2025 Free Cash FlowCash from operations minus spending on buildings and equipment. Learn more of $3 billion or more.
DeliveredWhat happened
Free cash flow (cash from operations minus capital spending) was $3,235 million in FY2025.
Said on Feb 3, 2026
Mondelez said it expected 2026 Organic Net Revenue growth of flat to 2%.
Too early to tellWhat happened
On Jul 28, 2026 it changed this to at least 2%. Organic growth was 2.4% in the first nine months, and reported net revenues rose 4.9%.
Said on Feb 3, 2026
Mondelez said it expected 2026 Adjusted EPS growth of flat to +5% at constant currency.
Too early to tellWhat happened
Adjusted EPS was $2.18 in the first nine months, down 4.1% at constant currency; GAAP diluted EPS was $2.66, up 94.2%.
Said on Feb 3, 2026
Mondelez said it expected about $3 billion of Free Cash Flow in 2026.
Too early to tellWhat happened
Free cash flow was $1,659 million in the first nine months, against $1,236 million a year earlier.
Sources (9)
- Form 10-K, fiscal year 2025 (ended Dec 31, 2025)
- 2026 proxy statement (DEF 14A)
- 8-K (Item 5.02) Exhibit 99.1: Luca Zaramella named EVP, COO and CFO
- 8-K (Item 5.02) Exhibit 99.1: Amit Banati named EVP and CFO
- Q4 and FY 2024 earnings release (8-K Exhibit 99.1, Feb 4, 2025)
- Q3 2025 earnings release (8-K Exhibit 99.1, Oct 28, 2025)
- Q4 and FY 2025 earnings release (8-K Exhibit 99.1, Feb 3, 2026)
- Q2 2026 earnings release (8-K Exhibit 99.1, Jul 28, 2026)
- Q3 2026 earnings release (8-K Exhibit 99.1, Oct 29, 2026)
08What could go wrong
What could go wrong for Mondelez?
- Raw-material prices
Cocoa and other input costs
The 10-K names cocoa among volatile input costs. In FY2025 cost of sales rose 24.4% to $27.6 billion and segment operating income fell 16.0%, though prices rose.
Watch Gross margin each quarter (39.4% in Q3 FY2026, 26.8% a year earlier).
- Other
Hedge gains and losses swing reported profit
Unrealized gains and losses on cocoa, other commodity and currency hedges run through cost of sales. They took $1,341 million off FY2025 operating income and added $827 million in Q2 FY2026 and $543 million in Q3 FY2026.
Watch The unrealized hedging line in each earnings release's segment schedule.
- Debt
Debt and short-term borrowing
Debt exceeded cash by $20.1 billion at Sep 30, 2026, up from $16.0 billion at Dec 31, 2021. Mondelez relies on commercial paper, and the 10-K lists a credit-rating downgrade as a risk.
Watch Net debt in each 10-Q and the ratings stated in new note term sheets.
- Pricing
Europe's prices and demand
Europe is 39.0% of net revenues. In Q3 FY2026 its net revenues fell 3.3%, with pricing taking 3.7 points off organic growth.
Watch Europe's revenue and pricing in each earnings release.
- Currency
Currencies, emerging markets and conflict
75.8% of FY2025 net revenues came from outside the US. Argentina, Türkiye, Egypt and Nigeria use high-inflation accounting, and Middle East countries hit by conflict were about 1.0% of Q3 FY2026 net revenue, with a Bahrain plant affected.
Watch Currency effects and Middle East notes in each 10-Q.
- Execution
Brand write-downs
Goodwill and intangible assets were $44.0 billion at FY2025 end, 61.5% of total assets. Q3 FY2026 included $64 million of impairments on two European and one North American biscuit brands.
Watch Intangible asset impairment charges in each 10-Q and 10-K.
- Legal
Wheat-futures class action
Investors allege that a Mondelez unit manipulated wheat futures in 2011. After the class was decertified on Sep 30, 2026, three plaintiffs' antitrust and unjust-enrichment claims remain, and the plaintiffs sought appellate review. Mondelez expects to bear any payments under its 2012 separation agreement with Kraft Foods Group.
Watch Legal proceedings in each 10-Q and 10-K.
Sources (5)
- Form 10-K, fiscal year 2025 (ended Dec 31, 2025)
- Q3 2026 earnings release (8-K Exhibit 99.1, Oct 29, 2026)
- Q2 2026 earnings release (8-K Exhibit 99.1, Jul 28, 2026)
- Form 10-Q, Q3 fiscal 2026 (quarter ended Sep 30, 2026)
- XBRL company facts (FY2021 balance sheet from the FY2021 10-K, accession 0001103982-22-000003)
09Both sides
What do supporters and critics point to?
What supporters point to
- Net revenues rose every year, from $28.7 billion in FY2021 to $38.5 billion in FY2025.
- Free cash flow was $3.0 billion or more in each year from FY2021 to FY2025.
- Dividends declared rose every year, from $1.33 per share in FY2021 to $1.94 in FY2025, and a 4% increase was announced in July 2026.
- No customer pays 10% or more of net revenues, and Mondelez sells in over 150 countries.
- Q3 FY2026 gross margin was 39.4%, against 26.8% a year earlier, and diluted EPS was $1.02, against $0.57.
What critics point to
- Diluted EPS was $1.89 in FY2025, against $3.42 in FY2024 and $3.04 in FY2021.
- FY2025 revenue growth came from price: pricing added 8.0 points to organic growth and volume and mix took off 3.7, in the company's breakdown.
- Dividends paid took 76.9% of FY2025 free cash flow, against 57.5% in FY2021; dividends plus buybacks were $4.9 billion.
- Net debt rose from $16.0 billion at Dec 31, 2021 to $20.1 billion at Sep 30, 2026.
- Europe's Q3 FY2026 net revenues fell 3.3%, with pricing taking 3.7 points off organic growth.
10What to watch next
What should you watch next at Mondelez?
Next event
Q4 FY2026 results
Date not announced yet.
Cocoa costs and hedges
Gross margin was 39.4% in Q3 FY2026, against 26.8% a year earlier, and $543 million of hedge gains were in its $1,758 million operating income. The hedge line can swing either way.
The year against the outlook
On Oct 29, 2026 Mondelez said it expects at least 2% organic growth and Adjusted EPS of flat to +5% at constant currency for 2026. In the first nine months they were +2.4% and −4.1%.
Volume and Europe
Volume and mix added 1.8 points to Q3 FY2026 organic growth after falling through 2025. Europe's net revenues fell 3.3% in the quarter.
11Key dates
What are the key dates for Mondelez?
| Event | Date | Source |
|---|---|---|
| Undercover Snacks acquisition expected to closeMondelez agreed on Oct 29, 2026 to buy a majority stake; it expects the deal to close in the first quarter of 2027. | Not yet stated | Form 10-Q, Q3 fiscal 2026 (quarter ended Sep 30, 2026) |
| 364-day revolving credit facility endsThe $1.5 billion facility signed on Feb 18, 2026 terminates on this date. | 8-K (Items 1.01, 1.02, 2.03): $1.5 billion 364-day revolving credit agreement |
12Key facts
Key facts about Mondelez
- What does Mondelez do?
- Mondelez International makes and sells snacks: biscuits and baked snacks such as Oreo, Ritz, LU and Clif Bar, and chocolate such as Cadbury Dairy Milk, Milka and Toblerone. Mondelez had net revenues of $38.5 billion in FY2025, the year ended Dec 31, 2025.
- How does Mondelez make money, and what is its business model?
- Mondelez makes money by selling snacks to supermarkets, wholesalers, distributors, convenience stores and other retailers in over 150 countries. In FY2025, Mondelez's net revenues were $38.5 billion, its operating income $3.5 billion and its net income $2.5 billion.
- Is Mondelez profitable?
- Yes. Mondelez's net income was $2,451 million in FY2025, down from $4,611 million in FY2024, after a $1,341 million loss on cocoa and other hedges. In Q3 FY2026, the quarter ended Sep 30, 2026, Mondelez's net income was $1,305 million.
- What is Mondelez's revenue by segment?
- Mondelez's FY2025 net revenues of $38.5 billion came from Europe ($15.0 billion, 39.0%), North America ($10.7 billion, 27.7%), Asia, Middle East and Africa ($7.9 billion, 20.6%) and Latin America ($4.9 billion, 12.7%). The United States alone was 24.2% of Mondelez's FY2025 net revenues.
- Who owns Mondelez?
- Mondelez has one class of common stock with one vote per share. Vanguard Capital Management reported 7.52% of Mondelez on Mar 31, 2026, and Mondelez's 2026 proxy lists BlackRock with 7.7% based on a February 2024 filing. Mondelez's directors and executive officers held under 1% on Mar 11, 2026.
- Who are Mondelez's customers?
- Mondelez sells to supermarket chains, wholesalers, supercenters, club stores, mass merchandisers, distributors, convenience stores, gas stations, drug stores and value stores, and also online. No single customer accounted for 10% or more of Mondelez's FY2025 net revenues.
- How much does Mondelez earn from biscuits?
- Biscuits and baked snacks such as Oreo, Ritz and LU brought Mondelez $18.4 billion in FY2025, 47.7% of net revenues. North America sold $9.3 billion of those biscuits and baked snacks.
- How much does Mondelez earn from chocolate?
- Chocolate such as Cadbury Dairy Milk, Milka and Toblerone brought Mondelez $12.7 billion in FY2025, 32.9% of net revenues, up from $9.3 billion in FY2021. Europe sold $7.8 billion of Mondelez's FY2025 chocolate.
- What else does Mondelez sell besides biscuits and chocolate?
- Besides biscuits and chocolate, Mondelez sells gum and candy ($4.1 billion, 10.5% of FY2025 net revenues), cheese and grocery ($2.4 billion, 6.2%) and powdered beverages ($1.0 billion, 2.6%).
- What dividend does Mondelez pay?
- Mondelez declared dividends of $1.94 per share for FY2025, up from $1.33 in FY2021. Mondelez paid $2,487 million of dividends in FY2025 and announced a 4% increase in its quarterly dividend on Jul 28, 2026.
Sources (6)
- Form 10-K, fiscal year 2025 (ended Dec 31, 2025)
- Q3 2026 earnings release (8-K Exhibit 99.1, Oct 29, 2026)
- 2026 proxy statement (DEF 14A)
- Schedule 13G, Vanguard Capital Management (as of Mar 31, 2026)
- Form 10-K, fiscal year 2023 (ended Dec 31, 2023)
- Q2 2026 earnings release (8-K Exhibit 99.1, Jul 28, 2026)
Terms on this page
- Capital expenditures (capex)
- Debt-to-equity
- Earnings per share (EPS)
- EBITDA
- Free cash flow
- Gross margin
- Market cap
- Net debt
- Net margin
- Operating income
Each explains the term in plain English, with the same number from other companies on Cityfort.
Go deeper
More detail from the same filings. Open any section.
13What it sells
13What it sells
What does Mondelez sell?
Biscuits and baked snacks ($18.4B in FY2025)
Cookies, crackers and baked snacks such as Oreo, Ritz, LU, Clif Bar and Tate's Bake Shop. 47.7% of FY2025 net revenues.
Chocolate ($12.7B)
Chocolate bars and treats such as Cadbury Dairy Milk, Milka and Toblerone. 32.9% of net revenues; Europe sold $7.8 billion of it.
Gum and candy ($4.1B)
Chewing gum and sweets. 10.5% of net revenues.
Cheese and grocery ($2.4B)
Cheese and other grocery items in some local markets. 6.2% of net revenues.
Powdered beverages ($1.0B)
Drink powders, a local business in some markets. 2.6% of net revenues.
What it does
- Does: Sells in over 150 countries and has operations in about 80
- Does: Runs 145 principal manufacturing and processing facilities in 49 countries
- Does: Earns most of its revenue outside the US: 75.8% in FY2025
- Does: Sells more in the last quarter of the year, around the holidays, and Easter timing moves sales between Q1 and Q2
What it does not do
- Does not: Does not report revenue by brand
- Does not: Has no customer that pays 10% or more of net revenues
- Does not: No longer sells gum in developed markets: it sold that business to Perfetti Van Melle in October 2023
- Does not: Does not own Kraft Foods Group, which it spun off in 2012
14How the money flows
14How the money flows · FY2025
How does money flow through Mondelez?
Money in
- Net revenues$38.5B
- Earnings and gains from equity-method investments$234M
The company
Mondelez
$38.8B came in
Money out
- Cost of sales (ingredients, packaging, making the snacks; includes a $1,341M hedge loss)$27.6B
- Selling, general and administrative costs (including advertising)$7.2B
- Exit costs, impairments and brand amortization, net of a small gain$214M
- Interest, pension and other costs$534M
- Income tax$782M
- Share of minority partners (noncontrolling interest)$15M
- Net income attributable to Mondelez$2.5B
- Customers paid Mondelez $38.5 billion of net revenues in FY2025.
- Making the snacks took $27.6 billion, including a $1,341 million paper loss on cocoa and other hedges.
- Selling, advertising and running the company took $7.2 billion, leaving $3,548 million of operating income.
- Interest, pension costs and income tax took $1.3 billion; a $169 million payment tied to JDE Peet's and other investment earnings added $234 million.
- After $15 million for minority partners, $2.5 billion was left as net income.
15What it needs to run
15What it needs to run
What does Mondelez need to run?
Cocoa and other ingredients
The main raw materials are cocoa, dairy, wheat, edible oils, sugar and nuts, plus packaging and energy. Mondelez uses derivatives (hedges) to manage their prices.
Plants
145 principal manufacturing and processing facilities in 49 countries. Property, plant and equipment was $10.7 billion at FY2025 end, and capital spending was $1.3 billion in FY2025.
People
About 91,000 employees at Dec 31, 2025, about 12,000 of them in the US. Labor unions or works councils represent about 22% of US and 56% of non-US employees.
Brands
Goodwill and intangible assets, mostly from buying brands, were $44.0 billion at FY2025 end: 61.5% of total assets.
16Where it sells
16Where it sells · FY2025
Where does Mondelez sell?
- United States24%
- All other countries76%
17Competitors and what protects it
17Competitors and what protects it
Who does Mondelez compete with?
PepsiCo
NASDAQ: PEP
In the stock-performance peer group of Mondelez's FY2025 10-K; a snack and drink maker.
Hershey
In the stock-performance peer group of Mondelez's FY2025 10-K.
Nestlé
In the stock-performance peer group of Mondelez's FY2025 10-K.
Kraft Heinz
NYSE: KHC
In the stock-performance peer group of Mondelez's FY2025 10-K.
General Mills
In the stock-performance peer group of Mondelez's FY2025 10-K, with Campbell's, Coca-Cola, Colgate-Palmolive, Danone, Procter & Gamble and Unilever.
What protects the business
Each strength is scored 1 (weak) to 5 (strong) for the business, with the reason. It is not a rating of the share.
- Reach4 of 5
Mondelez sells in over 150 countries from 145 principal plants in 49 countries, and no customer pays 10% or more of net revenues.
- Brands that can carry price rises3 of 5
In FY2025, pricing added 8.0 points to organic revenue growth while volume and mix took 3.7 points off, and net revenues still rose 5.8%.
- Emerging markets3 of 5
Emerging markets, as Mondelez defines them, were 39.9% of FY2025 net revenues and grew 8.5% as reported.
Weak spot
Cocoa and other input costs
Cost of sales rose 24.4% in FY2025 while net revenues rose 5.8%, and segment operating income fell 16.0%. Chocolate is 32.9% of net revenues.
18Where growth could come from
18Where growth could come from
Where could Mondelez's growth come from?
Mondelez said in its Q3 FY2026 earnings release (Oct 29, 2026) that it expects 2026 Organic Net Revenue growth of at least 2%, Adjusted EPS growth of flat to +5% at constant currency and about $3 billion of Free Cash Flow. These are the company's own measures, and the outlook leaves out any potential tariff changes on USMCA-compliant trade.
Emerging markets
WorkingOrganic growth 4.1% vs 0.8% in developed markets, Q3 FY2026
Emerging markets were 39.9% of FY2025 net revenues. Their Q3 FY2026 net revenues rose 4.9% as reported, against 0.5% for developed markets.
Status: Working, on track against what the company said.
Volume coming back after price rises
MixedVolume and mix +1.8 points, pricing +0.3 points, Q3 FY2026
Volume and mix took 4.6 points off organic growth in Q3 FY2025, when pricing added 8.0 points. Organic growth was 2.1% in Q3 FY2026.
Status: Mixed, partly on track.
Lower cocoa and raw material costs
WorkingGross margin 39.4% vs 26.8%, Q3 FY2026
Mondelez said Q3 FY2026 adjusted gross margin rose 3.8 points to 34.2%, driven primarily by lower raw material costs, lower manufacturing costs from productivity, favorable volume and mix, and higher net pricing. Hedge gains of $543 million also lifted GAAP results.
Status: Working, on track against what the company said.
Europe
BehindNet revenues −3.3%, pricing −3.7 points, Q3 FY2026
Europe was 39.0% of FY2025 net revenues. Its Q3 FY2026 segment operating income was $339 million, against $275 million a year earlier.
Status: Behind, behind the company's own plan.
Bolt-on acquisitions
NewUndercover Snacks deal expected to close in Q1 2027
Mondelez bought Evirth, a China cakes and pastries maker, for $255 million, net of cash acquired, in November 2024. On Oct 29, 2026 it agreed to buy a majority stake in Undercover Snacks, a US quinoa-crisp brand.
Status: New, recently announced.
Status compares progress with what the company itself said it would do: Working = on track against what the company said; Mixed = partly on track; Behind = behind the company's own plan; New = recently announced; Early = too early to judge.
19The company's own measures (non-GAAP)
19The company's own measures · FY2025 and Q3 FY2026
What do Mondelez's own measures show?
Official (GAAP): Diluted EPS, FY2025
$1.89
Company's own measure: Adjusted EPS, FY2025
$2.92
Mondelez's adjusted measure leaves out hedge (mark-to-market) gains and losses, restructuring, impairments, acquisition and divestiture items, ERP system costs, pension participation changes and gains or losses on equity-method investmentProfits or losses from companies it partly owns, counted in proportion to its stake. deals, among others.
Official (GAAP): Operating income, FY2025
$3.5B
Company's own measure: Adjusted operating income, FY2025
$5.1B
Leaves out the same kinds of items, including the $1,341 million hedge loss.
Official (GAAP): Reported net revenue growth, FY2025
5.8%
Company's own measure: Organic net revenue growth, FY2025
4.3%
Organic growth leaves out acquisitions, divestitures and currency moves, and since 2024 Argentina price rises above 26% a year. Pricing added 8.0 points and volume and mix took off 3.7.
Official (GAAP): Diluted EPS, Q3 FY2026
$1.02
Company's own measure: Adjusted EPS, Q3 FY2026
$0.78
Here the adjusted figure is lower than GAAP, mainly because it leaves out hedge gains: $543 million of them were in Q3 FY2026 operating income.
Official (GAAP): Reported net revenue growth, Q3 FY2026
2.3%
Company's own measure: Organic net revenue growth, Q3 FY2026
2.1%
Volume and mix added 1.8 points and pricing 0.3 points.
Official (GAAP): Gross margin, Q3 FY2026
39.4%
Company's own measure: Adjusted gross margin, Q3 FY2026
34.2%
Mondelez said the adjusted margin rose 3.8 points, mainly on lower raw material costs, productivity, volume and mix, and pricing.
These are the company's own measures, defined by the company. They are not comparable across companies, and they are not added together. Each sits beside the nearest official (GAAP) figure.
Learn: Non-GAAP measures: what a company's "adjusted" numbers leave out
20Financial strength and debt
20Financial strength · Sep 30, 2026
How much debt does Mondelez have?
- Total debt$21.7B
- Cash and investments$1.6B
- Net debt (debt minus cash)$20.1B
- Net worth (shareholders' money)$26.6B
- Debt to equity
- 0.82×
- $ of debt for every $1 of shareholders' money
- Debt is short-term borrowings plus long-term debt, $21.7 billion as stated in the Q3 FY2026 10-Q. Net debt is a Cityfort calculation from the Q3 FY2026 earnings release; the cash-flow multiple is a Cityfort calculation from the FY2025 10-K and the Q3 FY2025 and Q3 FY2026 earnings releases.
- Net debt was $19.1 billion at Dec 31, 2025, against $16.0 billion at Dec 31, 2021 (Cityfort calculation from the FY2025 10-K and the FY2021 10-K's XBRL data).
- Current liabilities exceeded current assets by $8.9 billion at Dec 31, 2025, with $10.1 billion owed to suppliers (accounts payable). Mondelez also borrows short term through commercial paper, an average of $2.3 billion a day in the first nine months of 2026.
- Goodwill and intangible assets were $44.0 billion at Dec 31, 2025, 61.5% of total assets.
- Mondelez's revolving credit agreement requires shareholders' equity of at least $25.0 billion, excluding accumulated other comprehensive income or losses. On Feb 18, 2026 it replaced its $1.5 billion 364-day revolving facility with a new one ending Feb 17, 2027.
- Operating lease liabilities are not counted as debt here.
Sources (6)
- Form 10-Q, Q3 fiscal 2026 (quarter ended Sep 30, 2026)
- Q3 2026 earnings release (8-K Exhibit 99.1, Oct 29, 2026)
- Form 10-K, fiscal year 2025 (ended Dec 31, 2025)
- Q3 2025 earnings release (8-K Exhibit 99.1, Oct 28, 2025)
- XBRL company facts (FY2021 balance sheet from the FY2021 10-K, accession 0001103982-22-000003)
- 8-K (Items 1.01, 1.02, 2.03): $1.5 billion 364-day revolving credit agreement
21Who owns it
21Who owns it · ownership as of Mar 11, 2026
Who owns Mondelez?
- Officers and directors (as a group), shares
- 0.4%
Share classes
Holders of 5% or more
From the company's proxy statement (DEF 14A), later Schedule 13G filings and the share counts on its latest annual or quarterly report. Each holder row shows the date of its own filing.
Insider trades · Form 4 data as of Nov 6, 2026
What did Mondelez's insiders report trading?
Mondelez's insiders made 29 Form 4A filing an insider must make within two business days of buying or selling the company's shares. Learn more filings in the 12 months to Nov 6, 2026.
They reported no purchases and 7 sales (395,214 shares) in the open market or privately (codes P and S).
5 of the 7 sales were on forms with the Rule 10b5-1 plan box checked.
The same filings report 49 other share transactions (A: 28, F: 13, M: 6, G: 2).
They also report 17 transactions in options, stock units or other derivatives.
Insiders are a company's officers, directors and owners of more than 10% of a class of its shares. Most changes in their holdings must be reported to the SEC on a Form 4 within two business days. Source: SEC Form 4 filings on EDGAR.
- P
- a purchase in the open market or privately
- S
- a sale in the open market or privately
- A
- a grant, award or other acquisition from the company under Rule 16b-3
- F
- shares withheld or handed over to pay an exercise price or tax when an award is received, exercised or vests
- M
- exercise or conversion of an option or other derivative, exempt under Rule 16b-3
- G
- a bona fide gift
Code meanings: General Instruction 8 of Form 4 (SEC).
The latest 25 of 56 transactions
Shares: A = acquired, D = disposed of. A price the filing gives only in a footnote shows as “See filing”. The 10b5-1 box is checked when at least one trade on the form was made under a Rule 10b5-1 plan. A Form 4/A replaces the form it amends. See all of Mondelez's Form 4 filings on EDGAR.
Learn: How to read a proxy statement (DEF 14A): Nvidia's 2026 proxy · Form 4 insider filings: who files, the codes and the footnotes · Rule 10b5-1 trading plans: how insiders pre-schedule their trades
Sources (6)
- Form 10-Q, Q3 fiscal 2026 (quarter ended Sep 30, 2026)
- 2026 proxy statement (DEF 14A)
- Schedule 13G/A, The Vanguard Group (event Mar 13, 2026; 0 shares after internal realignment)
- Schedule 13G, Vanguard Capital Management (as of Mar 31, 2026)
- Schedule 13G, Capital Research Global Investors (as of Mar 31, 2026)
- Schedule 13G/A, Capital International Investors (as of Mar 31, 2026)
22What it does with profit
22What it does with profit
What does Mondelez do with its profit?
Dividend per share
$1.94FY2025
Dividend paid for each share, by financial year.
$ per share
See the numbers
Buyback · Dec 31, 2021
FY2021: share repurchases of $2.1 billion.
$2.1B
Buyback · Dec 31, 2022
FY2022: share repurchases of $2.0 billion.
$2.0B
Buyback · Dec 31, 2023
FY2023: share repurchases of $1.5 billion.
$1.5B
Buyback · Dec 31, 2024
FY2024: share repurchases of $2.3 billion.
$2.3B
Buyback · Dec 31, 2025
FY2025: share repurchases of $2.4 billion.
$2.4B
Buyback · Sep 30, 2026
First nine months of FY2026: share repurchases of $845 million.
$845M
23Governance signals
23Governance signals
What do Mondelez's governance filings show?
- Auditor
- PricewaterhouseCoopers LLP, since 2001
- Auditor changes
- None in the period covered
- Audit qualifications
- None reported
- Related-party dealings
- The 2026 proxy reports one related person transaction: BlackRock, a holder of more than 5%, managed investment options in Mondelez retirement savings and pension plans and earned about $4.23 million in fees in 2025, paid from plan assets.
- Credit rating
- Moody's and S&P (anticipated ratings for new notes, as listed in Mondelez's May 1, 2025 pricing term sheet; the FY2025 10-K and Q3 FY2026 10-Q name no ratings) Baa1 (Moody's) / BBB (S&P) (Positive (Moody's); Stable (S&P), as of May 1, 2025), May 1, 2025
A credit rating describes the company's ability to repay debt. It is not a rating of the share.
Flags to know about
regulatory · Oct 14, 2026
Wheat-futures lawsuits
In 2015 the CFTC alleged that a Mondelez unit manipulated wheat markets in 2011; that case settled in May 2022 without an admission, with an immaterial impact. An investor class action on the same allegations continues: on Sep 30, 2026 the court decertified the class, and on Oct 14, 2026 the plaintiffs sought appellate review.
regulatory · Aug 31, 2024
European Commission cross-border trade case
The European Commission investigated alleged practices restricting cross-border trade in the European Economic Area. Mondelez reached a negotiated resolution in Q2 2024; it had accrued €337.5 million ($376 million) and paid in August 2024.
other
Finance leadership changes
Luca Zaramella, CFO since 2018, became Chief Operating Officer on Feb 1, 2026. Amit Banati became CFO on Jul 1, 2026.
other
CEO pay ratio
Dirk Van de Put's 2025 total pay of $24.5 million was 645 times the median employee's $38,024.
disclosure
What Mondelez does not report
The filings give revenue by region and by product category, but not by brand or by customer. Mondelez's Adjusted EPS figures have been recast between filings, so years are best compared within one filing.
Sources (7)
- 2026 proxy statement (DEF 14A)
- Free writing prospectus (pricing term sheet) for 2028, 2030 and 2035 notes, May 1, 2025 (states anticipated Moody's and S&P ratings)
- Form 10-K, fiscal year 2025 (ended Dec 31, 2025)
- Form 10-Q, Q3 fiscal 2026 (quarter ended Sep 30, 2026)
- 8-K (Item 5.02) Exhibit 99.1: Luca Zaramella named EVP, COO and CFO
- 8-K (Item 5.02) Exhibit 99.1: Amit Banati named EVP and CFO
- Q4 and FY 2024 earnings release (8-K Exhibit 99.1, Feb 4, 2025)
24What the market paid
24What the market paid · price as of Nov 5, 2026
What did the market pay for Mondelez on Nov 5, 2026?
Price as of Nov 5, 2026 (shown for education; prices change daily).
Price as of Nov 5, 2026: Mondelez closed at $66.82 on Nasdaq. Times 1,265.84 million shares (Oct 26, 2026), that is a market value of about $84.6 billion (Cityfort calculation from the Nov 5, 2026 Nasdaq closing price and the Q3 FY2026 10-Q cover). P/E is price ÷ earnings per share: 21.1 on diluted EPS of $3.17 for the four quarters to Q3 FY2026 (Cityfort calculation from the Q4 FY2025 to Q3 FY2026 earnings releases), or 35.4 on FY2025's $1.89. P/B is price ÷ book value per share: 3.18, on $26.6 billion of Mondelez shareholders' equity at Sep 30, 2026.
- Share price
- $66.82
- Market value (market cap)
- $84.6B
- P/E
- 21.1×
- P/B
- 3.2×
More price-based ratios · as of Nov 5, 2026
Each ratio divides a number from the company's filings by the market value or share price on Nov 5, 2026. Prices change daily, so these ratios do too.
Price to sales (P/S)
2.1×
$84.6B market value ÷ $39.9B revenue (four quarters to Sep 30, 2026) = 2.1×
Cityfort calculation from the Nov 5, 2026 closing price and the Q4 FY2025 to Q3 FY2026 earnings releases. Source: MDLZ historical daily prices, Nasdaq historical data (close of Nov 5, 2026: $66.82); Form 10-Q, Q3 fiscal 2026 (quarter ended Sep 30, 2026); Q3 2026 earnings release (8-K Exhibit 99.1, Oct 29, 2026) and 4 more
How price ratios workDividend yield
2.90%
$1.94 dividends per share (FY2025) ÷ $66.82 share price = 2.90%
Cityfort calculation from the FY2025 10-K and the Nov 5, 2026 closing price. Source: MDLZ historical daily prices, Nasdaq historical data (close of Nov 5, 2026: $66.82); Form 10-Q, Q3 fiscal 2026 (quarter ended Sep 30, 2026); Q3 2026 earnings release (8-K Exhibit 99.1, Oct 29, 2026) and 4 more
What dividend yield meansFree cash flow yield
3.8%
$3.2B free cash flow (FY2025) ÷ $84.6B market value = 3.8%
Cityfort calculation from the FY2025 10-K and the Nov 5, 2026 closing price. Source: MDLZ historical daily prices, Nasdaq historical data (close of Nov 5, 2026: $66.82); Form 10-Q, Q3 fiscal 2026 (quarter ended Sep 30, 2026); Q3 2026 earnings release (8-K Exhibit 99.1, Oct 29, 2026) and 4 more
What free cash flow means
Shares used for the market value: 1,265.84 million ($66.82 × 1,265.84 million shares ≈ $84.6B). Source: Form 10-Q, Q3 fiscal 2026 (quarter ended Sep 30, 2026); 2026 proxy statement (DEF 14A)
Source: MDLZ historical daily prices, Nasdaq historical data (close of Nov 5, 2026: $66.82); Form 10-Q, Q3 fiscal 2026 (quarter ended Sep 30, 2026); Q3 2026 earnings release (8-K Exhibit 99.1, Oct 29, 2026) and 4 more
Sources (8)
- MDLZ historical daily prices, Nasdaq historical data (close of Nov 5, 2026: $66.82)
- Form 10-Q, Q3 fiscal 2026 (quarter ended Sep 30, 2026)
- Q3 2026 earnings release (8-K Exhibit 99.1, Oct 29, 2026)
- Q2 2026 earnings release (8-K Exhibit 99.1, Jul 28, 2026)
- Q1 2026 earnings release (8-K Exhibit 99.1, Apr 28, 2026)
- Q4 and FY 2025 earnings release (8-K Exhibit 99.1, Feb 3, 2026)
- Form 10-K, fiscal year 2025 (ended Dec 31, 2025)
- 2026 proxy statement (DEF 14A)
25How it got here
25How it got here
How did Mondelez get here?
2000
Milestone
Incorporated as Kraft Foods Inc.
The company was incorporated in Virginia in 2000 and was named Kraft Foods Inc. until 2012.
2012
Business-model change
Kraft Foods Group spun off; renamed Mondelez
The company spun off Kraft Foods Group in 2012 and stopped using the name Kraft Foods Inc.
2022
Milestone
Bought Clif Bar, Chipita and Ricolino
Mondelez bought Clif Bar, Chipita and Ricolino. The Clif Bar deal includes possible later payments of up to $2.4 billion.
2023
Business-model change
Sold developed-market gum; exited Keurig Dr Pepper
On Oct 1, 2023 Mondelez sold its developed-market gum business to Perfetti Van Melle. It also sold its remaining Keurig Dr Pepper shares.
2024
Milestone
Exited JDE Peet's; bought Evirth
Mondelez sold its remaining 85.9 million JDE Peet's shares to JAB for €2.2 billion ($2.3 billion). In November 2024 it bought Evirth, a China cakes and pastries maker, for $255 million, net of cash acquired.
2025
Crisis
Cocoa costs squeeze profit
Mondelez cited "unprecedented cocoa cost inflation" for 2025. Cost of sales rose 24.4%, a $1,341 million hedge loss hit results, and diluted EPS fell to $1.89 from $3.42.
2026
Milestone
New CFO and COO; Undercover Snacks deal
Luca Zaramella became COO and Amit Banati CFO. On Oct 29, 2026 Mondelez agreed to buy a majority stake in Undercover Snacks.
Sources (7)
- Form 10-K, fiscal year 2025 (ended Dec 31, 2025)
- EDGAR submissions index, CIK 0001103982 (former name Kraft Foods Inc., filings list)
- Form 10-K, fiscal year 2023 (ended Dec 31, 2023)
- Q4 and FY 2024 earnings release (8-K Exhibit 99.1, Feb 4, 2025)
- 8-K (Item 5.02) Exhibit 99.1: Luca Zaramella named EVP, COO and CFO
- 8-K (Item 5.02) Exhibit 99.1: Amit Banati named EVP and CFO
- Form 10-Q, Q3 fiscal 2026 (quarter ended Sep 30, 2026)
26Sources and changes
Where every number on this page comes from
Sources (23 documents)
- S1Form 10-K, fiscal year 2025 (ended Dec 31, 2025) · Mondelēz International, Inc. (SEC EDGAR) · Tier 1: company or exchange filing · Feb 4, 2026
- S2Form 10-K, fiscal year 2023 (ended Dec 31, 2023) · Mondelēz International, Inc. (SEC EDGAR) · Tier 1: company or exchange filing · Feb 2, 2024
- S3Form 10-Q, Q3 fiscal 2026 (quarter ended Sep 30, 2026) · Mondelēz International, Inc. (SEC EDGAR) · Tier 1: company or exchange filing · Oct 29, 2026
- S4Q3 2026 earnings release (8-K Exhibit 99.1, Oct 29, 2026) · Mondelēz International, Inc. (SEC EDGAR) · Tier 1: company or exchange filing · Oct 29, 2026
- S5Q2 2026 earnings release (8-K Exhibit 99.1, Jul 28, 2026) · Mondelēz International, Inc. (SEC EDGAR) · Tier 1: company or exchange filing · Jul 28, 2026
- S6Q1 2026 earnings release (8-K Exhibit 99.1, Apr 28, 2026) · Mondelēz International, Inc. (SEC EDGAR) · Tier 1: company or exchange filing · Apr 28, 2026
- S7Q4 and FY 2025 earnings release (8-K Exhibit 99.1, Feb 3, 2026) · Mondelēz International, Inc. (SEC EDGAR) · Tier 1: company or exchange filing · Feb 3, 2026
- S8Q3 2025 earnings release (8-K Exhibit 99.1, Oct 28, 2025) · Mondelēz International, Inc. (SEC EDGAR) · Tier 1: company or exchange filing · Oct 28, 2025
- S9Q2 2025 earnings release (8-K Exhibit 99.1, Jul 29, 2025) · Mondelēz International, Inc. (SEC EDGAR) · Tier 1: company or exchange filing · Jul 29, 2025
- S10Q1 2025 earnings release (8-K Exhibit 99.1, Apr 29, 2025) · Mondelēz International, Inc. (SEC EDGAR) · Tier 1: company or exchange filing · Apr 29, 2025
- S11Q4 and FY 2024 earnings release (8-K Exhibit 99.1, Feb 4, 2025) · Mondelēz International, Inc. (SEC EDGAR) · Tier 1: company or exchange filing · Feb 4, 2025
- S122026 proxy statement (DEF 14A) · Mondelēz International, Inc. (SEC EDGAR) · Tier 1: company or exchange filing · Apr 3, 2026
- S13Schedule 13G, Vanguard Capital Management (as of Mar 31, 2026) · Vanguard Capital Management (SEC EDGAR) · Tier 1: company or exchange filing · Apr 30, 2026
- S14Schedule 13G, Capital Research Global Investors (as of Mar 31, 2026) · Capital Research Global Investors (SEC EDGAR) · Tier 1: company or exchange filing · May 14, 2026
- S15Schedule 13G/A, Capital International Investors (as of Mar 31, 2026) · Capital International Investors (SEC EDGAR) · Tier 1: company or exchange filing · May 14, 2026
- S16Schedule 13G/A, The Vanguard Group (event Mar 13, 2026; 0 shares after internal realignment) · The Vanguard Group (SEC EDGAR) · Tier 1: company or exchange filing · Mar 27, 2026
- S178-K (Item 5.02) Exhibit 99.1: Luca Zaramella named EVP, COO and CFO · Mondelēz International, Inc. (SEC EDGAR) · Tier 1: company or exchange filing · Jan 30, 2026
- S188-K (Item 5.02) Exhibit 99.1: Amit Banati named EVP and CFO · Mondelēz International, Inc. (SEC EDGAR) · Tier 1: company or exchange filing · Jun 18, 2026
- S19Free writing prospectus (pricing term sheet) for 2028, 2030 and 2035 notes, May 1, 2025 (states anticipated Moody's and S&P ratings) · Mondelēz International, Inc. (SEC EDGAR) · Tier 1: company or exchange filing · May 1, 2025
- S20MDLZ historical daily prices, Nasdaq historical data (close of Nov 5, 2026: $66.82) · Nasdaq, Inc. · Tier 1: company or exchange filing · Nov 5, 2026
- S21XBRL company facts (FY2021 balance sheet from the FY2021 10-K, accession 0001103982-22-000003) · Mondelēz International, Inc. (SEC EDGAR) · Tier 1: company or exchange filing · Feb 4, 2022
- S22EDGAR submissions index, CIK 0001103982 (former name Kraft Foods Inc., filings list) · SEC EDGAR · Tier 1: company or exchange filing · Nov 7, 2026
- S238-K (Items 1.01, 1.02, 2.03): $1.5 billion 364-day revolving credit agreement · Mondelēz International, Inc. (SEC EDGAR) · Tier 1: company or exchange filing · Feb 18, 2026
Changes to this page (v1 · Nov 6, 2026)
- v1 · Nov 6, 2026First version, through Q3 FY2026 (quarter ended Sep 30, 2026). (first version)
Numbers come only from tier 1 and tier 2 sources. Read how we research.
Disclaimer
For learning only. Cityfort is not a registered investment adviser or broker-dealer and does not recommend buying or selling any security. Prices shown are dated and may be out of date.
Investing in securities involves risk, including loss of capital. Before making any investment decision, do your own research and consider consulting a registered investment adviser or other qualified professional.
Cityfort, its owners and contributors may or may not hold securities of companies covered. Cityfort is not paid by any company it covers. Content is not an offer or solicitation to buy or sell any security, including in any initial public offering.
Read the positions policyRead the full disclaimerHide the full disclaimer
Cityfort publishes general educational content that explains how listed companies work. Cityfort is not registered with the US Securities and Exchange Commission or any state securities regulator as an investment adviser, and is not a broker-dealer or a member of FINRA. Cityfort does not provide investment, tax or legal advice, recommendations, ratings, price targets or any opinion on whether to buy, sell or hold any security. Nothing on the site is tailored to any person's circumstances.
All information is taken from publicly available sources, mainly company filings with the SEC, which are listed on each page with dates. We work to keep it accurate and correct errors publicly, but we do not guarantee that it is complete, accurate or up to date. Any market price or price-based ratio shown is dated, may be out of date by the time you read it, and is included only to explain concepts.
Statements by company management, including forward-looking statements and guidance, are reported as the company's statements, with their date and source; they are not our forecasts. Adjusted (non-GAAP) figures are the company's own measures and are shown next to the official (GAAP) figures.