Technology · NASDAQ: SMCI
Supermicro: how the business works
Super Micro Computer (Supermicro) designs and builds servers, storage systems and full racks for data centers, including AI systems, with net sales of $39.1 billion in FY2026.
By Hardik Bhandare · Checked against filings: . Editorial policy. Corrections
Follow Supermicro
Email me when Supermicro's page is updated after earnings.
We'll send a confirmation email first. See our privacy policy.
Super Micro Computer, Inc. · San Jose, California · Founded 1993
Updated for Q1 FY2027 · checked
- Net sales, FY2026
- $39.1B
- Net income to common stockholders, FY2026
- $2.2B
- Net sales, Q1 FY2027
- $19.9B
- Employees, Jun 30, 2026
- Over 7,000
- Charles Liang and Sara Liu's stake, Jul 31, 2026
- 12.2%
The short version
Supermicro in 5 points
1 · What it sells
Supermicro designs and builds servers, storage systems and complete racks for data centers, including AI systems built on NVIDIA, AMD and Intel chips, with net sales of $39.1 billion in FY2026.
2 · Who pays it
In FY2026 one unnamed customer paid 28.1% of net sales and Supermicro's other customers, over 1,000 in over 100 countries, paid 71.9%; it does not split revenue by customer type.
3 · What it keeps from $100
Of every $100 of FY2026 net sales Supermicro kept $7.09 as operating income, and of every $100 that came in, $5.6 was left as net income for common stockholders after $0.1 went to preferred stockholders.
4 · Where the operating profit comes from
Supermicro reports one business segment, so its FY2026 operating income of $2.77 billion came from selling servers, storage and racks, with services and software at $538.3 million of net sales.
5 · The one thing to watch
Inventories rose to $15.1 billion on Sep 30, 2026 from $4.7 billion on Jun 30, 2025, and cash from operations was negative $6.8 billion in FY2026.
Sources: From Supermicro's FY2026 10-K, Q1 FY2027 10-Q and Q1 FY2027 earnings release · checked
See the full receipt and the management scorecard below
01Where the money goes · FY2026
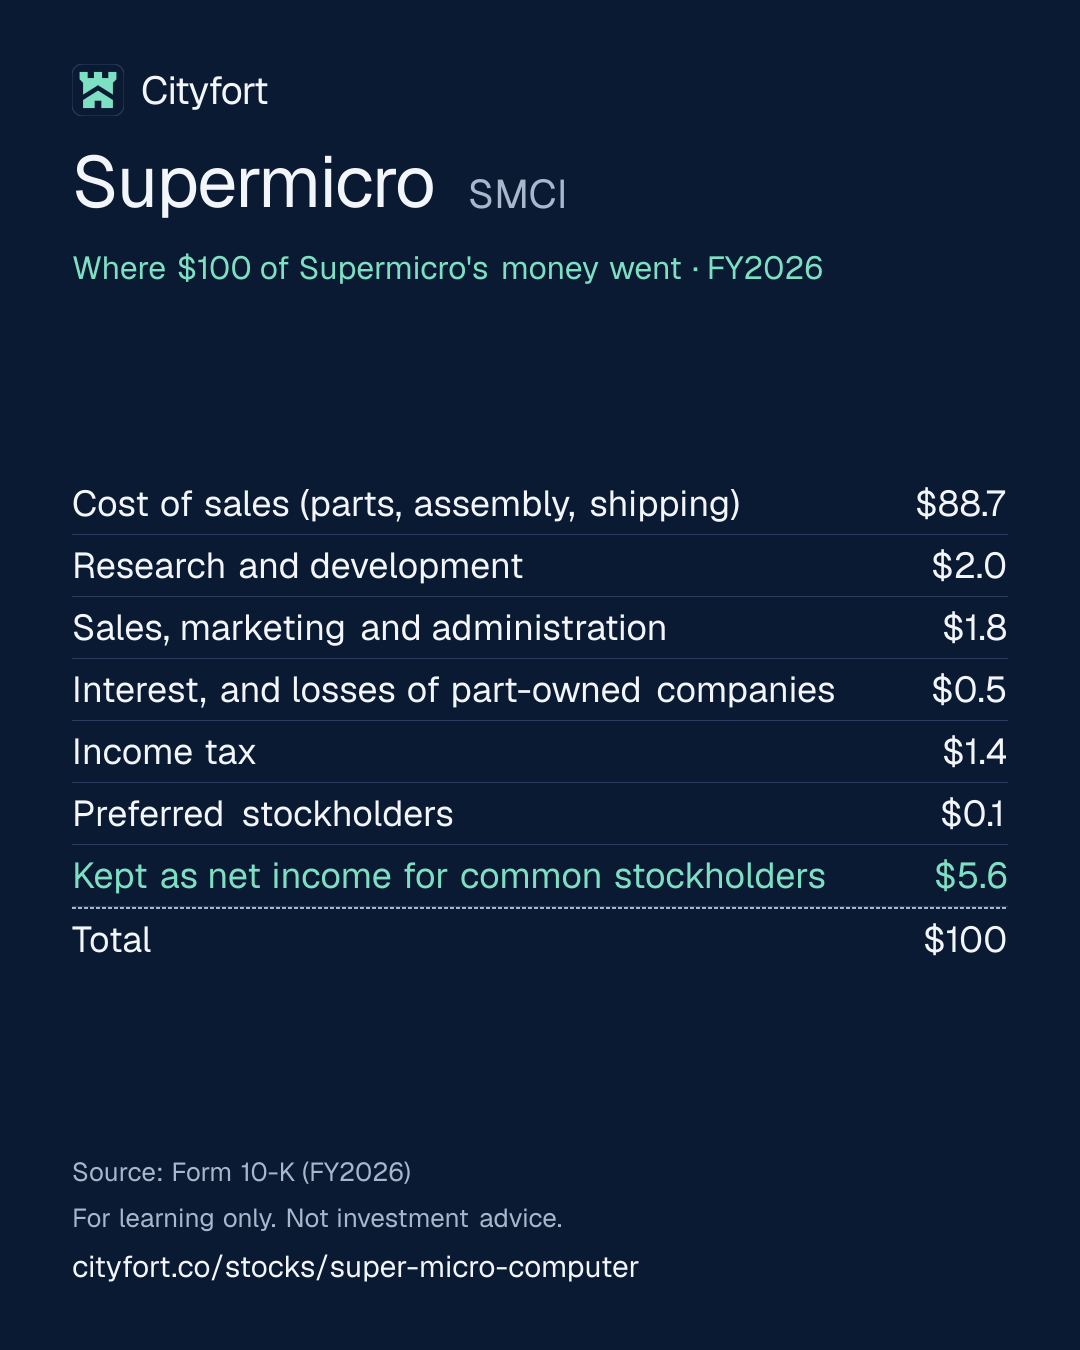
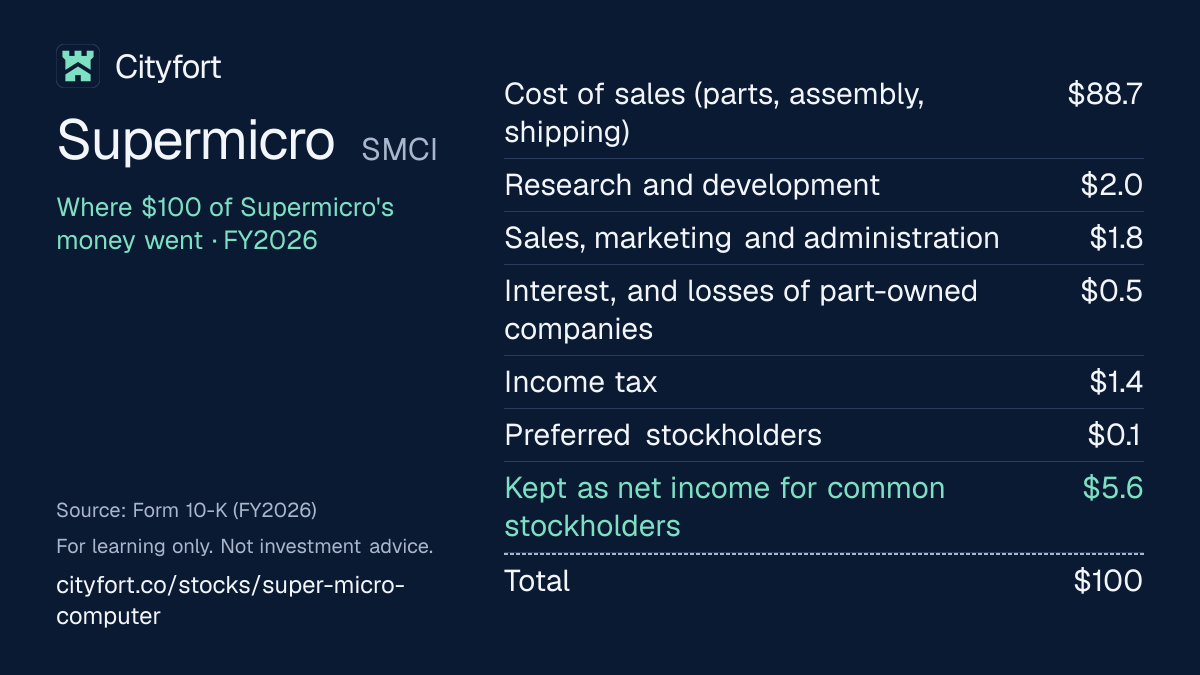
Where does $100 of Supermicro's money go?
Supermicro · FY2026
Receipt for every $100
| Cost of sales (parts, assembly, shipping) | $88.7 |
|---|---|
| Research and development | $2.0 |
| Sales, marketing and administration | $1.8 |
| Interest, and losses of part-owned companies | $0.5 |
| Income tax | $1.4 |
| Preferred stockholders | $0.1 |
| Kept as net income for common stockholders | $5.6 |
| Total | $100 |
Each line = amount ÷ total money in × 100. Lines may not add to exactly $100 because of rounding.
How this is worked out
Cityfort calculation from FY2026 10-K. Each line = line ÷ all money that came in ($39,063.1 million of net sales plus $213.3 million of interest and other income) × 100.
Save this receipt as an image:
1080 × 1350 PNG for Instagram, LinkedIn1200 × 675 PNG for X
Embed this receipt
Paste this code into a blog or website to show the receipt, with a link back to this page:
Each week: one company explained in 5 points, picked by earnings date.
Free, no tips, unsubscribe anytime.
We'll send a confirmation email. See our privacy policy.
02The business in one line
What does Supermicro do?
Data center, cloud and AI customers pay Supermicro for servers, storage and complete racks; $88.69 of every $100 that came in went on the cost of building them in FY2026, and $5.59 was left for common stockholders.
- One unnamed customer bought 28.1% of FY2026 net sales and 44.0% of Q1 FY2027 net sales.
- Net sales rose from $5.2 billion in FY2022 to $39.1 billion in FY2026, but cash from operations was negative $6.8 billion in FY2026 as money went into inventories and customer receivables.
03Who pays it
Who pays Supermicro?
Largest customer (not named)
28%
of revenue
One customer bought 28.1% of FY2026 net sales and 44.0% of Q1 FY2027 net sales. In FY2025 four customers each bought between 11.1% and 20.9%.
All other customers
72%
of revenue
Over 1,000 customers in over 100 countries, in enterprise data centers, cloud computing, AI, 5G and edge computing, plus thousands of end users reached through resellers. The 71.9% is a Cityfort calculation from FY2026 10-K: 100% less the largest customer's share.
- Largest customer (not named)28%
- All other customers72%
Customer concentration
One unnamed customer bought 28.1% of FY2026 net sales and 44.0% of Q1 FY2027 net sales; in Q1 FY2026 the two largest bought 17.3% and 11.6%. Supermicro does not name its customers or split revenue by customer type.
- Largest customer
- 28%
04Why it makes money
Why does Supermicro make money?
Supermicro earns a thin margin on a fast-growing volume of servers, so swings in gross margin move its profit.
Supermicro kept $10.82 of gross profit per $100 of net sales in FY2026, down from $15.40 in FY2022; the 10-K points to $237.7 million more tariff costs and $312.9 million less in supplier rebates in FY2026. Running costs took $3.73 per $100, so operating income per $100 rose from $6.45 to $7.09. Across the last eight quarters, gross margin moved between 6.3% and 17.5%.
Operating income per $100 of net sales
$6.5$7.1
FY2022 to FY2026
- Chip makers such as NVIDIA, AMD and Intel launch new processors
- Supermicro designs servers and racks around them from shared building blocks
- It builds and tests most systems in San Jose, Taiwan, the Netherlands and Malaysia
- Data center and cloud customers buy whole racks in large orders
- Larger volume spreads research, sales and administration costs thinner
- Cash and borrowing pay for the parts behind the next orders
↺ Step 6 feeds back into step 1.
05The numbers · Consolidated · US$
How has Supermicro done?
Revenue
$39.1BFY2026
Net sales rose every year, from $5.2 billion in FY2022 to $39.1 billion in FY2026, and were $19.9 billion in Q1 FY2027 alone.
US$
See the numbers
Net profit
$2.2BFY2026
Net income to common stockholders was $2.2 billion in FY2026 and $1.27 billion in Q1 FY2027, below total net income of $2.23 billion and $1.59 billion because part of the earnings goes to the preferred stock issued in June 2026.
US$
See the numbers
Profit kept per $100 of revenue
$5.6FY2026
Net income per $100 of net sales fell from $9.0 in FY2023 to $4.8 in FY2025, then rose to $5.6 in FY2026.
$ of profit per $100 of revenue (net margin)
See the numbers
Free cash flow
−$7.0BFY2026
Cash from operations minus equipment purchases was negative in FY2022, FY2024 and FY2026, reaching negative $7.0 billion in FY2026, when $8.9 billion of cash went into inventories.
US$ · cash from operations minus spending on plants and equipment
See the numbers
See all yearly numbers
EBITDA here = operating income plus depreciation and amortization (from the cash flow statement). Fiscal years are the company's own (June 30 (FY2026 ended Jun 30, 2026)). Net profit is the share belonging to the company's owners. Total net income differs from net profit to the company's owners: Net income to common stockholders is total net income less $13.1 million of dividends on the 7.00% mandatory convertible preferred stock issued in June 2026 and $21.5 million of earnings allocated to it. Diluted EPS also adds back interest on the convertible notes.
Download Supermicro's yearly and quarterly numbers (CSV, with source ids)
Learn: Fiscal years that don't end in December: Nvidia's FY2027 explained · Stock-based compensation and dilution: pay that becomes shares
Sources (10)
- Form 10-K, fiscal year 2024 (ended Jun 30, 2024; filed late)
- Form 10-K, fiscal year 2026 (ended Jun 30, 2026)
- Earnings release, Q2 fiscal 2026 (8-K Ex. 99.1, Feb 3, 2026)
- Form 10-Q, Q2 fiscal 2026 (quarter ended Dec 31, 2025)
- Earnings release, Q3 fiscal 2026 (8-K Ex. 99.1, May 5, 2026)
- Form 10-Q, Q3 fiscal 2026 (quarter ended Mar 31, 2026)
- Earnings release, Q4 and fiscal 2026 (8-K Ex. 99.1, Aug 11, 2026)
- Earnings release, Q1 fiscal 2027 (8-K Ex. 99.1, Nov 3, 2026)
- Form 10-Q, Q1 fiscal 2026 (quarter ended Sep 30, 2025)
- Form 10-Q, Q1 fiscal 2027 (quarter ended Sep 30, 2026)
06Who runs it
Who runs Supermicro, and did they deliver?
Charles Liang
President, Chief Executive Officer and Chairman · since 1993
Founded Supermicro in September 1993 and has led it since. His total pay was $1 in FY2026 and FY2025, and $28.1 million in FY2024, mostly a stock option award.
Sara Liu
Co-Founder, Senior Vice President and Director · since 1993
On the board since 1993 and married to Charles Liang. She adopted a Rule 10b5-1 trading planAn insider's trading plan, set up in advance, that buys or sells shares on a schedule. Learn more on May 26, 2026 to sell up to 300,000 shares.
Mark Long
Chief Financial Officer · since 2026
Appointed Oct 14, 2026, when David Weigand stopped serving as CFO. A board Special Committee had recommended recruiting a new CFO in December 2024.
What they said, and what happened
4 missed · 5 delivered · 2 too early to tell
Said on Feb 11, 2025
Supermicro said it expected FY2025 net sales of $23.5 billion to $25.0 billion, down from its earlier $26 billion to $30 billion.
MissedWhat happened
Reported FY2025 net sales of $21.97 billion.
Said on Feb 11, 2025
Supermicro said it expected Q3 FY2025 net sales of $5.0 billion to $6.0 billion.
MissedWhat happened
Reported Q3 FY2025 net sales of $4.60 billion.
Said on May 6, 2025
Supermicro said it expected FY2025 net sales of $21.8 billion to $22.6 billion.
DeliveredWhat happened
Reported FY2025 net sales of $21.97 billion.
Said on Aug 5, 2025
Supermicro said it expected Q1 FY2026 net sales of $6.0 billion to $7.0 billion.
MissedWhat happened
Reported Q1 FY2026 net sales of $5.02 billion.
Said on Aug 5, 2025
Supermicro said it expected FY2026 net sales of at least $33.0 billion.
DeliveredWhat happened
Reported FY2026 net sales of $39.06 billion.
Said on Nov 4, 2025
Supermicro said it expected Q2 FY2026 net sales of $10.0 billion to $11.0 billion.
DeliveredWhat happened
Reported Q2 FY2026 net sales of $12.68 billion.
Said on Feb 3, 2026
Supermicro said it expected Q3 FY2026 net sales of at least $12.3 billion and FY2026 net sales of at least $40.0 billion.
MissedWhat happened
Reported Q3 FY2026 net sales of $10.24 billion and FY2026 net sales of $39.06 billion.
Said on May 5, 2026
Supermicro said it expected Q4 FY2026 net sales of $11.0 billion to $12.5 billion.
DeliveredWhat happened
Reported Q4 FY2026 net sales of $11.12 billion, near the low end.
Said on Aug 11, 2026
Supermicro said it expected Q1 FY2027 net sales of $14.5 billion to $15.5 billion and GAAP diluted EPS of $0.89 to $0.98.
DeliveredWhat happened
Reported Q1 FY2027 net sales of $19.95 billion and diluted EPS of $1.75.
Said on Nov 3, 2026
Supermicro said it expects Q2 FY2027 net sales of $19.5 billion to $21.5 billion and GAAP diluted EPS of $1.59 to $1.83.
Too early to tellWhat happened
The quarter ends Dec 31, 2026; no results date announced yet.
Said on Nov 3, 2026
Supermicro said it expects FY2027 net sales of $72.0 billion to $82.0 billion.
Too early to tellWhat happened
Net sales in Q1 FY2027 were $19.95 billion.
Sources (11)
- Form 10-K, fiscal year 2026 (ended Jun 30, 2026)
- Form 8-K, Oct 15, 2026 (Item 5.02: Mark Long appointed CFO, David Weigand ceases)
- Form 8-K, Dec 2, 2024 (Items 5.02, 8.01: Special Committee findings; Chief Accounting Officer appointed)
- Business update, Q2 fiscal 2025 (8-K Ex. 99.1, Feb 11, 2025)
- Earnings release, Q3 fiscal 2025 (8-K Ex. 99.1, May 6, 2025)
- Earnings release, Q3 fiscal 2026 (8-K Ex. 99.1, May 5, 2026)
- Earnings release, Q4 and fiscal 2025 (8-K Ex. 99.1, Aug 5, 2025)
- Earnings release, Q1 fiscal 2026 (8-K Ex. 99.1, Nov 4, 2025)
- Earnings release, Q2 fiscal 2026 (8-K Ex. 99.1, Feb 3, 2026)
- Earnings release, Q4 and fiscal 2026 (8-K Ex. 99.1, Aug 11, 2026)
- Earnings release, Q1 fiscal 2027 (8-K Ex. 99.1, Nov 3, 2026)
07What could go wrong
What could go wrong for Supermicro?
- Concentration
One customer buys a large share
One unnamed customer bought 44.0% of Q1 FY2027 net sales and 28.1% of FY2026 net sales. Where large customers take delivery also swings the regional mix: the US was 36.6% of Q1 FY2026 net sales and 80.1% of Q1 FY2027.
Watch The largest customer's share in each 10-Q and 10-K.
- Cash and liquidity
Cash tied up in parts and unpaid bills
Inventories rose to $15.1 billion on Sep 30, 2026 from $4.7 billion on Jun 30, 2025, and customer receivables to $9.7 billion. Cash from operations was negative $6.8 billion in FY2026 and negative $434.0 million in Q1 FY2027.
Watch Inventories, receivables and cash from operations each quarter.
- Pricing
Thin, swinging margins
Gross margin was 6.3% in Q2 FY2026, 17.5% in Q4 FY2026 and 12.7% in Q1 FY2027. The FY2026 10-K points to higher tariff costs and lower supplier rebates.
Watch Gross margin each quarter against the company's outlook.
- Debt
More debt and more shares
Bank debt and convertible notes rose to $8.6 billion at Sep 30, 2026 from $4.8 billion a year earlier. The preferred stock converts into 130.7 million to 156.8 million common shares around Jun 1, 2029, against 659.2 million common shares on Oct 31, 2026.
Watch Debt in each 10-Q, any shares sold under the $1.25 billion at-the-market program, and the preferred conversion.
- Legal
Investigations and lawsuits
The company faces SEC and Justice Department subpoenas, Commerce Department export inquiries, securities class actions and derivative suits, some linked to the March 2026 indictment of three individuals over an alleged conspiracy to commit export-control violations. Supermicro says these could lead to penalties and gives no loss estimate.
Watch The legal proceedings note in each 10-Q and 10-K.
- Governance
Weak internal control
Internal control over financial reporting was not effective at Jun 30, 2026, and one material weakness was still unremediated at Sep 30, 2026. The company filed its FY2024 annual report about six months late, after its auditor resigned.
Watch Item 9A of the FY2027 10-K and Item 4 of each 10-Q.
- Execution
Reliance on a few chip suppliers
Supermicro builds around processors and GPUs from NVIDIA, AMD and Intel, and its 10-K says it relies on a limited number of suppliers for some components. Memory, storage, GPU and CPU supply was constrained in FY2026, affecting delivery timing and prices.
Watch Purchase commitments ($33.3 billion at Sep 30, 2026) and supply comments in each 10-Q.
Sources (9)
- Form 10-K, fiscal year 2026 (ended Jun 30, 2026)
- Form 10-Q, Q1 fiscal 2027 (quarter ended Sep 30, 2026)
- Earnings release, Q1 fiscal 2027 (8-K Ex. 99.1, Nov 3, 2026)
- Earnings release, Q4 and fiscal 2026 (8-K Ex. 99.1, Aug 11, 2026)
- Earnings release, Q2 fiscal 2026 (8-K Ex. 99.1, Feb 3, 2026)
- Form 10-Q, Q1 fiscal 2026 (quarter ended Sep 30, 2025)
- Form 8-K, Mar 20, 2026 (Item 5.02: export-control indictment of three individuals; director resignation)
- Form 10-K, fiscal year 2024 (ended Jun 30, 2024; filed late)
- Form 8-K, Oct 30, 2024 (Item 4.01: Ernst & Young resigns as auditor)
08Both sides
What do supporters and critics point to?
What supporters point to
- Net sales rose 297.5% to $19.95 billion in Q1 FY2027 from $5.02 billion a year earlier, above the $14.5 billion to $15.5 billion the company had guided.
- Remaining performance obligations rose to $5.67 billion at Sep 30, 2026 from $1.03 billion a year earlier.
- Operating income per $100 of net sales was $10.35 in Q1 FY2027, against $7.09 in FY2026.
- Supermicro had net income in each of the last five fiscal years, and its 10-K says it has been profitable every year since it began operating in 1993.
What critics point to
- One unnamed customer bought 44.0% of Q1 FY2027 net sales.
- Cash from operations was negative $6.8 billion in FY2026, and free cash flow was negative in three of the last five fiscal years.
- Gross margin fell from 15.4% in FY2022 to 10.8% in FY2026.
- Internal control over financial reporting was not effective at Jun 30, 2026, and the previous auditor resigned in 2024.
- Common shares rose from 523.1 million at Jun 30, 2022 (split-adjusted; Cityfort calculation from FY2023 10-K) to 659.2 million on Oct 31, 2026, and the preferred stock converts into up to 156.8 million more.
09What to watch next
What should you watch next at Supermicro?
Next event
Q2 FY2027 results
Date not announced yet.
Q2 FY2027 against the company's outlook
Supermicro said on Nov 3, 2026 that it expects net sales of $19.5 billion to $21.5 billion and GAAP diluted EPS of $1.59 to $1.83 for the quarter ending Dec 31, 2026.
The largest customer's share
One customer bought 44.0% of Q1 FY2027 net sales, up from 28.1% of FY2026.
Cash, inventories and the control weakness
Inventories were $15.1 billion at Sep 30, 2026 and cash from operations was negative $434.0 million in Q1 FY2027. One material weakness was still unremediated.
10Key dates
What are the key dates for Supermicro?
| Event | Date | Source |
|---|---|---|
| Preferred dividend payable$17.50 a preferred share ($0.875 a depositary share), for holders of record on Nov 15, 2026. | Form 8-K, Nov 3, 2026 (Items 2.02, 8.01: Q1 FY2027 results; preferred dividend) | |
| Annual meeting 2027 | Form 10-K, fiscal year 2026 (ended Jun 30, 2026) | |
| Fiscal 2027 endsSupermicro's fiscal year ends June 30. | Form 10-K, fiscal year 2026 (ended Jun 30, 2026) | |
| Preferred stock converts into common stockOn or about this date, at 30.3040 to 36.3640 common shares per preferred share. | Form 10-K, fiscal year 2026 (ended Jun 30, 2026) |
Learn: How to read a proxy statement (DEF 14A): Nvidia's 2026 proxy · Fiscal years that don't end in December: Nvidia's FY2027 explained
11Key facts
Key facts about Supermicro
- What does Supermicro do?
- Super Micro Computer (Supermicro) designs, builds and sells servers, storage systems, complete server racks with liquid cooling, and the software and services to run them. Supermicro's net sales were $39.1 billion in FY2026, the fiscal yearThe company's own 12-month year, which may not end in December. Learn more ended Jun 30, 2026.
- What is Supermicro's business model?
- Supermicro buys processors, GPUs, memory and other parts, designs systems around them from shared building blocks, and builds most of them in San Jose, California. In FY2026 Supermicro kept $10.82 of gross profit from every $100 of net sales, and $7.09 as operating income.
- How does Supermicro make money?
- Supermicro makes money on the gap between what customers pay for its servers and racks and what the parts and assembly cost. In FY2026 Supermicro's cost of sales was $34.8 billion against net sales of $39.1 billion, leaving $4.2 billion of gross profit.
- Is Supermicro profitable?
- Yes. Supermicro's net income to common stockholders was $2.2 billion in FY2026, up from $1.05 billion in FY2025, and its operating income was $2.8 billion. In Q1 FY2027 Supermicro's net income to common stockholders was $1.27 billion, after $327.4 million went to preferred stockholders.
- What is Supermicro's revenue by segment?
- Supermicro reports one segment, high-performance server solutions, so its FY2026 10-K gives no revenue split by business line. Of Supermicro's $39.1 billion of FY2026 net sales, services and software were $538.3 million, and customers in the United States took 70.9%.
- How much does Supermicro earn from AI GPU servers?
- Supermicro does not report AI server revenue as a separate figure. Its FY2026 10-K says net sales of Hyper Servers, GPU systems and Super Racks rose $15.26 billion, or 83.4%, in FY2026, mainly from NVIDIA GB200 and GB300 systems.
- How much does Supermicro earn from services and software?
- Supermicro's services and software revenue was $538.3 million in FY2026, up from $330.5 million in FY2025 and $228.3 million in FY2024. That was 1.4% of Supermicro's FY2026 net sales.
- Who are Supermicro's customers?
- Supermicro sold to over 1,000 customers in over 100 countries in FY2026, in enterprise data centers, cloud computing, AI, 5G and edge computing. One unnamed customer bought 28.1% of Supermicro's FY2026 net sales and 44.0% of its Q1 FY2027 net sales.
- Who owns Supermicro?
- Supermicro's co-founders Charles Liang and Sara Liu, who are married, held 12.2% of Supermicro's common stock on Jul 31, 2026, and all directors and executive officers 12.5%, according to the FY2026 10-K. Supermicro has one class of common stock with one vote per share.
Terms on this page
- Capital expenditures (capex)
- Customer concentration
- Debt-to-equity
- Earnings per share (EPS)
- EBITDA
- Free cash flow
- Gross margin
- Interest coverage
- Market cap
- Net debt
Each explains the term in plain English, with the same number from other companies on Cityfort.
Go deeper
More detail from the same filings. Open any section.
12What it sells
12What it sells
What does Supermicro sell?
AI and GPU servers and racks
Air- and liquid-cooled systems built around GPUs, such as NVIDIA's GB300 NVL72, GB200 NVL72 and HGX B300 and B200, and AMD Instinct chips, used to train and run AI models.
Data Center Building Block Solutions (DCBBS)
A complete, modular package for an AI data center: servers, storage, networking, racks, liquid cooling, power distribution, software and services. It grew to more than ten key subsystems in about a year.
Rackmount, blade and multi-node servers
General-purpose servers in many shapes and sizes (Hyper, CloudDC, BigTwin, SuperBlade and others) for company data centers and cloud providers.
Storage and edge systems
SuperStorage systems that hold large amounts of data, including for AI training, and compact systems for 5G networks, retail and other edge sites.
Subsystems and accessories
Server boards, chassis, power supplies and other parts sold on their own, mostly built into complete systems by the buyer.
Services and software ($538.3 million in FY2026)
Management software, installation, onsite and remote support for large deployments.
What it does
- Does: Designs its own server boards, chassis and systems, and builds most systems in San Jose, California
- Does: Assembles and tests systems in Taiwan, the Netherlands and Malaysia too
- Does: Sells directly to large cloud, enterprise and equipment-maker customers, and through distributors and resellers
What it does not do
- Does not: Does not make the processors or GPUs: it buys them from NVIDIA, AMD, Intel and others
- Does not: Does not report revenue by product line or customer type: it reports one segment
- Does not: Does not name the customer that bought 28.1% of FY2026 net sales
13How the money flows
13How the money flows · FY2026
How does money flow through Supermicro?
Money in
- Net sales (servers, storage, racks, services)$39.1B
- Interest and other income$213M
The company
Supermicro
$39.3B came in
Money out
- Cost of sales (parts, assembly, shipping)$34.8B
- Research and development$771M
- Sales, marketing and administration$686M
- Interest, and losses of part-owned companies$197M
- Income tax$556M
- Preferred dividends and preferred share of earnings$34.7M
- Net income to common stockholders$2.2B
- Customers paid Supermicro $39.1 billion in FY2026, and interest and other income added $213.3 million.
- Parts, assembly and shipping took $34.8 billion, leaving $4.2 billion of gross profit.
- Research, sales and administration took $1.46 billion, leaving $2.77 billion of operating income.
- Interest cost $194.6 million and income tax took $556.3 million, leaving $2.23 billion of net income.
- After $34.7 million for the preferred stock issued in June 2026, $2.2 billion was left for common stockholders.
14What it needs to run
14What it needs to run
What does Supermicro need to run?
Chips and parts from a few suppliers
Processors and GPUs come from NVIDIA, AMD and Intel, and the 10-K says Supermicro relies on a limited number of suppliers for some parts. Non-cancelable purchase commitments were $33.3 billion at Sep 30, 2026.
Factories
Most systems are built at the San Jose headquarters, with assembly and testing also in Taiwan, the Netherlands and Malaysia. A new Silicon Valley complex was under construction in FY2026.
Related-party contract manufacturers
Ablecom and Compuware, run by brothers of CEO Charles Liang, coordinate chassis manufacturing and other work. Purchases from them were $725.7 million, 2.1% of FY2026 cost of sales.
Engineers
Over 7,000 employees at Jun 30, 2026, about 3,500 of them in research and development.
Borrowed and raised money
Bank debt and convertible notes were $8.6 billion at Sep 30, 2026. In June 2026 Supermicro raised $5.6 billion, net, by selling common and preferred stock.
15Where it sells
15Where it sells · FY2026
Where does Supermicro sell?
- United States71%
- Asia16%
- Europe7%
- Other7%
16Competitors and what protects it
16Competitors and what protects it
Who does Supermicro compete with?
Dell
NYSE: DELL
Named by Supermicro as a global technology vendor competing for server and storage sales.
Hewlett-Packard Enterprise
Named by Supermicro as a global technology vendor competing for server and storage sales.
Lenovo
Named by Supermicro as a global technology vendor competing for server and storage sales.
Cisco
NASDAQ: CSCO
Named by Supermicro as a global technology vendor competing in its market.
Foxconn, Quanta Computer and Wiwynn
Original design manufacturers that Supermicro says benefit from scale and very low-cost manufacturing, and increasingly offer their own branded products.
What protects the business
Each strength is scored 1 (weak) to 5 (strong) for the business, with the reason. It is not a rating of the share.
- Speed to new chips3 of 5
Supermicro says its building-block designs let it assemble new systems quickly when chips launch. In FY2026 it shipped systems for NVIDIA GB300 and GB200 and announced support for NVIDIA Vera Rubin and AMD Helios.
- US manufacturing3 of 5
Supermicro builds most of its systems in San Jose and says it is the only major server vendor that makes a significant portion of its systems in the United States.
- Scale3 of 5
Net sales were $39.1 billion in FY2026, up from $5.2 billion in FY2022, with over 1,000 customers in over 100 countries.
- Customer lock-in1 of 5
One customer bought 44.0% of Q1 FY2027 net sales, and the 10-K says design manufacturers compete with very low-cost manufacturing.
Weak spot
Thin, uneven gross margin
Gross margin was 10.8% in FY2026, down from 15.4% in FY2022, and moved between 6.3% and 17.5% across the eight quarters to Sep 30, 2026.
Sources (6)
- Form 10-K, fiscal year 2026 (ended Jun 30, 2026)
- Form 10-K, fiscal year 2024 (ended Jun 30, 2024; filed late)
- Form 10-Q, Q1 fiscal 2027 (quarter ended Sep 30, 2026)
- Earnings release, Q1 fiscal 2027 (8-K Ex. 99.1, Nov 3, 2026)
- Earnings release, Q4 and fiscal 2026 (8-K Ex. 99.1, Aug 11, 2026)
- Earnings release, Q2 fiscal 2026 (8-K Ex. 99.1, Feb 3, 2026)
17Where growth could come from
17Where growth could come from
Where could Supermicro's growth come from?
Supermicro said in its Q1 FY2027 earnings release (Nov 3, 2026) that it expects Q2 FY2027 net sales of $19.5 billion to $21.5 billion and GAAP diluted EPS of $1.59 to $1.83. It expects FY2027 net sales of $72.0 billion to $82.0 billion, up from the $65.0 billion to $72.0 billion it gave on Aug 11, 2026.
AI GPU systems and racks
Working+$15.26B in FY2026, up 83.4%
The FY2026 10-K says net sales of Hyper Servers, GPU systems and Super Racks rose mainly from NVIDIA GB200 and GB300 systems. Supermicro does not give the total.
Status: Working, on track against what the company said.
Contracted revenue not yet delivered
Working$5.67B at Sep 30, 2026
Remaining performance obligationsSigned contracts with customers that have not been billed yet. rose from $1.03 billion a year earlier. Supermicro expects about 76% of them within 12 months.
Status: Working, on track against what the company said.
Complete data center packages (DCBBS)
NewMore than 10 subsystems
Supermicro added coolant units, heat exchangers, power shelves, battery backup and management software in about a year, to sell whole AI data centers rather than servers alone.
Status: New, recently announced.
Services and software
Working$538.3M in FY2026
Up from $330.5 million in FY2025 and $228.3 million in FY2024; still 1.4% of net sales.
Status: Working, on track against what the company said.
Broader customer base
MixedLargest customer 44.0% of Q1 FY2027
The FY2026 10-K names a richer enterprise customer mix as an aim. The largest customer's share was 28.1% in FY2026.
Status: Mixed, partly on track.
Status compares progress with what the company itself said it would do: Working = on track against what the company said; Mixed = partly on track; Behind = behind the company's own plan; New = recently announced; Early = too early to judge.
18The company's own measures (non-GAAP)
18The company's own measures · FY2026 to Q1 FY2027
What do Supermicro's own measures show?
Official (GAAP): Diluted EPS, FY2026
$3.26
Company's own measure: Non-GAAP diluted EPS, FY2026
$3.63
Supermicro leaves out stock-based compensationPay given as shares instead of cash, which spreads ownership more thinly. Learn more and its tax effect, and adjusts for the earnings allocated to the preferred stock.
Official (GAAP): Diluted EPS, Q1 FY2027
$1.75
Company's own measure: Non-GAAP diluted EPS, Q1 FY2027
$1.81
Same adjustments.
Official (GAAP): Net income, FY2026
$2.2B
Company's own measure: Adjusted EBITDA, FY2026
$3.4B
GAAP net income plus interest expense, income tax, depreciation and amortization, and stock-based compensation.
Official (GAAP): Net income, Q1 FY2027
$1.6B
Company's own measure: Adjusted EBITDA, Q1 FY2027
$2.2B
Same definition. Net income here is the total before amounts for preferred stockholders.
Official (GAAP): Gross margin, Q1 FY2027
12.7%
Company's own measure: Non-GAAP gross margin, Q1 FY2027
12.8%
Leaves out stock-based compensation within cost of sales.
Official (GAAP): Remaining performance obligations, Jun 30, 2026
$2.6B
Company's own measure: New orders received in Q4 FY2026 (company-stated, "in excess of")
$60.0B
Orders as Supermicro stated them in its Jul 21, 2026 business update; not in the audited statements. Remaining performance obligations count only contracted revenue not yet recognized. Never added together.
These are the company's own measures, defined by the company. They are not comparable across companies, and they are not added together. Each sits beside the nearest official (GAAP) figure.
Learn: Non-GAAP measures: what a company's "adjusted" numbers leave out · Stock-based compensation and dilution: pay that becomes shares
Sources (5)
- Earnings release, Q4 and fiscal 2026 (8-K Ex. 99.1, Aug 11, 2026)
- Earnings release, Q1 fiscal 2027 (8-K Ex. 99.1, Nov 3, 2026)
- Form 10-K, fiscal year 2026 (ended Jun 30, 2026)
- Form 10-Q, Q1 fiscal 2027 (quarter ended Sep 30, 2026)
- Form 8-K Ex. 99.1, Jul 21, 2026: Q4 fiscal 2026 preliminary business update
19Financial strength and debt
19Financial strength · Sep 30, 2026
How much debt does Supermicro have?
- Total debt$8.6B
- Cash and investments$6.9B
- Net debt (debt minus cash)$1.7B
- Net worth (shareholders' money)$16.1B
- Debt to equity
- 0.54×
- $ of debt for every $1 of shareholders' money
- Interest cover
- 14.2×
- how many times operating profit covers interest
- Net debt is a Cityfort calculation from Q1 FY2027 10-Q: $8,646.0 million of bank debt and convertible notes less $6,897.5 million of cash. The Q1 FY2027 earnings release states $8.6 billion of debt and $6.9 billion of cash.
- Equity of $16,068.6 million includes the preferred stock issued in June 2026 ($4,226.3 million at Jun 30, 2026). Debt-to-equity is a Cityfort calculation from Q1 FY2027 10-Q.
- Interest coverage is FY2026 operating income divided by interest expense: $2,770.5 million ÷ $194.6 million (Cityfort calculation from FY2026 10-K).
- At Jun 30, 2026 debt included $2.0 billion drawn on a JP Morgan revolving credit line due Dec 29, 2030, $1.76 billion on CTBC-led Taiwan credit lines signed in January 2026, and convertible notes of $1.725 billion due 2029 (3.50%), $700 million due 2028 (2.25%) and $2.3 billion due 2030 (0%).
- Inventories were $15,053.6 million and customer receivables $9,685.2 million at Sep 30, 2026. Non-cancelable purchase commitments were $33.3 billion.
20Who owns it
20Who owns it · ownership as of Jul 31, 2026
Who owns Supermicro?
- Officers and directors (as a group), shares
- 12.5%
Shares vs votes by class
Supermicro has more than one class of shares, and the classes carry different votes. The share of votes a class holds can differ a lot from its share of the shares.
- Common stock: share of all votes100.0%
- 7.00% Series A Mandatory Convertible Preferred Stock: share of all votes0.0%
Each class's part of all votes = its shares outstanding × votes per share ÷ the total for all classes.
Share classes
Holders of 5% or more
From the company's proxy statement (DEF 14A), later Schedule 13G filings and the share counts on its latest annual or quarterly report. Each holder row shows the date of its own filing.
Insider trades · Form 4 data as of Nov 6, 2026
What did Supermicro's insiders report trading?
Supermicro's insiders made 91 Form 4A filing an insider must make within two business days of buying or selling the company's shares. Learn more filings in the 12 months to Nov 6, 2026.
They reported no purchases and 10 sales (705,534 shares) in the open market or privately (codes P and S).
8 of the 10 sales were on forms with the Rule 10b5-1 plan box checked.
The same filings report 171 other share transactions (M: 90, F: 77, G: 4).
They also report 126 transactions in options, stock units or other derivatives.
Insiders are a company's officers, directors and owners of more than 10% of a class of its shares. Most changes in their holdings must be reported to the SEC on a Form 4 within two business days. Source: SEC Form 4 filings on EDGAR.
- P
- a purchase in the open market or privately
- S
- a sale in the open market or privately
- F
- shares withheld or handed over to pay an exercise price or tax when an award is received, exercised or vests
- M
- exercise or conversion of an option or other derivative, exempt under Rule 16b-3
- G
- a bona fide gift
Code meanings: General Instruction 8 of Form 4 (SEC).
The latest 25 of 181 transactions
Shares: A = acquired, D = disposed of. A price the filing gives only in a footnote shows as “See filing”. The 10b5-1 box is checked when at least one trade on the form was made under a Rule 10b5-1 plan. A Form 4/A replaces the form it amends. See all of Supermicro's Form 4 filings on EDGAR.
Learn: Dual-class shares: when votes and ownership don't match · How to read a proxy statement (DEF 14A): Nvidia's 2026 proxy · Form 4 insider filings: who files, the codes and the footnotes · Rule 10b5-1 trading plans: how insiders pre-schedule their trades
Sources (6)
- Form 10-Q, Q1 fiscal 2027 (quarter ended Sep 30, 2026)
- Form 10-K, fiscal year 2026 (ended Jun 30, 2026)
- Form 8-K, Jun 15, 2026 (Items 1.01, 3.03, 5.03: 7.00% Series A Mandatory Convertible Preferred Stock)
- Schedule 13G/A, Jane Street Group, LLC (event date Jun 30, 2026)
- Schedule 13G/A, Capital Ventures International and Susquehanna affiliates (event date Jun 30, 2026)
- Schedule 13G/A, Vanguard Portfolio Management (event date Sep 30, 2026)
21What it does with profit
21What it does with profit
What does Supermicro do with its profit?
Buyback · Jun 30, 2023
Shares repurchased during FY2023 (cash paid).
$150M
Buyback · Jun 30, 2025
Bought back 4,891,171 shares at about $40.89 in June 2025, alongside the sale of the 2030 convertible notes.
$200M
Money raised · Dec 5, 2023
Sold 23.15 million new common shares at $26.20 (split-adjusted); net proceeds.
$583M
Money raised · Mar 22, 2024
Sold 20.0 million new common shares at $87.50 (split-adjusted); net proceeds.
$1.7B
Money raised · Jun 30, 2024
Convertible notes issued during FY2024: $1,725 million due 2029, issued at 0% and amended in February 2025 to bear 3.50% (net cash).
$1.7B
Money raised · Jun 30, 2025
Convertible notes issued during FY2025: $700 million at 2.25% due 2028 and $2,300 million at 0% due 2030 (net cash).
$2.9B
Money raised · Jun 10, 2026
Sold 52.27 million new common shares at $27.50, including the underwriters' option (net cash).
$1.4B
Money raised · Jun 10, 2026
Sold 86.25 million depositary shares of 7.00% mandatory convertible preferred stock at $50.00 each (net cash).
$4.2B
Sources (4)
22Governance signals
22Governance signals
What do Supermicro's governance filings show?
- Auditor
- BDO USA, P.C., since 2024
- Auditor changes
- Oct 24, 2024: Ernst & Young LLP → BDO USA, P.C. (appointed Nov 18, 2024) (EY resigned during its first audit, of FY2024. The 8-K says EY raised questions about "whether the Company demonstrates a commitment to integrity and ethical values", the board's independence from the CEO and management, and whether it could rely on some representations. Supermicro said it disagreed with the decision, and a board Special Committee later said EY's conclusions were not supported by the facts it found.)
- Audit qualifications
- None reported
- Related-party dealings
- Supermicro buys contract manufacturing and parts from Ablecom and Compuware in Taiwan. Ablecom's CEO, Steve Liang, and Compuware's CEO, Bill Liang, are brothers of CEO Charles Liang, and Charles Liang and Sara Liu own about 10.5% of Ablecom. Purchases from the two were $725.7 million in FY2026, 2.1% of cost of sales, down from 4.3% in FY2024. In 2018 Charles Liang personally borrowed about $12.9 million from Steve Liang's spouse.
- Credit rating
- No public credit rating found in a search of rating agency sites on Nov 6, 2026
Flags to know about
auditor · Oct 24, 2024
Auditor resigned in 2024
Ernst & Young resigned on Oct 24, 2024 while auditing FY2024, and BDO USA was appointed on Nov 18, 2024. A board Special Committee reported on Dec 2, 2024 that the evidence it reviewed did not raise substantial concerns about senior management's integrity, and recommended a new CFO and a Chief Accounting Officer.
late filing · Feb 25, 2025
Late annual and quarterly reports
Supermicro did not file its FY2024 10-K on time and received Nasdaq notices. It filed the FY2024 10-K and the Q1 and Q2 FY2025 10-Qs on Feb 25, 2025, and Nasdaq confirmed it had regained compliance.
auditor
Internal control not effective at Jun 30, 2026
The FY2025 10-K reported four material weaknesses in internal control. Three were fixed; one, over IT access controls, was unremediated at Jun 30, 2026, so the FY2026 10-K says internal control over financial reporting was not effective. The Q1 FY2027 10-Q says it was still unremediated at Sep 30, 2026.
regulatory · Mar 19, 2026
Export-control indictment of three individuals
On Mar 19, 2026 federal prosecutors in New York unsealed an indictment of three individuals associated with Supermicro at the time, including then-director Wally Liaw, over an alleged conspiracy to commit export-control violations. Supermicro is not named as a defendant, and Liaw resigned from the board on Mar 20, 2026. An independent investigation for the board did not find evidence that current senior management knew of the alleged conduct, the 10-K says.
regulatory
Subpoenas, inquiries and lawsuits
The FY2026 10-K lists SEC subpoenas, a grand jury subpoena and other Justice Department and Commerce Department (BIS) inquiries, securities class actions filed since Aug 30, 2024, shareholder derivative suits and Netlist patent complaints at the US International Trade Commission. Supermicro says it has not been told it is the target of the investigations and gives no estimate of possible losses.
related party
Suppliers run by the CEO's brothers
Ablecom and Compuware, run by Charles Liang's brothers, supplied $725.7 million of contract manufacturing and parts in FY2026, 2.1% of cost of sales.
other
Changes at the top in 2025 and 2026
The senior vice presidents of operations (George Kao, Dec 31, 2025) and of worldwide sales (Don Clegg, May 15, 2026) retired, Mark Long became CFO on Oct 14, 2026, and director Judy Lin retired on Oct 9, 2026, replaced by Shesha Krishnapura.
other
Staggered board and annual meeting votes
Supermicro has a classified board of 8 directors, elected in staggered terms. At the Apr 15, 2026 annual meeting Charles Liang received 234.6 million votes for and 45.7 million withheld.
disclosure
What Supermicro does not disclose
Supermicro reports one segment, does not split net sales by product line or customer type, and does not name the customers that bought 10% or more of its net sales.
Sources (15)
- Form 8-K, Nov 18, 2024 (Items 4.01, 8.01: BDO appointed auditor; Nasdaq compliance plan)
- Form 10-K, fiscal year 2026 (ended Jun 30, 2026)
- Form 8-K, Oct 30, 2024 (Item 4.01: Ernst & Young resigns as auditor)
- Form 8-K, Dec 2, 2024 (Items 5.02, 8.01: Special Committee findings; Chief Accounting Officer appointed)
- Form 10-Q, Q1 fiscal 2027 (quarter ended Sep 30, 2026)
- Form 10-K, fiscal year 2024 (ended Jun 30, 2024; filed late)
- Form 8-K, Feb 26, 2025 (Item 3.01: Nasdaq filing compliance regained)
- Form 10-K, fiscal year 2025 (ended Jun 30, 2025)
- Form 8-K, Mar 20, 2026 (Item 5.02: export-control indictment of three individuals; director resignation)
- Form 8-K, Dec 29, 2025 (Item 5.02: SVP Operations retires)
- Form 8-K, May 18, 2026 (Item 5.02: SVP Worldwide Sales retires)
- Form 8-K, Oct 15, 2026 (Item 5.02: Mark Long appointed CFO, David Weigand ceases)
- Form 8-K, Oct 8, 2026 (Item 5.02: director appointed, director retires)
- Proxy statement (DEF 14A) for the Apr 15, 2026 annual meeting
- Form 8-K, Apr 20, 2026 (Items 5.02, 5.07: Apr 15, 2026 annual meeting results)
23What the market paid
23What the market paid · price as of Nov 5, 2026
What did the market pay for Supermicro on Nov 5, 2026?
Price as of Nov 5, 2026 (shown for education; prices change daily).
Price as of Nov 5, 2026: SMCI closed at $27.08 on Nasdaq. Market value = $27.08 × 659.2 million common shares on Oct 31, 2026 = about $17.9 billion (Cityfort calculation from the Nov 5, 2026 Nasdaq closing price and the Q1 FY2027 10-Q). It leaves out the preferred stock, which converts into 130.7 million to 156.8 million common shares around Jun 1, 2029, and the convertible notes. P/E is price ÷ earnings per share: 5.8 on $4.69, the sum of diluted EPS for the four quarters to Sep 30, 2026 (Cityfort calculation from the Nov 5, 2026 Nasdaq closing price and the Q2 FY2026 to Q1 FY2027 earnings releases), and 8.3 on FY2026 diluted EPS of $3.26. P/B is not shown because equity includes the preferred stock.
- Share price
- $27.08
- Market value (market cap)
- $17.9B
- P/E
- 5.8×
More price-based ratios · as of Nov 5, 2026
Each ratio divides a number from the company's filings by the market value or share price on Nov 5, 2026. Prices change daily, so these ratios do too.
Price to sales (P/S)
0.3×
$17.9B market value ÷ $54.0B revenue (four quarters to Sep 30, 2026) = 0.3×
Cityfort calculation from the Nov 5, 2026 closing price and the Q2 FY2026 to Q1 FY2027 10-Ks and 10-Qs. Source: SMCI historical quotes, Nasdaq, Oct 1 to Nov 5, 2026 (Nov 5, 2026 close $27.08); Form 10-Q, Q1 fiscal 2027 (quarter ended Sep 30, 2026); Form 10-K, fiscal year 2026 (ended Jun 30, 2026) and 6 more
How price ratios workFree cash flow yield
−39.1%
−$7.0B free cash flow (FY2026) ÷ $17.9B market value = −39.1%
Cityfort calculation from the FY2026 10-K and the Nov 5, 2026 closing price. Source: SMCI historical quotes, Nasdaq, Oct 1 to Nov 5, 2026 (Nov 5, 2026 close $27.08); Form 10-Q, Q1 fiscal 2027 (quarter ended Sep 30, 2026); Form 10-K, fiscal year 2026 (ended Jun 30, 2026) and 4 more
What free cash flow means
Shares used for the market value: 663.54 million ($27.08 × 663.54 million shares ≈ $17.9B). Source: Form 10-Q, Q1 fiscal 2027 (quarter ended Sep 30, 2026); Form 10-K, fiscal year 2026 (ended Jun 30, 2026); Form 8-K, Jun 15, 2026 (Items 1.01, 3.03, 5.03: 7.00% Series A Mandatory Convertible Preferred Stock)
Source: SMCI historical quotes, Nasdaq, Oct 1 to Nov 5, 2026 (Nov 5, 2026 close $27.08); Form 10-Q, Q1 fiscal 2027 (quarter ended Sep 30, 2026); Form 10-K, fiscal year 2026 (ended Jun 30, 2026) and 4 more
Sources (10)
- SMCI historical quotes, Nasdaq, Oct 1 to Nov 5, 2026 (Nov 5, 2026 close $27.08)
- Form 10-Q, Q1 fiscal 2027 (quarter ended Sep 30, 2026)
- Form 10-K, fiscal year 2026 (ended Jun 30, 2026)
- Earnings release, Q1 fiscal 2027 (8-K Ex. 99.1, Nov 3, 2026)
- Earnings release, Q4 and fiscal 2026 (8-K Ex. 99.1, Aug 11, 2026)
- Earnings release, Q3 fiscal 2026 (8-K Ex. 99.1, May 5, 2026)
- Earnings release, Q2 fiscal 2026 (8-K Ex. 99.1, Feb 3, 2026)
- Form 10-Q, Q2 fiscal 2026 (quarter ended Dec 31, 2025)
- Form 10-Q, Q3 fiscal 2026 (quarter ended Mar 31, 2026)
- Form 8-K, Jun 15, 2026 (Items 1.01, 3.03, 5.03: 7.00% Series A Mandatory Convertible Preferred Stock)
24How it got here
24How it got here
How did Supermicro get here?
1993
Milestone
Founded in San Jose
Charles Liang and Sara Liu founded Super Micro in September 1993. It still builds most of its systems at its San Jose headquarters.
2024
Business-model change
AI servers double net sales
Net sales rose 110.4% to $15.0 billion in FY2024. Supermicro sold about $2.3 billion of new shares in December 2023 and March 2024 to fund the growth.
2024
Milestone
10-for-1 stock split
Each share became ten, effective Sep 30, 2024. Per-share figures on this page are split-adjusted.
2024
Crisis
Late filing and auditor resignation
Supermicro delayed its FY2024 10-K in August 2024, Ernst & Young resigned on Oct 24, 2024, and BDO was appointed on Nov 18, 2024.
2025
Crisis
Filings caught up, sales outlook cut
The late reports were filed on Feb 25, 2025. Supermicro cut its FY2025 net sales outlook twice, to $21.8 billion to $22.6 billion, and reported $21.97 billion.
2026
Crisis
Export-control indictment
An indictment of three individuals associated with the company at the time, including a then-director, over an alleged conspiracy to commit export-control violations was unsealed on Mar 19, 2026; the company is not named as a defendant.
2026
Business-model change
$5.6 billion raised in June 2026
Supermicro sold $1.4 billion of common stock and $4.2 billion of mandatory convertible preferred stock, net, after FY2026 net sales reached $39.1 billion.
2026
Milestone
New CFO
Mark Long became Chief Financial Officer on Oct 14, 2026.
Sources (13)
- Form 10-K, fiscal year 2026 (ended Jun 30, 2026)
- Form 10-K, fiscal year 2025 (ended Jun 30, 2025)
- Form 10-K, fiscal year 2024 (ended Jun 30, 2024; filed late)
- Form 8-K, Oct 30, 2024 (Item 4.01: Ernst & Young resigns as auditor)
- Form 8-K, Nov 18, 2024 (Items 4.01, 8.01: BDO appointed auditor; Nasdaq compliance plan)
- Form 8-K, Dec 2, 2024 (Items 5.02, 8.01: Special Committee findings; Chief Accounting Officer appointed)
- Form 8-K, Feb 26, 2025 (Item 3.01: Nasdaq filing compliance regained)
- Business update, Q2 fiscal 2025 (8-K Ex. 99.1, Feb 11, 2025)
- Earnings release, Q3 fiscal 2025 (8-K Ex. 99.1, May 6, 2025)
- Form 8-K, Mar 20, 2026 (Item 5.02: export-control indictment of three individuals; director resignation)
- Form 8-K, Jun 12, 2026 (Items 1.01, 7.01: common stock offering and $1.25B ATM program)
- Form 8-K, Jun 15, 2026 (Items 1.01, 3.03, 5.03: 7.00% Series A Mandatory Convertible Preferred Stock)
- Form 8-K, Oct 15, 2026 (Item 5.02: Mark Long appointed CFO, David Weigand ceases)
25Sources and changes
Where every number on this page comes from
Sources (35 documents)
- S1Form 10-K, fiscal year 2026 (ended Jun 30, 2026) · Super Micro Computer, Inc. (SEC EDGAR) · Tier 1: company or exchange filing · Aug 31, 2026
- S2Form 10-K, fiscal year 2025 (ended Jun 30, 2025) · Super Micro Computer, Inc. (SEC EDGAR) · Tier 1: company or exchange filing · Aug 28, 2025
- S3Form 10-K, fiscal year 2024 (ended Jun 30, 2024; filed late) · Super Micro Computer, Inc. (SEC EDGAR) · Tier 1: company or exchange filing · Feb 25, 2025
- S5Form 10-Q, Q1 fiscal 2027 (quarter ended Sep 30, 2026) · Super Micro Computer, Inc. (SEC EDGAR) · Tier 1: company or exchange filing · Nov 6, 2026
- S6Form 10-Q, Q3 fiscal 2026 (quarter ended Mar 31, 2026) · Super Micro Computer, Inc. (SEC EDGAR) · Tier 1: company or exchange filing · May 11, 2026
- S7Form 10-Q, Q2 fiscal 2026 (quarter ended Dec 31, 2025) · Super Micro Computer, Inc. (SEC EDGAR) · Tier 1: company or exchange filing · Feb 6, 2026
- S8Form 10-Q, Q1 fiscal 2026 (quarter ended Sep 30, 2025) · Super Micro Computer, Inc. (SEC EDGAR) · Tier 1: company or exchange filing · Nov 7, 2025
- S9Earnings release, Q1 fiscal 2027 (8-K Ex. 99.1, Nov 3, 2026) · Super Micro Computer, Inc. (SEC EDGAR) · Tier 1: company or exchange filing · Nov 3, 2026
- S10Earnings release, Q4 and fiscal 2026 (8-K Ex. 99.1, Aug 11, 2026) · Super Micro Computer, Inc. (SEC EDGAR) · Tier 1: company or exchange filing · Aug 11, 2026
- S11Earnings release, Q3 fiscal 2026 (8-K Ex. 99.1, May 5, 2026) · Super Micro Computer, Inc. (SEC EDGAR) · Tier 1: company or exchange filing · May 5, 2026
- S12Earnings release, Q2 fiscal 2026 (8-K Ex. 99.1, Feb 3, 2026) · Super Micro Computer, Inc. (SEC EDGAR) · Tier 1: company or exchange filing · Feb 3, 2026
- S13Earnings release, Q1 fiscal 2026 (8-K Ex. 99.1, Nov 4, 2025) · Super Micro Computer, Inc. (SEC EDGAR) · Tier 1: company or exchange filing · Nov 4, 2025
- S14Earnings release, Q4 and fiscal 2025 (8-K Ex. 99.1, Aug 5, 2025) · Super Micro Computer, Inc. (SEC EDGAR) · Tier 1: company or exchange filing · Aug 5, 2025
- S15Earnings release, Q3 fiscal 2025 (8-K Ex. 99.1, May 6, 2025) · Super Micro Computer, Inc. (SEC EDGAR) · Tier 1: company or exchange filing · May 6, 2025
- S16Business update, Q2 fiscal 2025 (8-K Ex. 99.1, Feb 11, 2025) · Super Micro Computer, Inc. (SEC EDGAR) · Tier 1: company or exchange filing · Feb 11, 2025
- S17Proxy statement (DEF 14A) for the Apr 15, 2026 annual meeting · Super Micro Computer, Inc. (SEC EDGAR) · Tier 1: company or exchange filing · Mar 3, 2026
- S18Form 8-K, Nov 3, 2026 (Items 2.02, 8.01: Q1 FY2027 results; preferred dividend) · Super Micro Computer, Inc. (SEC EDGAR) · Tier 1: company or exchange filing · Nov 3, 2026
- S20Form 8-K Ex. 99.1, Jul 21, 2026: Q4 fiscal 2026 preliminary business update · Super Micro Computer, Inc. (SEC EDGAR) · Tier 1: company or exchange filing · Jul 21, 2026
- S21Form 8-K, Oct 15, 2026 (Item 5.02: Mark Long appointed CFO, David Weigand ceases) · Super Micro Computer, Inc. (SEC EDGAR) · Tier 1: company or exchange filing · Oct 15, 2026
- S22Form 8-K, Oct 8, 2026 (Item 5.02: director appointed, director retires) · Super Micro Computer, Inc. (SEC EDGAR) · Tier 1: company or exchange filing · Oct 8, 2026
- S23Form 8-K, Jun 12, 2026 (Items 1.01, 7.01: common stock offering and $1.25B ATM program) · Super Micro Computer, Inc. (SEC EDGAR) · Tier 1: company or exchange filing · Jun 12, 2026
- S24Form 8-K, Jun 15, 2026 (Items 1.01, 3.03, 5.03: 7.00% Series A Mandatory Convertible Preferred Stock) · Super Micro Computer, Inc. (SEC EDGAR) · Tier 1: company or exchange filing · Jun 15, 2026
- S25Form 8-K, Mar 20, 2026 (Item 5.02: export-control indictment of three individuals; director resignation) · Super Micro Computer, Inc. (SEC EDGAR) · Tier 1: company or exchange filing · Mar 20, 2026
- S26Form 8-K, May 18, 2026 (Item 5.02: SVP Worldwide Sales retires) · Super Micro Computer, Inc. (SEC EDGAR) · Tier 1: company or exchange filing · May 18, 2026
- S27Form 8-K, Jan 26, 2026 (Item 1.01: CTBC-led Taiwan revolving credit facilities) · Super Micro Computer, Inc. (SEC EDGAR) · Tier 1: company or exchange filing · Jan 26, 2026
- S28Form 8-K, Dec 29, 2025 (Item 5.02: SVP Operations retires) · Super Micro Computer, Inc. (SEC EDGAR) · Tier 1: company or exchange filing · Dec 29, 2025
- S29Form 8-K, Oct 30, 2024 (Item 4.01: Ernst & Young resigns as auditor) · Super Micro Computer, Inc. (SEC EDGAR) · Tier 1: company or exchange filing · Oct 30, 2024
- S30Form 8-K, Nov 18, 2024 (Items 4.01, 8.01: BDO appointed auditor; Nasdaq compliance plan) · Super Micro Computer, Inc. (SEC EDGAR) · Tier 1: company or exchange filing · Nov 18, 2024
- S31Form 8-K, Dec 2, 2024 (Items 5.02, 8.01: Special Committee findings; Chief Accounting Officer appointed) · Super Micro Computer, Inc. (SEC EDGAR) · Tier 1: company or exchange filing · Dec 2, 2024
- S32Form 8-K, Feb 26, 2025 (Item 3.01: Nasdaq filing compliance regained) · Super Micro Computer, Inc. (SEC EDGAR) · Tier 1: company or exchange filing · Feb 26, 2025
- S33Schedule 13G/A, Jane Street Group, LLC (event date Jun 30, 2026) · Jane Street Group, LLC (SEC EDGAR) · Tier 1: company or exchange filing · Aug 13, 2026
- S34Schedule 13G/A, Capital Ventures International and Susquehanna affiliates (event date Jun 30, 2026) · Capital Ventures International (SEC EDGAR) · Tier 1: company or exchange filing · Aug 14, 2026
- S35Schedule 13G/A, Vanguard Portfolio Management (event date Sep 30, 2026) · Vanguard Portfolio Management (SEC EDGAR) · Tier 1: company or exchange filing · Oct 30, 2026
- S36SMCI historical quotes, Nasdaq, Oct 1 to Nov 5, 2026 (Nov 5, 2026 close $27.08) · Nasdaq, Inc. · Tier 1: company or exchange filing · Nov 5, 2026
- S37Form 8-K, Apr 20, 2026 (Items 5.02, 5.07: Apr 15, 2026 annual meeting results) · Super Micro Computer, Inc. (SEC EDGAR) · Tier 1: company or exchange filing · Apr 20, 2026
Changes to this page (v1 · Nov 6, 2026)
- v1 · Nov 6, 2026First version. (first version)
Numbers come only from tier 1 and tier 2 sources. Read how we research.
Disclaimer
For learning only. Cityfort is not a registered investment adviser or broker-dealer and does not recommend buying or selling any security. Prices shown are dated and may be out of date.
Investing in securities involves risk, including loss of capital. Before making any investment decision, do your own research and consider consulting a registered investment adviser or other qualified professional.
Cityfort, its owners and contributors may or may not hold securities of companies covered. Cityfort is not paid by any company it covers. Content is not an offer or solicitation to buy or sell any security, including in any initial public offering.
Read the positions policyRead the full disclaimerHide the full disclaimer
Cityfort publishes general educational content that explains how listed companies work. Cityfort is not registered with the US Securities and Exchange Commission or any state securities regulator as an investment adviser, and is not a broker-dealer or a member of FINRA. Cityfort does not provide investment, tax or legal advice, recommendations, ratings, price targets or any opinion on whether to buy, sell or hold any security. Nothing on the site is tailored to any person's circumstances.
All information is taken from publicly available sources, mainly company filings with the SEC, which are listed on each page with dates. We work to keep it accurate and correct errors publicly, but we do not guarantee that it is complete, accurate or up to date. Any market price or price-based ratio shown is dated, may be out of date by the time you read it, and is included only to explain concepts.
Statements by company management, including forward-looking statements and guidance, are reported as the company's statements, with their date and source; they are not our forecasts. Adjusted (non-GAAP) figures are the company's own measures and are shown next to the official (GAAP) figures.