Technology · NASDAQ: ZM
Zoom: how the business works
Zoom sells subscriptions to video meetings, cloud phone, team chat and contact-center software, with revenue of $4.87 billion in FY2026 (year ended Jan 31, 2026).
By Hardik Bhandare · Checked against filings: . Editorial policy. Corrections
Follow Zoom
Email me when Zoom's page is updated after earnings.
We'll send a confirmation email first. See our privacy policy.
Zoom Communications, Inc. · San Jose, California · Founded 2011
Updated for Q2 FY2027 · checked
- Revenue, FY2026
- $4.87B
- Operating income, FY2026
- $1.12B
- Net income, FY2026 (incl. $969.8M investment gains)
- $1.90B
- Customers paying over $100K a year, Jul 31, 2026
- 4,625
- Employees, Jan 31, 2026
- 7,438
The short version
Zoom in 5 points
1 · What it sells
Zoom sells subscriptions to video meetings, cloud phone, team chat and contact-center software, with revenue of $4.87 billion in FY2026, the year ended Jan 31, 2026.
2 · Who pays it
Enterprise customers, served by Zoom's sales team and partners, paid 60.3% of FY2026 revenue and Online customers, who subscribe on its website, paid 39.7%, with no single customer reaching one-tenth of revenue.
3 · What it keeps from $100
Of every $100 that came in during FY2026, including investment gains and interest, Zoom kept $30.8 as net income, while its operating income, before those gains, was $23.1 per $100 of revenue.
4 · Where the operating profit comes from
Zoom reports one segment and no profit by product, but it kept $77.0 of gross profit per $100 of FY2026 revenue, and sales and marketing took $28.5 per $100.
5 · The one thing to watch
In Q2 FY2027 Zoom's net income of $1,542.4 million was above its revenue of $1,277.2 million because of a $1,612.7 million unrealized gain on its Anthropic stake, while operating income was $314.3 million.
Sources: From Zoom's FY2026 10-K, Q2 FY2027 10-Q and Q2 FY2027 earnings release · checked
See the full receipt and the management scorecard below
01Where the money goes · FY2026
Where does $100 of Zoom's money go?
Zoom · FY2026
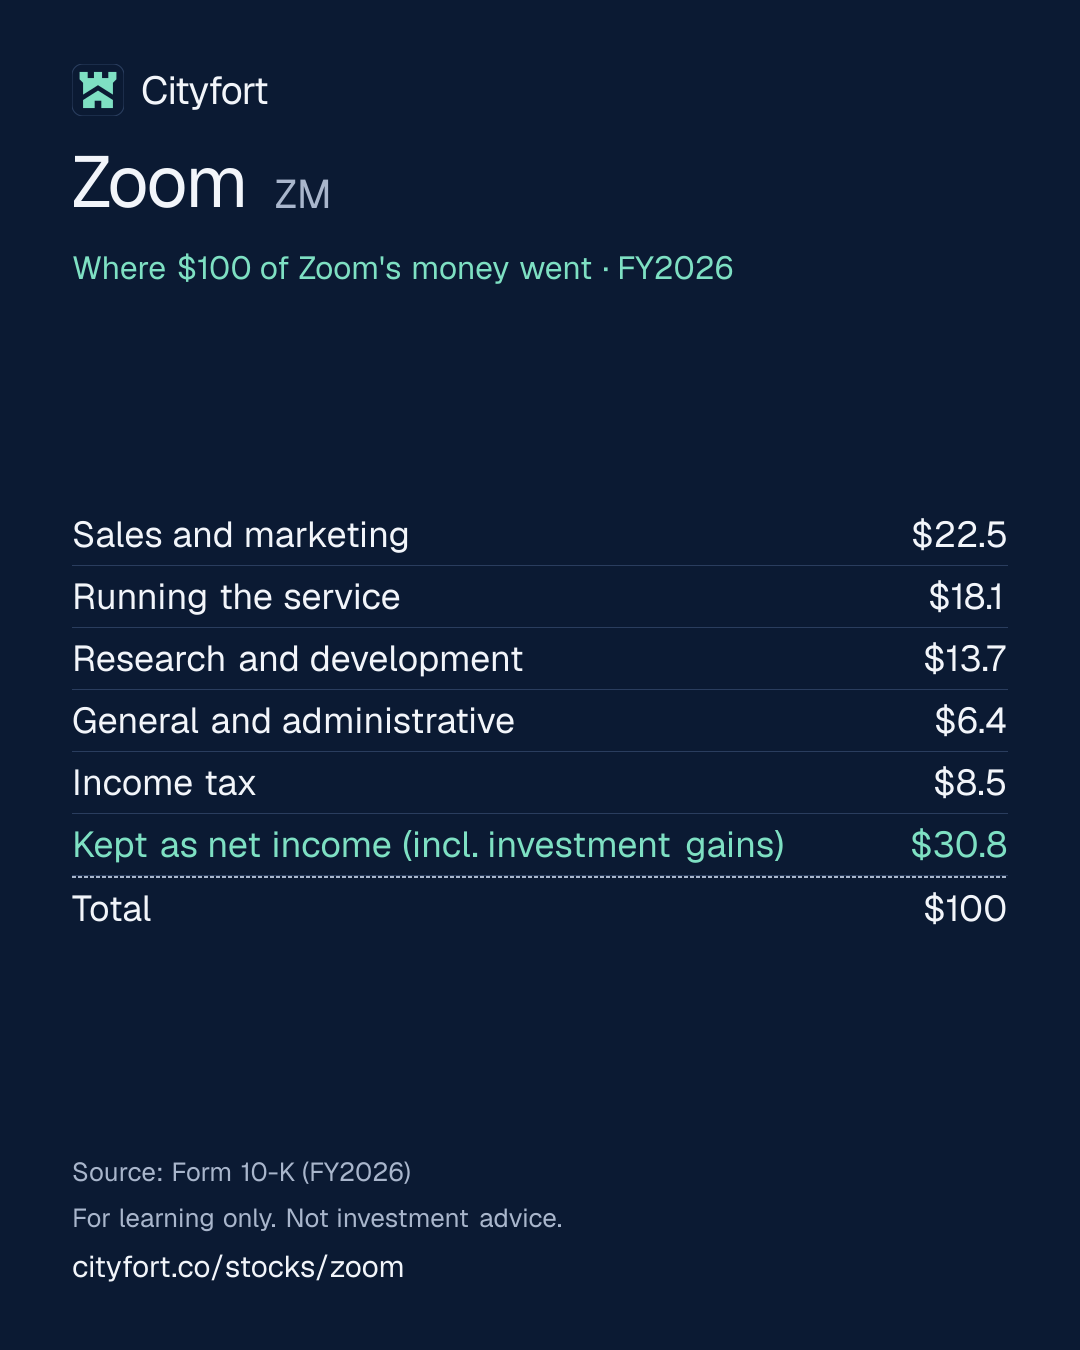
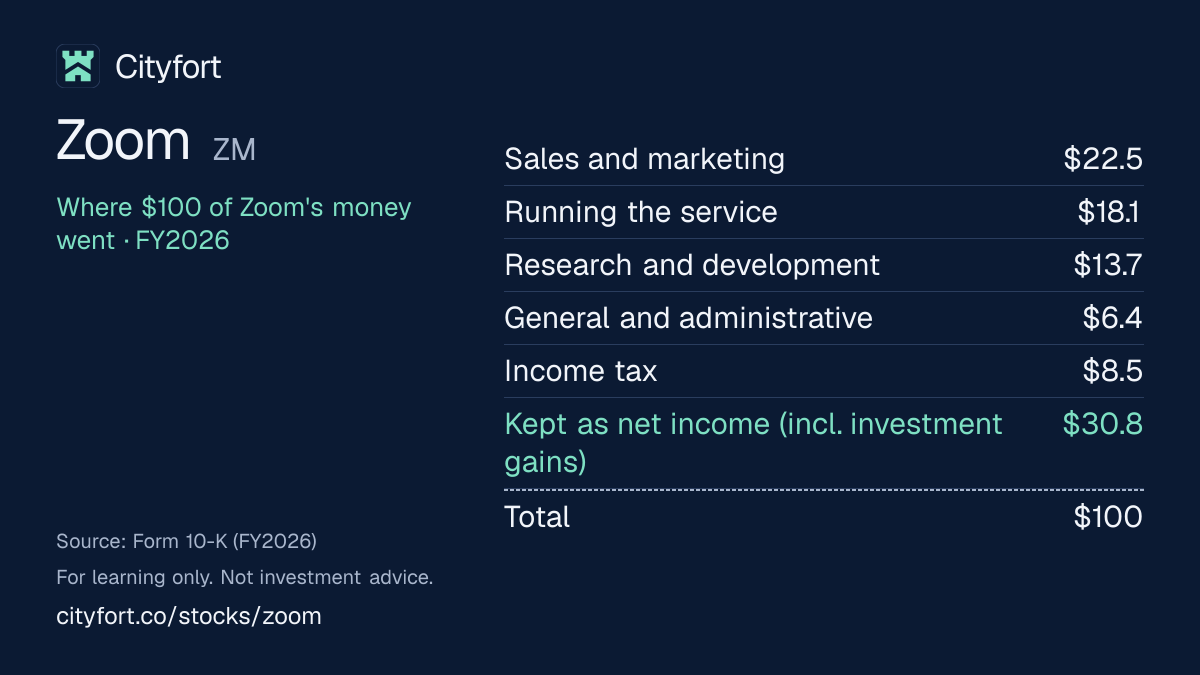
Receipt for every $100
| Sales and marketing | $22.5 |
|---|---|
| Running the service | $18.1 |
| Research and development | $13.7 |
| General and administrative | $6.4 |
| Income tax | $8.5 |
| Kept as net income (incl. investment gains) | $30.8 |
| Total | $100 |
Each line = amount ÷ total money in × 100. Lines may not add to exactly $100 because of rounding.
How this is worked out
Cityfort calculation from the FY2026 10-K. Of every $100 that came in during FY2026: revenue of $4,868.8 million plus $969.8 million of gains on strategic investments and $328.8 million of other income, mostly interest, $6,167.4 million in all. Each line = line ÷ $6,167.4 million × 100. The profit line includes the investment gains; on revenue alone, operating income was $23.1 per $100. Stock-based pay ($760.8 million) sits inside the cost lines.
Save this receipt as an image:
1080 × 1350 PNG for Instagram, LinkedIn1200 × 675 PNG for X
Embed this receipt
Paste this code into a blog or website to show the receipt, with a link back to this page:
Each week: one company explained in 5 points, picked by earnings date.
Free, no tips, unsubscribe anytime.
We'll send a confirmation email. See our privacy policy.
02The business in one line
What does Zoom do?
Businesses and individuals pay Zoom subscriptions for meetings, phone and chat software; sales and marketing and running the service take most of the money, and $23.1 of every $100 of FY2026 revenue was left as operating income.
- Enterprise customers, served by Zoom's sales team and partners, paid 60.3% of FY2026 revenue. Online customers, who subscribe on Zoom's website, paid 39.7%.
- FY2026 net income of $1,900.1 million was larger than operating income of $1,123.6 million because it included $969.8 million of gains on Zoom's stakes in other companies.
03Who pays it
Who pays Zoom?
Enterprise customers
60%
of revenue
Business units reached by Zoom's direct sales team, resellers or strategic partners: $2,934.1 million, 60.3% of FY2026 revenue, up 6.5%.
Online customers
40%
of revenue
Customers who subscribe through Zoom's website: $1,934.7 million, 39.7% of FY2026 revenue, up 1.2%.
- Enterprise customers60%
- Online customers40%
How spread out the customers are
Zoom's FY2026 10-K says no customer was more than 10% of revenue. Customers paying more than $100,000 over the trailing 12 months made up 32.8% of FY2026 revenue; there were 4,625 of them at Jul 31, 2026. Enterprise and Online are Zoom's customer categories, not reporting segments, and the company notes some overlap between them.
04Why it makes money
Why does Zoom make money?
Most of each subscription dollar is gross profit; spending on sales and stock-based pay decides what is left.
Zoom kept $77.0 of gross profit per $100 of revenue in FY2026. Operating income fell to $5.6 per $100 in FY2023, when stock-based payPay given as shares instead of cash, which spreads ownership more thinly. Learn more was $1,285.8 million. It rose to $23.1 in FY2026 as sales and marketing fell from $1,696.6 million to $1,388.3 million and stock-based pay to $760.8 million.
Gross profit per $100 of revenue
$74.3$77.0
FY2022 to FY2026
- People try Zoom or buy a plan on its website
- Sales teams and partners sign larger organizations
- Customers add phone, chat and contact-center products
- Subscriptions renew monthly, yearly or over several years
- Billing in advance brings in cash before revenue is recognized
- Cash pays for engineers, acquisitions and share repurchases
↺ Step 6 feeds back into step 1.
05The numbers · Consolidated · US$
How has Zoom done?
Revenue
$4.9BFY2026
Revenue grew every year, from $4,099.9 million in FY2022 to $4,868.8 million in FY2026, by between 3.1% and 7.1% a year, and was $1,277.2 million in Q2 FY2027, up 4.9% from a year earlier.
US$
See the numbers
Net profit
$1.9BFY2026
Net income moves with taxes and investment gains: it includes a $274.0 million tax benefit in FY2022, $969.8 million of strategic-investment gains in FY2026 and a $1,612.7 million unrealized gain on the Anthropic stake in Q2 FY2027, when net income exceeded revenue.
US$
See the numbers
Profit kept per $100 of revenue
$39.0FY2026
Operating income was $23.1 per $100 of revenue in FY2026, up from $5.6 in FY2023, when stock-based pay was $1,285.8 million, or 29.3% of revenue; it was 15.6% of revenue in FY2026.
$ of profit per $100 of revenue (net margin)
See the numbers
Free cash flow
$1.9BFY2026
Free cash flow (cash from operations minus equipment purchases) was $1,924.1 million in FY2026, 39.5% of revenue, helped by $760.8 million of stock-based pay that costs no cash.
US$ · cash from operations minus spending on plants and equipment
See the numbers
See all yearly numbers
EBITDA here = operating income plus depreciation and amortization (from the cash flow statement). Fiscal years are the company's own (January 31 (FY2026 = year ended Jan 31, 2026)). Net profit is the share belonging to the company's owners.
Download Zoom's yearly and quarterly numbers (CSV, with source ids)
Learn: Fiscal years that don't end in December: Nvidia's FY2027 explained · Stock-based compensation and dilution: pay that becomes shares
Sources (11)
- Form 10-K, fiscal year 2024 (ended Jan 31, 2024)
- Form 10-K, fiscal year 2026 (ended Jan 31, 2026)
- Q1 fiscal 2026 earnings release (8-K Ex. 99.1, May 21, 2025)
- Q2 fiscal 2026 earnings release (8-K Ex. 99.1, Aug 21, 2025)
- Q3 fiscal 2025 earnings release (8-K Ex. 99.1, Nov 25, 2024)
- Q4 and fiscal 2025 earnings release (8-K Ex. 99.1, Feb 24, 2025)
- Q3 fiscal 2026 earnings release (8-K Ex. 99.1, Nov 24, 2025)
- Q4 and fiscal 2026 earnings release (8-K Ex. 99.1, Feb 25, 2026)
- Q1 fiscal 2027 earnings release (8-K Ex. 99.1, May 21, 2026)
- Q2 fiscal 2027 earnings release (8-K Ex. 99.1, Aug 25, 2026)
- Form 10-Q, Q2 fiscal 2027 (quarter ended Jul 31, 2026)
06Who runs it
Who runs Zoom, and did they deliver?
Eric S. Yuan
Founder, Chairman, President and CEO · since 2011
CEO since June 2011; formerly vice president of engineering at Cisco. FY2026 total pay was $1,280,858, including a $450,000 salary and $464,022 of stock awards; FY2024 total pay was $28,082,133, mostly stock awards.
Jeff Epstein
Director · since 2026
Joined the board on Aug 31, 2026; a former chief financial officer of Oracle.
What they said, and what happened
3 delivered · 2 too early to tell
Said on Feb 24, 2025
Zoom said it expected FY2026 revenue of $4.785–4.795 billion.
DeliveredWhat happened
FY2026 revenue was $4,868.8 million, above the range.
Said on Feb 24, 2025
Zoom said it expected FY2026 free cash flowCash from operations minus spending on buildings and equipment. Learn more of $1.680–1.720 billion.
DeliveredWhat happened
FY2026 free cash flow was $1,924.1 million.
Said on May 21, 2026
Zoom said it expected Q2 FY2027 revenue of $1.265–1.270 billion.
DeliveredWhat happened
Q2 FY2027 revenue was $1,277.2 million.
Said on Aug 25, 2026
Zoom said it expected Q3 FY2027 revenue of $1.275–1.280 billion.
Too early to tellWhat happened
Q3 FY2027 ended Oct 31, 2026; results were not out in the documents read.
Said on Aug 25, 2026
Zoom said it expected FY2027 revenue of $5.085–5.095 billion.
Too early to tellWhat happened
FY2027 ends Jan 31, 2027. Revenue was $2,516.2 million in the first half (Cityfort calculation from the Q1 FY2027 and Q2 FY2027 earnings releases).
Sources (6)
- 2026 proxy statement (DEF 14A)
- Form 8-K, Items 5.02 and 7.01: Jeff Epstein joins board; Jonathan Chadwick to retire Nov 19, 2026
- Q4 and fiscal 2025 earnings release (8-K Ex. 99.1, Feb 24, 2025)
- Q4 and fiscal 2026 earnings release (8-K Ex. 99.1, Feb 25, 2026)
- Q1 fiscal 2027 earnings release (8-K Ex. 99.1, May 21, 2026)
- Q2 fiscal 2027 earnings release (8-K Ex. 99.1, Aug 25, 2026)
07What could go wrong
What could go wrong for Zoom?
- Other
Investment gains swing net income
Zoom's Anthropic preferred stock was carried at $3,134.5 million at Jul 31, 2026, 23.1% of total assets (Cityfort calculation from the Q2 FY2027 10-Q). The gains are unrealized: Zoom remeasured the stake on Anthropic's financing rounds announced Feb 12 and May 28, 2026. The 10-Q lists the value of strategic investments as a risk. Zoom also recorded $388.0 million of net unrealized gains on unnamed investments in Q3 FY2026.
Watch The gains or losses on strategic investments line in each earnings release, beside operating income.
- Governance
Founder voting control
Class B shares carry 10 votes each and held 52.0% of votes on Aug 14, 2026; Eric S. Yuan alone held 37.7% on Mar 31, 2026. Class B converts automatically 15 years after the April 2019 IPO closed, or earlier, for example six months after Yuan stops providing services to Zoom.
Watch Class B share counts on each 10-Q cover and the proxy's voting-power table.
- Demand
Slow growth and Online churn
Revenue grew 3.1% to 4.4% a year from FY2024 to FY2026. Online revenue grew 1.2% in FY2026, and Zoom's average monthly churn measure for Online was 2.9% in Q2 FY2027. Zoom's 10-K lists a fluctuating or declining growth rate among its risks.
Watch Online revenue growth and churn in each earnings release.
- Competition
Larger competitors
Zoom's 10-K names Microsoft 365 (Teams), Google Workspace (Meet) and Cisco Webex among its competitors and lists competition from larger rivals among its main risks.
Watch Enterprise revenue growth, 7.8% in Q2 FY2027, and the Enterprise net dollar expansion rate, 99%.
- Legal
DOJ investigation
Zoom received a grand jury subpoena from the US Attorney's Office for the Eastern District of New York in June 2020; its Q2 FY2027 10-Q says that investigation is ongoing.
Watch The legal note of each 10-Q and any 8-K.
- Execution
Research work in China
Zoom's 10-K says a significant portion of its research and development work is in China and lists operations outside the US among its risks.
Watch Changes to this risk factor in the next 10-K.
- Other
Stock-based pay
Stock-based pay was $760.8 million in FY2026, 15.6% of revenue, down from $1,285.8 million in FY2023. It is the largest item between GAAP and non-GAAPThe company's own "adjusted" numbers, not the official (GAAP) ones. Always read them next to the official figure. Learn more operating income.
Watch Stock-based pay in each quarter's cash flow statement; it was $179.8 million in Q2 FY2027.
Sources (8)
- Form 10-Q, Q2 fiscal 2027 (quarter ended Jul 31, 2026)
- Form 10-Q, Q1 fiscal 2027 (quarter ended Apr 30, 2026)
- Form 10-Q, Q3 fiscal 2026 (quarter ended Oct 31, 2025)
- 2026 proxy statement (DEF 14A)
- Form 10-K, fiscal year 2026 (ended Jan 31, 2026)
- Q4 and fiscal 2026 earnings release (8-K Ex. 99.1, Feb 25, 2026)
- Q2 fiscal 2027 earnings release (8-K Ex. 99.1, Aug 25, 2026)
- Form 10-K, fiscal year 2024 (ended Jan 31, 2024)
08Both sides
What do supporters and critics point to?
What supporters point to
- Free cash flow was $1,924.1 million in FY2026, 39.5% of revenue.
- Zoom had $7,249.7 million of cash and marketable securities and no borrowings at Jul 31, 2026.
- Enterprise revenue grew 7.8% in Q2 FY2027, and customers paying over $100,000 a year rose 8.2% to 4,625.
- Operating income rose from $5.6 per $100 of revenue in FY2023 to $23.1 in FY2026.
- Zoom repurchased $1,620.7 million of shares in FY2026; diluted shares fell from 315.1 million in FY2025 to 299.7 million in Q2 FY2027.
What critics point to
- Revenue grew 3.1% to 4.4% a year from FY2024 to FY2026, and Online revenue grew 1.2% in FY2026.
- Net income includes large unrealized gains: $969.8 million of strategic-investment gains in FY2026 and $1,612.7 million on the Anthropic stake in Q2 FY2027.
- Class B shares, mostly held by insiders, carried 52.0% of votes on Aug 14, 2026.
- Stock-based pay was $760.8 million in FY2026, 15.6% of revenue.
- Zoom received a grand jury subpoena from the US Attorney's Office for the Eastern District of New York in June 2020; its Q2 FY2027 10-Q says that investigation is ongoing.
09What to watch next
What should you watch next at Zoom?
Next event
Q3 FY2027 results
Date not announced yet.
Revenue against the company's Q3 FY2027 range
Zoom said on Aug 25, 2026 that it expects $1.275–1.280 billion. Q2 FY2027 revenue was $1,277.2 million.
Operating income beside investment gains
In Q2 FY2027 operating income was $314.3 million, while gains on strategic investments were $1,614.2 million. Zoom remeasured the Anthropic stake on Anthropic's financing round announced May 28, 2026.
Enterprise and Online growth
Enterprise revenue grew 7.8% and Online 0.6% in Q2 FY2027; Online average monthly churn was 2.9%.
Share repurchases
About $1.3 billion of the $4.7 billion authorization was left at Jul 31, 2026.
10Key dates
What are the key dates for Zoom?
| Event | Date | Source |
|---|---|---|
| Director Jonathan Chadwick retires from the boardAnnounced in an 8-K filed Sep 2, 2026. | Form 8-K, Items 5.02 and 7.01: Jeff Epstein joins board; Jonathan Chadwick to retire Nov 19, 2026 | |
| Fiscal 2027 endsThe Q3 FY2027 results date was not announced in the documents read. | Form 10-Q, Q2 fiscal 2027 (quarter ended Jul 31, 2026) | |
| Class B shares convert to Class AAutomatically on the 15th anniversary of the April 2019 IPO closing, or earlier on other triggers, per the FY2026 10-K. | Not yet stated | Form 10-K, fiscal year 2026 (ended Jan 31, 2026) |
Learn: What is an 8-K? A company's news report, with a real Adobe filing · Dual-class shares: when votes and ownership don't match · Fiscal years that don't end in December: Nvidia's FY2027 explained
11Key facts
Key facts about Zoom
- What does Zoom do?
- Zoom Communications, Inc. sells subscriptions to software for video meetings, cloud phone calls, team chat, webinars and customer-service contact centers, grouped as Zoom Workplace and Zoom Business Services. Zoom had revenue of $4,868.8 million in FY2026 (year ended Jan 31, 2026) and 7,438 full-time employees at that date.
- How does Zoom make money?
- Zoom makes money from monthly, annual and multiyear subscriptions to its software. In FY2026 Zoom earned $2,934.1 million from Enterprise customers, reached through its sales team and partners, and $1,934.7 million from Online customers, who sign up on its website.
- What is Zoom's business model?
- Zoom's business model is subscription software, sold on its website to self-serve customers and through sales teams and partners to larger organizations. Zoom kept $77.0 of gross profit per $100 of FY2026 revenue, and spent $28.5 per $100 on sales and marketing as shown in Zoom's FY2026 10-K.
- Is Zoom profitable?
- Yes. Zoom reported operating income of $1,123.6 million and net income of $1,900.1 million in FY2026; net income included $969.8 million of gains on strategic investments. In Q2 FY2027 (quarter ended Jul 31, 2026) Zoom's operating income was $314.3 million and net income $1,542.4 million, after a $1,612.7 million unrealized gain on its Anthropic stake.
- What is Zoom's revenue by segment?
- Zoom reports one segment. It splits revenue into two customer categories: Enterprise was 60.3% and Online 39.7% of FY2026 revenue. By billing address, the Americas were 72.1% of Zoom's FY2026 revenue, Europe, the Middle East and Africa 15.8% and Asia-Pacific 12.1%.
- How much does Zoom earn from Enterprise customers?
- Zoom earned $2,934.1 million from Enterprise customers in FY2026, up 6.5%, and $787.5 million in Q2 FY2027, up 7.8% from a year earlier. Enterprise customers are business units reached by Zoom's direct sales team, resellers or strategic partners.
- How much does Zoom earn from Online customers?
- Zoom earned $1,934.7 million from Online customers, who subscribe through its website, in FY2026, up 1.2%. Online revenue was $489.7 million in Q2 FY2027, up 0.6% from a year earlier.
- Who are Zoom's customers?
- Zoom's customers range from single paid users to Fortune 50 organizations, and no customer was more than 10% of Zoom's FY2026 revenue. Zoom had 4,625 customers paying it more than $100,000 over the 12 months to Jul 31, 2026; such customers made up 32.8% of FY2026 revenue.
- Who owns Zoom?
- Founder and CEO Eric S. Yuan held 37.7% of Zoom's total votes on Mar 31, 2026, mostly through Class B shares that carry 10 votes each, and Zoom's directors and executive officers as a group held 46.1%. Vanguard Capital Management reported 5.19% of Zoom's Class A shares as of Mar 31, 2026, and Vanguard Portfolio Management 5.08% as of Sep 30, 2026.
- Does Zoom own a stake in Anthropic?
- Yes. Zoom Communications holds preferred stock in Anthropic, PBC, carried at $3,134.5 million on Jul 31, 2026. Zoom recorded a $1,612.7 million unrealized gain on it in Q2 FY2027, based on a financing round Anthropic announced on May 28, 2026.
Sources (7)
- Form 10-K, fiscal year 2026 (ended Jan 31, 2026)
- Q4 and fiscal 2026 earnings release (8-K Ex. 99.1, Feb 25, 2026)
- Q2 fiscal 2027 earnings release (8-K Ex. 99.1, Aug 25, 2026)
- Form 10-Q, Q2 fiscal 2027 (quarter ended Jul 31, 2026)
- 2026 proxy statement (DEF 14A)
- Schedule 13G by Vanguard Capital Management (as of Mar 31, 2026)
- Schedule 13G/A by Vanguard Portfolio Management (as of Sep 30, 2026)
Terms on this page
- Capital expenditures (capex)
- Debt-to-equity
- Earnings per share (EPS)
- EBITDA
- Free cash flow
- Market cap
- Net debt
- Net margin
- Operating income
- P/E ratio
Each explains the term in plain English, with the same number from other companies on Cityfort.
Go deeper
More detail from the same filings. Open any section.
12What it sells
12What it sells
What does Zoom sell?
Zoom Meetings
Video meetings in a browser, app or meeting room, with up to 1,000 video participants.
Zoom Phone
A cloud phone system: businesses make and take calls over the internet instead of using office phone lines.
Team Chat, Docs, Whiteboard and Clips
Messaging, shared documents, digital whiteboards and short video recordings, sold with Meetings and Phone as Zoom Workplace.
Workvivo
An employee-experience platform, bought in April 2023 for $221.8 million in cash.
Contact Center
Software for customer-service teams that handle calls, chats and messages, part of Zoom Business Services.
Webinars and Events
Online events and webinars, for up to 1 million attendees with an expanded license.
AI Companion
An AI assistant across Zoom's products, launched in September 2023. It uses Zoom's own models plus third-party models, including from OpenAI, Anthropic and Meta.
What it does
- Does: Sells monthly, annual and multiyear subscriptions
- Does: Sells online, through its own sales teams by customer size, region and industry, and through resellers and other partners
- Does: Relies on free users upgrading to paid plans, as its 10-K risk factors describe
- Does: Hosts more than 3,100 apps from other developers in its App Marketplace
What it does not do
- Does not: Does not report revenue by product; it reports one segment
- Does not: Does not pay a dividend
- Does not: Has no borrowings
- Does not: Has not reported its Enterprise customer count since Q4 FY2025, when it was about 192,600
13How the money flows
13How the money flows · FY2026
How does money flow through Zoom?
Money in
- Enterprise customers$2.9B
- Online customers$1.9B
- Gains on strategic investments and other income (mostly interest)$1.3B
The company
Zoom
$6.2B came in
Money out
- Running the service (cost of revenue)$1.1B
- Sales and marketing$1.4B
- Research and development$845M
- General and administrative$393M
- Income tax$522M
- Net income$1.9B
- Enterprise and Online customers paid Zoom $4,868.8 million in FY2026.
- Running the service cost $1,119.0 million, leaving gross profit of $3,749.7 million.
- Sales and marketing took $1,388.3 million, research and development $844.9 million and general and administrative $392.9 million. That left operating income of $1,123.6 million.
- Gains on stakes in other companies ($969.8 million) and other income, mostly interest ($328.8 million), added $1,298.6 million.
- After $522.1 million of income tax, net income was $1,900.1 million.
14What it needs to run
14What it needs to run
What does Zoom need to run?
People
7,438 full-time employees at Jan 31, 2026 (3,457 in the US and 3,981 elsewhere), against 7,412 a year earlier and 8,484 at Jan 31, 2023.
Engineers, many in China
Research and development cost $844.9 million in FY2026. Zoom's 10-K says a significant portion of its research and development work is in China.
Data centers and cloud services
The service runs on data centers and cloud providers; Zoom's 10-K lists outages among its main risks. Cost of revenue was $1,119.0 million in FY2026.
AI models
Zoom uses its own small and large language models plus third-party models from OpenAI, Anthropic and Meta.
15Where it sells
15Where it sells · FY2026
Where does Zoom sell?
- Americas72%
- Europe, Middle East and Africa16%
- Asia-Pacific12%
16Competitors and what protects it
16Competitors and what protects it
Who does Zoom compete with?
Microsoft
NASDAQ: MSFT
Zoom's FY2026 10-K names Microsoft 365, which includes Teams, as a competitor.
Alphabet
NASDAQ: GOOGL
Zoom's FY2026 10-K names Google Workspace, which includes Google Meet, as a competitor.
Cisco
NASDAQ: CSCO
Zoom's FY2026 10-K names Cisco Webex as a competitor.
RingCentral
Named as a competitor in Zoom's FY2026 10-K, alongside Avaya and 8x8.
Five9
Named in Zoom's FY2026 10-K as a contact-center competitor, with Genesys and NICE inContact.
What protects the business
Each strength is scored 1 (weak) to 5 (strong) for the business, with the reason. It is not a rating of the share.
- Subscription contracts3 of 5
Remaining performance obligationsSigned contracts with customers that have not been billed yet., contracted revenue not yet recognized, were $4,535.9 million at Jul 31, 2026, 57% of it due within 12 months. No customer was more than 10% of FY2026 revenue.
- Larger customers3 of 5
4,625 customers paid Zoom more than $100,000 over the 12 months to Jul 31, 2026, up 8.2%, and such customers made up 32.8% of FY2026 revenue.
- Cash and no debt4 of 5
Zoom had $7,249.7 million of cash and marketable securities and no borrowings at Jul 31, 2026.
Weak spot
Slow-growing Online business
Online revenue grew 1.2% in FY2026 and 0.6% in Q2 FY2027, and Zoom's average monthly churn measure for Online was 2.9% in Q2 FY2027. Zoom's 10-K also lists competition from larger rivals among its main risks.
17Where growth could come from
17Where growth could come from
Where could Zoom's growth come from?
Zoom said on Aug 25, 2026 that it expects FY2027 revenue of $5.085–5.095 billion and Q3 FY2027 revenue of $1.275–1.280 billion. It also put FY2027 free cash flow at $1.780–1.820 billion, up from $1.700–1.740 billion in its May 21, 2026 outlook.
Enterprise customers
Working+7.8% in Q2 FY2027
Enterprise revenue was $787.5 million in Q2 FY2027, up 7.8%, which CEO Eric Yuan called "its strongest growth rate in three years". It grew 6.5% in FY2026.
Status: Working, on track against what the company said.
Customers paying over $100,000 a year
Working4,625, +8.2%
4,625 customers paid more than $100,000 over the 12 months to Jul 31, 2026, against 2,725 at Jan 31, 2022.
Status: Working, on track against what the company said.
Online (website) customers
Mixed+0.6% in Q2 FY2027
Online revenue was $489.7 million in Q2 FY2027. It fell 0.4% in Q4 FY2025 and 1.2% in Q1 FY2026, then grew in each of the next five quarters.
Status: Mixed, partly on track.
Acquisitions
New$266.8M for Common Room
Zoom bought Common Room, AI software for sales and marketing teams, on Jul 17, 2026 for $266.8 million in cash, and BrightHire, AI software for job interviews, on Dec 1, 2025 for $98.0 million.
Status: New, recently announced.
Status compares progress with what the company itself said it would do: Working = on track against what the company said; Mixed = partly on track; Behind = behind the company's own plan; New = recently announced; Early = too early to judge.
Sources (10)
- Q2 fiscal 2027 earnings release (8-K Ex. 99.1, Aug 25, 2026)
- Q1 fiscal 2027 earnings release (8-K Ex. 99.1, May 21, 2026)
- Q4 and fiscal 2026 earnings release (8-K Ex. 99.1, Feb 25, 2026)
- Form 10-K, fiscal year 2026 (ended Jan 31, 2026)
- Form 10-K, fiscal year 2024 (ended Jan 31, 2024)
- Q4 and fiscal 2025 earnings release (8-K Ex. 99.1, Feb 24, 2025)
- Q1 fiscal 2026 earnings release (8-K Ex. 99.1, May 21, 2025)
- Q2 fiscal 2026 earnings release (8-K Ex. 99.1, Aug 21, 2025)
- Q3 fiscal 2026 earnings release (8-K Ex. 99.1, Nov 24, 2025)
- Form 10-Q, Q2 fiscal 2027 (quarter ended Jul 31, 2026)
18The company's own measures (non-GAAP)
18The company's own measures · FY2026 and Q2 FY2027
What do Zoom's own measures show?
Official (GAAP): Income from operations, Q2 FY2027
$314M
Company's own measure: Non-GAAP income from operations, Q2 FY2027
$510M
Zoom leaves out stock-based pay and related payroll taxes ($179.8 million of stock-based pay in the quarter), acquisition-related expenses and litigation settlements, net.
Official (GAAP): Income from operations, FY2026
$1.1B
Company's own measure: Non-GAAP income from operations, FY2026
$2.0B
Leaves out the same costs, plus a charitable donation of stock and an impairment in FY2026.
Official (GAAP): Diluted EPS, Q2 FY2027
$5.15
Company's own measure: Non-GAAP diluted EPS, Q2 FY2027
$1.55
Also leaves out gains and losses on strategic investments and their tax effects, including the $1,612.7 million Anthropic gain, so it was below GAAP EPS in this quarter.
Official (GAAP): Net cash from operating activities, FY2026
$2.0B
Company's own measure: Free cash flow (company measure), FY2026
$1.9B
Cash from operations minus purchases of property and equipment, the same definition this page uses.
Official (GAAP): Revenue growth, Q2 FY2027
4.9%
Company's own measure: Enterprise net dollar expansion rate (trailing 12 months), Jul 31, 2026
99%
Zoom's own measure of how spending by existing Enterprise customers changed over 12 months. It was 98% at Jan 31, 2026 and 130% at Jan 31, 2022.
Official (GAAP): Revenue growth, Q2 FY2027
4.9%
Company's own measure: Online average monthly churn, Q2 FY2027
2.9%
Zoom's own measure of average monthly churn in its Online business. 75.6% of Online monthly recurring revenue came from customers subscribed for 16 months or more.
Official (GAAP)
No official figure measures this; it is the company's own operating measure.
Company's own measure: Customers paying over $100,000 (trailing 12 months), Jul 31, 2026
4,625 customers
Customers that paid Zoom more than $100,000 over the previous 12 months, up 8.2% from a year earlier. Such customers made up 32.8% of FY2026 revenue.
These are the company's own measures, defined by the company. They are not comparable across companies, and they are not added together. Each sits beside the nearest official (GAAP) figure.
Learn: Non-GAAP measures: what a company's "adjusted" numbers leave out · Stock-based compensation and dilution: pay that becomes shares
19Financial strength and debt
19Financial strength · Jul 31, 2026
How much debt does Zoom have?
- Total debt$0M
- Cash and investments$7.2B
- Net cash (cash minus debt)$7.2B
- Net worth (shareholders' money)$11.3B
- Debt to equity
- 0×
- $ of debt for every $1 of shareholders' money
- Net cash of $7,249.7 million is a Cityfort calculation from the Q2 FY2027 10-Q (cash, cash equivalents and marketable securities minus borrowings, which were zero). Zoom states its cash and marketable securities as $7.2 billion. At Jan 31, 2026 the figure was $7,816.9 million (Cityfort calculation from the FY2026 10-K).
- Strategic investments of $3,785.9 million, including the Anthropic preferred stock carried at $3,134.5 million, are not counted as cash here.
- Deferred revenue, money billed but not yet earned, was $1,549.4 million due within a year at Jul 31, 2026.
- Zoom's liquidity section names no credit facility. Operating lease liabilities are not counted as debt here.
- Zoom had no borrowings at any year-end from FY2022 to FY2026.
20Who owns it
20Who owns it · ownership as of Mar 31, 2026
Who owns Zoom?
- Officers and directors (as a group), votes
- 46.1%
Shares vs votes by class
Zoom has more than one class of shares, and the classes carry different votes. The share of votes a class holds can differ a lot from its share of the shares.
- Class A common stock: share of all votes48.0%
- Class B common stock: share of all votes52.0%
Each class's part of all votes = its shares outstanding × votes per share ÷ the total for all classes.
Share classes
Holders of 5% or more
From the company's proxy statement (DEF 14A), later Schedule 13G filings and the share counts on its latest annual or quarterly report. Each holder row shows the date of its own filing.
Insider trades · Form 4 data as of Nov 6, 2026
What did Zoom's insiders report trading?
Zoom's insiders made 68 Form 4A filing an insider must make within two business days of buying or selling the company's shares. Learn more filings in the 12 months to Nov 6, 2026.
They reported no purchases and 184 sales (974,264 shares) in the open market or privately (codes P and S).
184 of the 184 sales were on forms with the Rule 10b5-1 plan box checked.
The same filings report 83 other share transactions (M: 31, C: 27, F: 25).
They also report 79 transactions in options, stock units or other derivatives.
Insiders are a company's officers, directors and owners of more than 10% of a class of its shares. Most changes in their holdings must be reported to the SEC on a Form 4 within two business days. Source: SEC Form 4 filings on EDGAR.
- P
- a purchase in the open market or privately
- S
- a sale in the open market or privately
- F
- shares withheld or handed over to pay an exercise price or tax when an award is received, exercised or vests
- M
- exercise or conversion of an option or other derivative, exempt under Rule 16b-3
- C
- conversion of a derivative security
Code meanings: General Instruction 8 of Form 4 (SEC).
The latest 25 of 267 transactions
Shares: A = acquired, D = disposed of. A price the filing gives only in a footnote shows as “See filing”. The 10b5-1 box is checked when at least one trade on the form was made under a Rule 10b5-1 plan. A Form 4/A replaces the form it amends. See all of Zoom's Form 4 filings on EDGAR.
Learn: Dual-class shares: when votes and ownership don't match · How to read a proxy statement (DEF 14A): Nvidia's 2026 proxy · Form 4 insider filings: who files, the codes and the footnotes · Rule 10b5-1 trading plans: how insiders pre-schedule their trades
21What it does with profit
21What it does with profit
What does Zoom do with its profit?
Buyback · Jan 31, 2023
Repurchased $1,000.0 million of shares in FY2023.
$1.0B
Buyback · Jan 31, 2025
Repurchased $1,093.9 million of shares in FY2025, about 15.9 million shares.
$1.1B
Buyback · Jan 31, 2026
Repurchased $1,620.7 million of shares in FY2026, about 20.4 million shares.
$1.6B
Buyback · Jul 31, 2026
The board has authorized $4.7 billion of repurchases since February 2024, with no expiration date: $1.5 billion in February 2024, then $1.2 billion in November 2024, $1.0 billion in November 2025 and $1.0 billion in May 2026. Zoom had bought back 44.2 million shares under the program by Jul 31, 2026, with about $1.3 billion left.
Sources (6)
- Form 10-K, fiscal year 2024 (ended Jan 31, 2024)
- Form 10-K, fiscal year 2026 (ended Jan 31, 2026)
- Q4 and fiscal 2025 earnings release (8-K Ex. 99.1, Feb 24, 2025)
- Q4 and fiscal 2026 earnings release (8-K Ex. 99.1, Feb 25, 2026)
- Form 10-Q, Q2 fiscal 2027 (quarter ended Jul 31, 2026)
- Q2 fiscal 2027 earnings release (8-K Ex. 99.1, Aug 25, 2026)
22Governance signals
22Governance signals
What do Zoom's governance filings show?
- Auditor
- KPMG LLP
- Auditor changes
- None in the period covered
- Audit qualifications
- None reported
- Related-party dealings
- Zoom's 2026 proxy statement describes three related-person arrangements. An investors' rights agreement gives some holders, including Eric S. Yuan, Puccini World Limited and entities affiliated with Emergence Capital, the right to have their shares included in a registration statement. In August 2021 Zoom made a $1.0 million gift, payable over five years from Feb 1, 2022, to the Center for Security in Politics at the University of California, Berkeley, founded and directed by Janet Napolitano, a Zoom director for part of FY2026. Robert Fenger, son of director Michael Fenger, has worked at Zoom since 2020 and received about $219,118 in total pay, including equity, for FY2026. KPMG's audit fees for FY2026 were $5,796,633.
- Credit rating
- No public credit rating found in a search of rating agency sites on Nov 6, 2026
Flags to know about
regulatory
DOJ investigation continues
Zoom received a grand jury subpoena from the US Attorney's Office for the Eastern District of New York in June 2020; its Q2 FY2027 10-Q says that investigation is ongoing. The 10-Q says the SEC informed Zoom on Jul 30, 2025 that its investigation had concluded and it did not intend to recommend an enforcement action, after which Zoom reversed an $18.0 million accrual, and that the US Attorney's Office for the Northern District of California informed Zoom on Aug 17, 2026 that its investigation had concluded and it did not intend to take any further action.
other
Founder voting control
Class B shares, with 10 votes each, held 52.0% of votes on Aug 14, 2026. Eric S. Yuan held 37.7% of votes and directors and executive officers 46.1% on Mar 31, 2026.
other
Leadership changes in 2026
Chief operating officer Aparna Bawa resigned effective May 8, 2026, and director William McDermott resigned on Jul 27, 2026. Jeff Epstein joined the board on Aug 31, 2026, and director Jonathan Chadwick is to retire on Nov 19, 2026.
Sources (6)
- 2026 proxy statement (DEF 14A)
- Form 10-K, fiscal year 2026 (ended Jan 31, 2026)
- Form 10-Q, Q2 fiscal 2027 (quarter ended Jul 31, 2026)
- Form 8-K, Item 5.02: COO Aparna Bawa to resign effective May 8, 2026
- Form 8-K, Item 5.02: director William McDermott resigns (Jul 27, 2026)
- Form 8-K, Items 5.02 and 7.01: Jeff Epstein joins board; Jonathan Chadwick to retire Nov 19, 2026
23What the market paid
23What the market paid · price as of Nov 5, 2026
What did the market pay for Zoom on Nov 5, 2026?
Price as of Nov 5, 2026 (shown for education; prices change daily).
Price as of Nov 5, 2026: Zoom's Class A shares closed at $88.82 on Nasdaq. Times 291.8 million Class A and Class B shares (Aug 14, 2026), that is a market value of about $25.9 billion (Cityfort calculation from the Nov 5, 2026 Nasdaq closing price and the Q2 FY2027 10-Q cover); Class B shares are not listed but convert one-for-one into Class A. P/E, the price divided by diluted earnings per share over the four quarters to Jul 31, 2026 ($10.80), was 8.2 (Cityfort calculation from the Nov 5, 2026 Nasdaq closing price and the Q3 FY2026 to Q2 FY2027 earnings releases). Those earnings include $2,704.9 million of pre-tax gains on strategic investments, among them the $1,612.7 million Anthropic gain in Q2 FY2027.
- Share price
- $88.82
- Market value (market cap)
- $25.9B
- P/E
- 8.2×
More price-based ratios · as of Nov 5, 2026
Each ratio divides a number from the company's filings by the market value or share price on Nov 5, 2026. Prices change daily, so these ratios do too.
Price to sales (P/S)
5.2×
$25.9B market value ÷ $5.0B revenue (four quarters to Jul 31, 2026) = 5.2×
Cityfort calculation from the Nov 5, 2026 closing price and the Q3 FY2026 to Q2 FY2027 10-Qs and earnings releases. Source: ZM historical quotes, Nasdaq, Oct 20 to Nov 5, 2026 (close Nov 5, 2026: $88.82); Form 10-Q, Q2 fiscal 2027 (quarter ended Jul 31, 2026); Q3 fiscal 2026 earnings release (8-K Ex. 99.1, Nov 24, 2025) and 3 more
How price ratios workFree cash flow yield
7.4%
$1.9B free cash flow (FY2026) ÷ $25.9B market value = 7.4%
Cityfort calculation from the FY2026 10-K and the Nov 5, 2026 closing price. Source: ZM historical quotes, Nasdaq, Oct 20 to Nov 5, 2026 (close Nov 5, 2026: $88.82); Form 10-Q, Q2 fiscal 2027 (quarter ended Jul 31, 2026); Q3 fiscal 2026 earnings release (8-K Ex. 99.1, Nov 24, 2025) and 4 more
What free cash flow means
Shares used for the market value: 291.78 million ($88.82 × 291.78 million shares ≈ $25.9B). Source: Form 10-Q, Q2 fiscal 2027 (quarter ended Jul 31, 2026); 2026 proxy statement (DEF 14A)
Source: ZM historical quotes, Nasdaq, Oct 20 to Nov 5, 2026 (close Nov 5, 2026: $88.82); Form 10-Q, Q2 fiscal 2027 (quarter ended Jul 31, 2026); Q3 fiscal 2026 earnings release (8-K Ex. 99.1, Nov 24, 2025) and 3 more
Sources (8)
- ZM historical quotes, Nasdaq, Oct 20 to Nov 5, 2026 (close Nov 5, 2026: $88.82)
- Form 10-Q, Q2 fiscal 2027 (quarter ended Jul 31, 2026)
- Q3 fiscal 2026 earnings release (8-K Ex. 99.1, Nov 24, 2025)
- Q4 and fiscal 2026 earnings release (8-K Ex. 99.1, Feb 25, 2026)
- Q1 fiscal 2027 earnings release (8-K Ex. 99.1, May 21, 2026)
- Q2 fiscal 2027 earnings release (8-K Ex. 99.1, Aug 25, 2026)
- Form 10-K, fiscal year 2026 (ended Jan 31, 2026)
- 2026 proxy statement (DEF 14A)
24How it got here
24How it got here
How did Zoom get here?
2011
Milestone
Founded
Incorporated in Delaware in April 2011 as Saasbee, Inc.; Eric S. Yuan has been CEO since June 2011. It became Zoom Video Communications in 2012.
2019
Milestone
Listed on Nasdaq
Zoom's IPO was in April 2019; its Class A shares trade on the Nasdaq Global Select Market.
2020
Crisis
DOJ subpoena
Zoom received a subpoena from the Department of Justice in June 2020; the Eastern District of New York investigation continues.
2023
Crisis
About 15% of staff cut
In February 2023 Zoom announced a restructuring that cut about 15% of its workforce. Operating income was $5.6 per $100 of revenue in FY2023.
2023
Business-model change
Workvivo and AI Companion
Zoom bought Workvivo for $221.8 million in April 2023 and launched AI Companion in September 2023, widening beyond meetings.
2024
Business-model change
Renamed Zoom Communications
The company changed its name from Zoom Video Communications, Inc. to Zoom Communications, Inc. in November 2024.
2025
Milestone
SEC investigation concluded
The SEC informed Zoom on Jul 30, 2025 that its investigation had concluded and it did not intend to recommend an enforcement action; Zoom reversed an $18.0 million accrual.
2026
Milestone
Anthropic stake named
Zoom first named Anthropic as an investee in its Q1 FY2027 10-Q, with the stake carried at $1,266.9 million on Apr 30, 2026; a $1,612.7 million unrealized gain followed in Q2 FY2027.
Sources (6)
- Form 10-K, fiscal year 2026 (ended Jan 31, 2026)
- 2026 proxy statement (DEF 14A)
- Form 10-Q, Q2 fiscal 2027 (quarter ended Jul 31, 2026)
- Form 10-K, fiscal year 2024 (ended Jan 31, 2024)
- Form 8-K, Items 2.02 and 5.03: name change to Zoom Communications, Inc. (Nov 2024)
- Form 10-Q, Q1 fiscal 2027 (quarter ended Apr 30, 2026)
25Sources and changes
Where every number on this page comes from
Sources (24 documents)
- S1Form 10-K, fiscal year 2026 (ended Jan 31, 2026) · Zoom Communications, Inc. (SEC EDGAR) · Tier 1: company or exchange filing · Feb 27, 2026
- S2Form 10-K, fiscal year 2025 (ended Jan 31, 2025) · Zoom Communications, Inc. (SEC EDGAR) · Tier 1: company or exchange filing · Feb 28, 2025
- S3Form 10-K, fiscal year 2024 (ended Jan 31, 2024) · Zoom Communications, Inc. (SEC EDGAR) · Tier 1: company or exchange filing · Mar 4, 2024
- S4Form 10-K, fiscal year 2023 (ended Jan 31, 2023) · Zoom Communications, Inc. (SEC EDGAR) · Tier 1: company or exchange filing · Mar 3, 2023
- S5Form 10-Q, Q2 fiscal 2027 (quarter ended Jul 31, 2026) · Zoom Communications, Inc. (SEC EDGAR) · Tier 1: company or exchange filing · Aug 26, 2026
- S6Form 10-Q, Q1 fiscal 2027 (quarter ended Apr 30, 2026) · Zoom Communications, Inc. (SEC EDGAR) · Tier 1: company or exchange filing · May 22, 2026
- S7Form 10-Q, Q3 fiscal 2026 (quarter ended Oct 31, 2025) · Zoom Communications, Inc. (SEC EDGAR) · Tier 1: company or exchange filing · Nov 25, 2025
- S8Q2 fiscal 2027 earnings release (8-K Ex. 99.1, Aug 25, 2026) · Zoom Communications, Inc. (SEC EDGAR) · Tier 1: company or exchange filing · Aug 25, 2026
- S9Q1 fiscal 2027 earnings release (8-K Ex. 99.1, May 21, 2026) · Zoom Communications, Inc. (SEC EDGAR) · Tier 1: company or exchange filing · May 21, 2026
- S10Q4 and fiscal 2026 earnings release (8-K Ex. 99.1, Feb 25, 2026) · Zoom Communications, Inc. (SEC EDGAR) · Tier 1: company or exchange filing · Feb 25, 2026
- S11Q3 fiscal 2026 earnings release (8-K Ex. 99.1, Nov 24, 2025) · Zoom Communications, Inc. (SEC EDGAR) · Tier 1: company or exchange filing · Nov 24, 2025
- S12Q2 fiscal 2026 earnings release (8-K Ex. 99.1, Aug 21, 2025) · Zoom Communications, Inc. (SEC EDGAR) · Tier 1: company or exchange filing · Aug 21, 2025
- S13Q1 fiscal 2026 earnings release (8-K Ex. 99.1, May 21, 2025) · Zoom Communications, Inc. (SEC EDGAR) · Tier 1: company or exchange filing · May 21, 2025
- S14Q4 and fiscal 2025 earnings release (8-K Ex. 99.1, Feb 24, 2025) · Zoom Communications, Inc. (SEC EDGAR) · Tier 1: company or exchange filing · Feb 24, 2025
- S15Q3 fiscal 2025 earnings release (8-K Ex. 99.1, Nov 25, 2024) · Zoom Communications, Inc. (SEC EDGAR) · Tier 1: company or exchange filing · Nov 25, 2024
- S162026 proxy statement (DEF 14A) · Zoom Communications, Inc. (SEC EDGAR) · Tier 1: company or exchange filing · Apr 30, 2026
- S17Schedule 13G/A by Vanguard Portfolio Management (as of Sep 30, 2026) · Vanguard Portfolio Management (SEC EDGAR) · Tier 1: company or exchange filing · Oct 30, 2026
- S18Schedule 13G by Vanguard Capital Management (as of Mar 31, 2026) · Vanguard Capital Management (SEC EDGAR) · Tier 1: company or exchange filing · Apr 30, 2026
- S19Schedule 13G/A by The Vanguard Group (0% after internal realignment, event Mar 13, 2026) · The Vanguard Group (SEC EDGAR) · Tier 1: company or exchange filing · Mar 27, 2026
- S20Form 8-K, Items 5.02 and 7.01: Jeff Epstein joins board; Jonathan Chadwick to retire Nov 19, 2026 · Zoom Communications, Inc. (SEC EDGAR) · Tier 1: company or exchange filing · Sep 2, 2026
- S21Form 8-K, Item 5.02: director William McDermott resigns (Jul 27, 2026) · Zoom Communications, Inc. (SEC EDGAR) · Tier 1: company or exchange filing · Jul 28, 2026
- S22Form 8-K, Item 5.02: COO Aparna Bawa to resign effective May 8, 2026 · Zoom Communications, Inc. (SEC EDGAR) · Tier 1: company or exchange filing · Apr 2, 2026
- S23Form 8-K, Items 2.02 and 5.03: name change to Zoom Communications, Inc. (Nov 2024) · Zoom Communications, Inc. (SEC EDGAR) · Tier 1: company or exchange filing · Nov 25, 2024
- S24ZM historical quotes, Nasdaq, Oct 20 to Nov 5, 2026 (close Nov 5, 2026: $88.82) · Nasdaq, Inc. · Tier 1: company or exchange filing · Nov 5, 2026
Changes to this page (v1 · Nov 6, 2026)
- v1 · Nov 6, 2026First version, through Q2 FY2027 (quarter ended Jul 31, 2026). (first version)
Numbers come only from tier 1 and tier 2 sources. Read how we research.
Disclaimer
For learning only. Cityfort is not a registered investment adviser or broker-dealer and does not recommend buying or selling any security. Prices shown are dated and may be out of date.
Investing in securities involves risk, including loss of capital. Before making any investment decision, do your own research and consider consulting a registered investment adviser or other qualified professional.
Cityfort, its owners and contributors may or may not hold securities of companies covered. Cityfort is not paid by any company it covers. Content is not an offer or solicitation to buy or sell any security, including in any initial public offering.
Read the positions policyRead the full disclaimerHide the full disclaimer
Cityfort publishes general educational content that explains how listed companies work. Cityfort is not registered with the US Securities and Exchange Commission or any state securities regulator as an investment adviser, and is not a broker-dealer or a member of FINRA. Cityfort does not provide investment, tax or legal advice, recommendations, ratings, price targets or any opinion on whether to buy, sell or hold any security. Nothing on the site is tailored to any person's circumstances.
All information is taken from publicly available sources, mainly company filings with the SEC, which are listed on each page with dates. We work to keep it accurate and correct errors publicly, but we do not guarantee that it is complete, accurate or up to date. Any market price or price-based ratio shown is dated, may be out of date by the time you read it, and is included only to explain concepts.
Statements by company management, including forward-looking statements and guidance, are reported as the company's statements, with their date and source; they are not our forecasts. Adjusted (non-GAAP) figures are the company's own measures and are shown next to the official (GAAP) figures.