Technology · NASDAQ: WDAY
Workday: how the business works
Workday sells subscriptions to cloud software that organizations use to hire, pay and manage their people and run their finances, with revenue of $9.6 billion in FY2026.
By Hardik Bhandare · Checked against filings: . Editorial policy. Corrections
Follow Workday
Email me when Workday's page is updated after earnings.
We'll send a confirmation email first. See our privacy policy.
Workday, Inc. · Pleasanton, California · Founded 2005
Updated for Q2 FY2027 · checked
- Revenue, FY2026
- $9.6B
- Operating income, FY2026
- $721M
- Net income, FY2026
- $693M
- Subscriptions, share of FY2026 revenue
- 92.5%
- Employees, Jan 31, 2026
- 21,070
The short version
Workday in 5 points
1 · What it sells
Workday sells subscriptions to cloud software that organizations use to hire, pay and manage employees and run their finances, with revenue of $9.6 billion in FY2026.
2 · Who pays it
In FY2026, subscriptions to Workday's cloud applications brought in 92.5% of revenue and professional services, such as setup and training, 7.5%.
3 · What it keeps from $100
Of every $100 that came in during FY2026, Workday kept $7.0 as net income, which includes $288 million of other income, and operating income was $7.55 per $100 of revenue.
4 · Where the operating profit comes from
Workday reports one operating segment, but subscriptions kept $82.7 of every $100 after the direct cost of running the service, while professional services cost $790 million against $719 million of revenue in FY2026.
5 · The one thing to watch
Workday's total subscription revenue backlog grew 8.0% at Jul 31, 2026, against 20.9% at Jul 31, 2024, while subscription revenue grew 13.9% in Q2 FY2027.
Sources: From Workday's FY2026 10-K, Q2 FY2027 10-Q and Q2 FY2024 to Q2 FY2027 earnings releases · checked
See the full receipt and the management scorecard below
01Where the money goes · FY2026
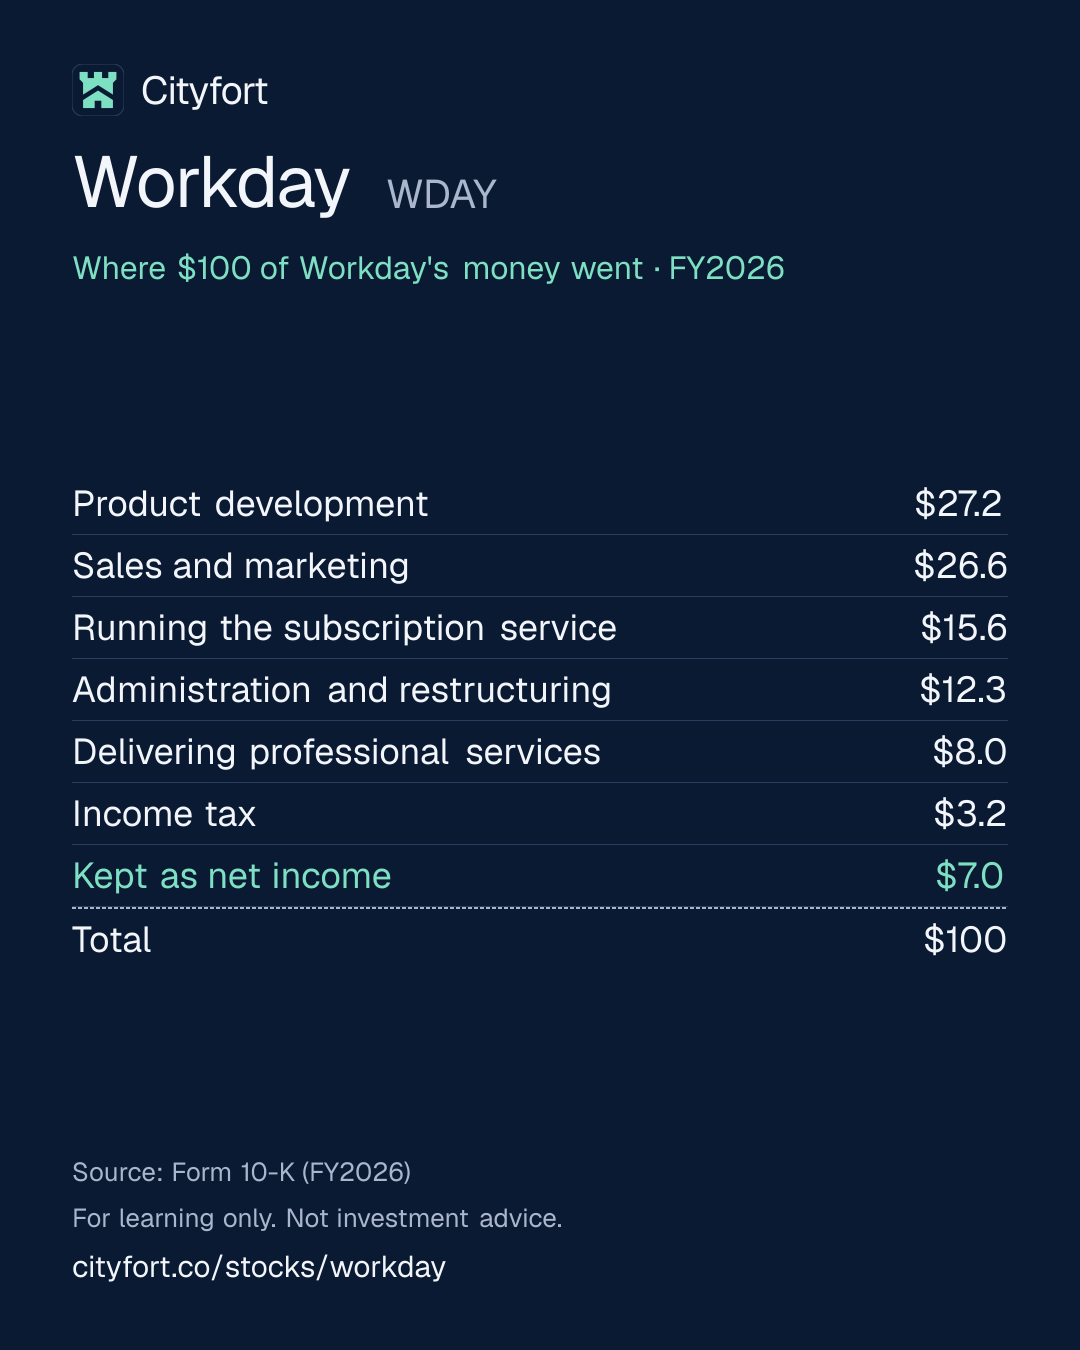
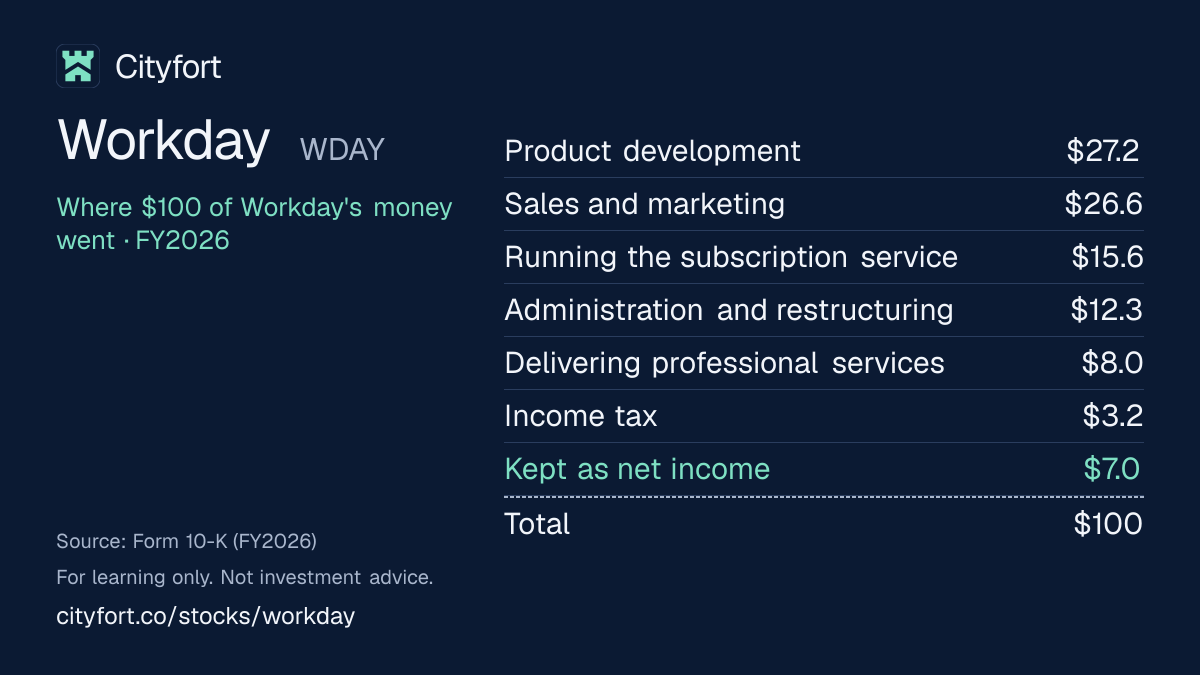
Where does $100 of Workday's money go?
Workday · FY2026
Receipt for every $100
| Product development | $27.2 |
|---|---|
| Sales and marketing | $26.6 |
| Running the subscription service | $15.6 |
| Administration and restructuring | $12.3 |
| Delivering professional services | $8.0 |
| Income tax | $3.2 |
| Kept as net income | $7.0 |
| Total | $100 |
Each line = amount ÷ total money in × 100. Lines may not add to exactly $100 because of rounding.
How this is worked out
Cityfort calculation from the FY2026 10-K. Of every $100 that came in during FY2026 (revenue plus other income, net): each line = line ÷ $9.84 billion × 100. Stock-based compensation of $1.6 billion sits inside the cost lines. Operating income was $7.55 per $100 of revenue; restructuring took $3.17.
Save this receipt as an image:
1080 × 1350 PNG for Instagram, LinkedIn1200 × 675 PNG for X
Embed this receipt
Paste this code into a blog or website to show the receipt, with a link back to this page:
Each week: one company explained in 5 points, picked by earnings date.
Free, no tips, unsubscribe anytime.
We'll send a confirmation email. See our privacy policy.
02The business in one line
What does Workday do?
Organizations pay Workday yearly subscription fees for its HR and finance software; the biggest costs are product development and sales and marketing, and what's left is profit.
- Subscriptions were 92.5% of Workday's $9.6 billion of revenue in FY2026, the year ended Jan 31, 2026. Contracts usually run three years or longer and are generally invoiced yearly in advance.
- Of every $100 that came in during FY2026, $27.2 went on product development, $26.6 on sales and marketing and $15.6 on running the subscription service. Workday kept $7.0 as net income.
03Who pays it
Who pays Workday?
Subscribers to Workday's cloud applications
93%
of revenue
Organizations paying for access to HR, finance, spend, planning and AI software, with support: $8,833 million, 92.5% of FY2026 revenue, up 14.4%.
Buyers of professional services
8%
of revenue
Consulting to set up and optimize the software, and training: $719 million, 7.5% of FY2026 revenue, down from $728 million in FY2025.
- Subscribers to Workday's cloud applications93%
- Buyers of professional services8%
How spread out the customers are
Workday's FY2026 10-K says no customer individually accounted for more than 10% of total revenues in FY2026, FY2025 or FY2024. Customers in the United States paid 75.1% of FY2026 revenue, and no other country was more than 10%.
04Why it makes money
Why does Workday make money?
Customers stay for years, so profit depends on how fast spending on products and selling grows next to subscription revenue.
Subscriptions kept $82.7 of every $100 of subscription revenue after the direct cost of running the service in FY2026. Product development fell from $36.6 to $28.0 per $100 of revenue between FY2022 and FY2026. Operating income went from a loss of $2.26 to a profit of $7.55 per $100.
Operating income per $100 of revenue
−$2.3$7.6
FY2022 to FY2026
- Organizations sign subscriptions of three years or longer, generally paid yearly in advance
- More new and renewal contracts are signed in Q4 than in any other quarter
- Running the service costs about $17 per $100 of subscription revenue
- Product development and sales and marketing take about $55 per $100 of revenue
- Workday reports keeping 97% of recurring revenue from existing customers
- What's left pays for buybacks and acquisitions
↺ Step 6 feeds back into step 1.
05Business segments · FY2026
Which businesses make up Workday?
Subscription services
93%Access to Workday's cloud applications with support. After the direct cost of running the service, it kept $82.7 of every $100 in FY2026 (Cityfort calculation from the FY2026 10-K). Workday has one operating segment and reports no profit by product.
Revenue $8.8B
Professional services
8%Consulting and training. Its direct costs were higher than its revenue in every year from FY2022 to FY2026: $790 million against $719 million in FY2026.
Revenue $719M
How the mix changed
- Subscription services
- Professional services
Revenue by segment, FY2022 to FY2026.
US$
See the numbers
06The numbers · Consolidated · US$
How has Workday done?
Revenue
$9.6BFY2026
Revenue grew every year, from $5.1 billion in FY2022 to $9.6 billion in FY2026, and was $2.6 billion in Q2 FY2027, up 12.8% from a year earlier.
US$
See the numbers
Net profit
$693MFY2026
Workday lost $367 million in FY2023; FY2024's $1.4 billion includes a $1,025 million tax benefit, and Q2 FY2027's $632 million includes a $374 million tax benefit.
US$
See the numbers
Profit kept per $100 of revenue
$7.3FY2026
Operating income was $7.55 per $100 of revenue in FY2026, up from a $2.26 loss in FY2022; stock-based compensation of $1.6 billion was 17.0% of FY2026 revenue and 235% of net income.
$ of profit per $100 of revenue (net margin)
See the numbers
Free cash flow
$2.8BFY2026
Free cash flow rose from $1.2 billion in FY2022 to $2.8 billion in FY2026, and Q4 was the largest cash quarter of FY2026, the quarter when Workday signs the most new and renewal contracts.
US$ · cash from operations minus spending on plants and equipment
See the numbers
See all yearly numbers
EBITDA here = operating income plus depreciation and amortization (from the cash flow statement). Fiscal years are the company's own (January 31; FY2026 is the year ended Jan 31, 2026). Net profit is the share belonging to the company's owners.
Download Workday's yearly and quarterly numbers (CSV, with source ids)
Learn: Fiscal years that don't end in December: Nvidia's FY2027 explained · Stock-based compensation and dilution: pay that becomes shares
Sources (13)
- Form 10-K, fiscal 2024 (year ended Jan 31, 2024)
- Form 10-K, fiscal 2026 (year ended Jan 31, 2026)
- Earnings release, Q2 fiscal 2025 (8-K Ex. 99.1)
- Earnings release, Q3 fiscal 2025 (8-K Ex. 99.1)
- Earnings release, Q4 and full fiscal 2025 (8-K Ex. 99.1)
- Earnings release, Q1 fiscal 2026 (8-K Ex. 99.1)
- Earnings release, Q2 fiscal 2026 (8-K Ex. 99.1)
- Earnings release, Q3 fiscal 2026 (8-K Ex. 99.1)
- Earnings release, Q4 and full fiscal 2026 (8-K Ex. 99.1)
- Earnings release, Q1 fiscal 2027 (8-K Ex. 99.1)
- Form 10-Q, Q1 fiscal 2027 (quarter ended Apr 30, 2026)
- Earnings release, Q2 fiscal 2027 (8-K Ex. 99.1)
- Form 10-Q, Q2 fiscal 2027 (quarter ended Jul 31, 2026)
07Who runs it
Who runs Workday, and did they deliver?
Aneel Bhusri
Co-founder, CEO and chair · since 2026
Returned as CEO on Feb 6, 2026, replacing Carl Eschenbach; he was co-CEO from August 2020 to January 2024. His Mar 5, 2026 awards had grant values of $60 million in restricted stock units and $75 million in performance units tied to share-price levels of $171.39 to $274.22.
Zane Rowe
Chief Financial Officer · since 2023
Joined in June 2023. FY2026 total pay was $11.15 million.
Gerrit Kazmaier
President, Product and Technology · since 2025
Joined in March 2025 from Google Cloud. FY2026 total pay was $28.39 million.
Robert Enslin
President, Chief Commercial Officer · since 2024
Joined in December 2024; earlier CEO of UiPath and President, Cloud Sales at Google.
Mark Hawkins
Lead independent director and vice chair
Chairs the audit committee.
What they said, and what happened
5 delivered · 1 too early to tell
Said on Nov 25, 2025
Workday targeted Q4 FY2026 subscription revenue of $2.355 billion and FY2026 subscription revenue of $8.828 billion.
DeliveredWhat happened
Reported $2.360 billion for Q4 and $8.833 billion for the year.
Said on Nov 25, 2025
Workday targeted 12-month subscription backlog (cRPO) growth of 15–16% for Q4 FY2026.
DeliveredWhat happened
Reported growth of 15.8%.
Said on Nov 25, 2025
Workday said it planned to repurchase an additional $3.6 billion of shares through the end of FY2027.
DeliveredWhat happened
Cash paid for buybacks was $4.43 billion from Q4 FY2026 to Q2 FY2027 (Cityfort calculation from the Q4 FY2026, Q1 FY2027 and Q2 FY2027 earnings releases).
Said on Feb 24, 2026
Workday targeted Q1 FY2027 subscription revenue of $2.335 billion, up 13%.
DeliveredWhat happened
Reported $2.354 billion, up 14.3%.
Said on May 21, 2026
Workday targeted Q2 FY2027 subscription revenue of $2.455 billion, up 13%.
DeliveredWhat happened
Reported $2.471 billion, up 13.9%.
Said on Feb 24, 2026
Workday targeted FY2027 subscription revenue of $9.925–9.950 billion, up 12–13%.
Too early to tellWhat happened
Narrowed to $9.940–9.950 billion on Aug 27, 2026. FY2027 ends Jan 31, 2027.
Sources (7)
- Form 8-K (Items 5.02, 7.01) and Ex. 99.1, CEO transition: Aneel Bhusri returns as CEO
- Form 8-K (Item 5.02), CEO equity awards granted Mar 5, 2026
- Definitive proxy statement (DEF 14A), 2026 annual meeting
- Q3 fiscal 2026 earnings call prepared remarks
- Earnings release, Q4 and full fiscal 2026 (8-K Ex. 99.1)
- Earnings release, Q1 fiscal 2027 (8-K Ex. 99.1)
- Earnings release, Q2 fiscal 2027 (8-K Ex. 99.1)
08What could go wrong
What could go wrong for Workday?
- Governance
Co-founders control the vote
Co-founders Aneel Bhusri and David Duffield held about 69% of total votes on Apr 17, 2026, through Class B shares with 10 votes each. Class B converts to Class A on Oct 17, 2032, or earlier if it falls below 9% of all shares.
Watch Class B's share of all shares, about 18.7% on Aug 25, 2026 (Cityfort calculation from the Q2 FY2027 10-Q).
- Demand
Slower backlog growth
Total subscription revenue backlog grew 8.0% at Jul 31, 2026, down from 20.9% two years earlier, and cRPO grew 14.2%. Workday says backlog moves with the timing of renewals, contract length and acquisitions.
Watch Backlog and cRPO growth in the Q3 FY2027 release, and Q3 subscription revenue against the $2.515 billion Workday guided on Aug 27, 2026.
- Competition
AI-native rivals and smaller customer workforces
Workday's FY2026 10-K names Oracle and SAP as competitors and non-specialist AI-native solutions as a competitive risk. It says its subscriptions are largely based on customers' headcount, so renewals for fewer employees could reduce revenue.
Watch Gross revenue retention, 97% in Q2 FY2027 as Workday reports it.
- Debt
Less net cash, more debt
Net cash fell from $5.0 billion at Jan 31, 2025 to $414 million at Jul 31, 2026, after buybacks and acquisitions (Cityfort calculation from the FY2026 10-K and Q2 FY2027 10-Q). Workday sold $2.5 billion of new notes at 5.700% to 6.500% on Oct 23, 2026.
Watch Whether the $1.0 billion of 3.500% notes due Apr 1, 2027 are retired, and interest expense in the Q3 FY2027 10-Q.
- Execution
Repeated job cuts
Workday recorded restructuring charges of $84 million in FY2025 and $303 million in FY2026. On Sep 29, 2026 it announced a cut of about 2.5% of its workforce, with expected charges of $65–80 million.
Watch Restructuring charges and headcount, 20,896 at Jul 31, 2026.
- Other
Large stock-based pay
Stock-based compensationPay given as shares instead of cash, which spreads ownership more thinly. Learn more was $1,626 million in FY2026, 17.0% of revenue and 235% of net income. The FY2026 non-GAAPThe company's own "adjusted" numbers, not the official (GAAP) ones. Always read them next to the official figure. Learn more operating margin of 29.6% leaves it out; the GAAP operating margin was 7.5%.
Watch Stock-based compensation as a share of revenue, 17.4% in Q2 FY2027.
- Execution
Acquisitions to integrate
Workday paid $2.1 billion for businesses in FY2026, including Paradox and Sana, and agreed on Oct 13, 2026 to buy C1.ai. Goodwill rose from $2,846 million at Jan 31, 2024 to $5,229 million at Jan 31, 2026.
Watch The C1.ai closing, expected in Q4 FY2027, and any impairment charge.
- Technology
Outages and data breaches
Workday hosts its applications in data centers operated by third parties. Its FY2026 10-K names service outages and security breaches of customer data among its risks.
Watch Any outage or security incident disclosed in an 8-K or 10-Q.
Sources (11)
- Definitive proxy statement (DEF 14A), 2026 annual meeting
- Form 10-K, fiscal 2026 (year ended Jan 31, 2026)
- Form 10-Q, Q2 fiscal 2027 (quarter ended Jul 31, 2026)
- Earnings release, Q2 fiscal 2027 (8-K Ex. 99.1)
- Earnings release, Q2 fiscal 2025 (8-K Ex. 99.1)
- Investor presentation, Q2 fiscal 2027
- Form 8-K (Items 1.01, 2.03), $2.5 billion senior notes issued Oct 23, 2026
- Preliminary prospectus supplement (424B5) for the October 2026 senior notes
- Form 8-K (Items 2.02, 2.05), September 2026 reorganization (~2.5% of workforce)
- Form 10-K, fiscal 2024 (year ended Jan 31, 2024)
- Form 8-K (Item 8.01) and Ex. 99.1, agreement to acquire C1.ai
09Both sides
What do supporters and critics point to?
What supporters point to
- Revenue grew every year, from $5.1 billion in FY2022 to $9.6 billion in FY2026, and free cash flow from $1.2 billion to $2.8 billion.
- Operating income went from a loss of $2.26 to a profit of $7.55 per $100 of revenue between FY2022 and FY2026.
- Subscription revenue came in above Workday's own targets for Q4 FY2026, Q1 FY2027 and Q2 FY2027.
- Workday reports gross revenue retention of 97% in Q2 FY2027, and no customer was more than 10% of revenue in FY2024 to FY2026.
- Diluted shares fell to 246.3 million in Q2 FY2027 from 270.2 million a year earlier, after buybacks.
What critics point to
- Total subscription revenue backlog grew 8.0% at Jul 31, 2026, down from 20.9% two years earlier.
- Net cash fell from $5.0 billion at Jan 31, 2025 to $414 million at Jul 31, 2026, and Workday sold $2.5 billion of new notes in October 2026.
- Stock-based compensation was $1.6 billion in FY2026, 235% of net income.
- Workday recorded restructuring charges in FY2025 and FY2026 and announced another cut of about 2.5% of its workforce in September 2026.
- The co-founders hold about 69% of the votes, and a 2026 stockholder proposal to report votes by share class failed.
10What to watch next
What should you watch next at Workday?
Next event
Q3 FY2027 results
Date not announced yet.
Subscription revenue against guidance
Workday said on Aug 27, 2026 that it expects Q3 FY2027 subscription revenue of $2.515 billion.
Backlog growth
Total subscription revenue backlog grew 8.0% and cRPO 14.2% at Jul 31, 2026.
The 2027 notes
Workday said it intends to use the October 2026 notes to retire $1.0 billion of notes due Apr 1, 2027; no filing read shows that yet.
Restructuring charges
Workday expects $55–70 million of charges from the September 2026 job cuts in Q3 FY2027 and $10 million in Q4.
11Key dates
What are the key dates for Workday?
| Event | Date | Source |
|---|---|---|
| Q3 FY2027 endedThe Q3 FY2027 results date is not announced in the documents read. | Form 10-Q, Q2 fiscal 2027 (quarter ended Jul 31, 2026) | |
| Fiscal 2027 ends | EDGAR company filings index for Workday, Inc. (CIK 0001327811) | |
| $1.0 billion of 3.500% notes dueWorkday said it intends to retire them with money from the October 2026 notes. | Form 10-K, fiscal 2026 (year ended Jan 31, 2026); Form 8-K (Items 1.01, 2.03), $2.5 billion senior notes issued Oct 23, 2026 | |
| C1.ai purchase closesExpected in Q4 FY2027. | Not yet stated | Form 8-K (Item 8.01) and Ex. 99.1, agreement to acquire C1.ai |
| $1.5 billion revolving credit line ends | Form 8-K (Items 1.01, 1.02, 2.03), new $1.5 billion revolving credit agreement | |
| Class B shares convert to Class AOr earlier if Class B falls below 9% of all shares. | Form 10-K, fiscal 2026 (year ended Jan 31, 2026) |
Learn: Dual-class shares: when votes and ownership don't match · Fiscal years that don't end in December: Nvidia's FY2027 explained
Sources (6)
- Form 10-Q, Q2 fiscal 2027 (quarter ended Jul 31, 2026)
- EDGAR company filings index for Workday, Inc. (CIK 0001327811)
- Form 10-K, fiscal 2026 (year ended Jan 31, 2026)
- Form 8-K (Items 1.01, 2.03), $2.5 billion senior notes issued Oct 23, 2026
- Form 8-K (Item 8.01) and Ex. 99.1, agreement to acquire C1.ai
- Form 8-K (Items 1.01, 1.02, 2.03), new $1.5 billion revolving credit agreement
12Key facts
Key facts about Workday
- What does Workday do?
- Workday, Inc. sells cloud software that organizations use to recruit, pay and manage employees, keep their accounts, manage spending and plan budgets. Workday had revenue of $9.6 billion in FY2026, the year ended Jan 31, 2026, and more than 11,500 customer organizations.
- How does Workday make money?
- Workday makes money mainly from subscriptions to its cloud applications, which brought in $8.8 billion, or 92.5%, of its $9.6 billion of revenue in FY2026. Professional services, such as help setting up the software and training, brought in $719 million, or 7.5%.
- What is Workday's business model?
- Workday's business model is selling software subscriptions that typically run three years or longer and are generally invoiced yearly in advance. Workday had $28.1 billion of subscription revenue backlog, revenue under contract but not yet booked, at Jan 31, 2026. Its FY2026 10-K says the subscription model is largely based on the size of customers' employee headcount.
- Is Workday profitable?
- Yes. Workday reported operating income of $721 million and net income of $693 million on revenue of $9.6 billion in FY2026. Workday had operating losses in FY2022 and FY2023, and its FY2024 net income of $1.4 billion included a $1,025 million income tax benefit.
- What is Workday's revenue by segment?
- Workday reports one operating segment. In FY2026 Workday's revenue was $8.8 billion, or 92.5%, from subscription services and $719 million, or 7.5%, from professional services. Customers in the United States paid 75.1% of Workday's FY2026 revenue.
- Who are Workday's customers?
- Workday sells to emerging, medium-sized and large organizations in industries including financial services, government, healthcare, higher education, retail and technology. Workday's FY2026 10-K reports more than 11,500 customer organizations, and no customer accounted for more than 10% of revenue in FY2024, FY2025 or FY2026.
- How much does Workday earn from subscriptions?
- Workday's subscription services revenue was $8,833 million in FY2026, up 14.4% from $7,718 million in FY2025. In Q2 FY2027, the quarter ended Jul 31, 2026, Workday's subscription revenue was $2,471 million, up 13.9% from a year earlier.
- How much does Workday earn from professional services?
- Workday's professional services revenue, mainly consulting fees for setting up and optimizing its software plus training, was $719 million in FY2026, down from $728 million in FY2025. Workday's cost of providing these services was $790 million in FY2026, more than the revenue they brought in.
- Who owns Workday?
- Workday's co-founders Aneel Bhusri and David Duffield controlled about 69% of the votes on Apr 17, 2026, through Class B shares with 10 votes each that are covered by a stock voting agreement. BlackRock reported holding 10.0% of Workday's Class A shares on Aug 31, 2026.
Terms on this page
- Annual recurring revenue (ARR)
- Capital expenditures (capex)
- Debt-to-equity
- Earnings per share (EPS)
- EBITDA
- Free cash flow
- Market cap
- Net debt
- Net margin
- Operating income
Each explains the term in plain English, with the same number from other companies on Cityfort.
Go deeper
More detail from the same filings. Open any section.
13What it sells
13What it sells
What does Workday sell?
Human capital management (HCM)
Software to manage employees from recruitment to retirement: hiring, onboarding, pay, training and keeping staff. Recruiting tools include HiredScore and Paradox, both bought by Workday.
Financial management
Accounting software for bills to pay and collect, combining the accounts of group companies and closing the books each period.
Spend management
Tools to choose suppliers, manage contracts and sourcing, and submit and approve employee expenses.
Planning
Planning software that models finance, workforce, sales and operating data so organizations can test different scenarios.
Workday GO
A simpler HR and finance package designed and priced for medium-sized organizations. Management said medium-sized customers were roughly 60% of net new annual contract value in FY2026.
AI agents and Workday Sana
AI agents built into the software, and Workday Sana, launched in FY2026 for searching company knowledge and automating tasks. Some AI products are sold through Flex Credits, a subscription-based pricing model introduced in FY2026.
Professional services
Consulting to set up and optimize the software, and training: 7.5% of FY2026 revenue. Partners also provide these services.
What it does
- Does: Sells most of its software as subscriptions of three years or longer, generally invoiced yearly in advance
- Does: Bases its subscriptions largely on the size of each customer's workforce
- Does: Hosts its applications in data centers operated by third parties, including Amazon Web Services and Google Cloud
- Does: Buys companies to add AI tools, such as Paradox and Sana in FY2026
What it does not do
- Does not: Does not get more than 10% of its revenue from any one customer
- Does not: Does not report profit by product: it has one operating segment
- Does not: Does not pay a dividend
14How the money flows
14How the money flows · FY2026
How does money flow through Workday?
Money in
- Subscription services$8.8B
- Professional services$719M
- Other income, net$288M
The company
Workday
$9.8B came in
Money out
- Running the subscription service (cost of subscription services)$1.5B
- Delivering professional services$790M
- Product development$2.7B
- Sales and marketing$2.6B
- Administration and restructuring$1.2B
- Income tax$316M
- Net income$693M
- Customers paid Workday $9.6 billion in FY2026; $8.8 billion of it was subscriptions.
- Running the subscription service cost $1.5 billion, and delivering consulting and training cost $790 million.
- Product development took $2.7 billion, sales and marketing $2.6 billion, and administration and restructuring $1.2 billion.
- That left $721 million of operating income, and other income, net, added $288 million.
- After $316 million of income tax, $693 million was left as net income.
15What it needs to run
15What it needs to run
What does Workday need to run?
People
21,070 employees at Jan 31, 2026 and 20,896 at Jul 31, 2026. Workday cut about 7.5% of its workforce in February 2025 and about 2% in February 2026, and announced a cut of about 2.5% in September 2026.
Data centers run by others
Workday hosts its applications in data centers operated by third parties, including Amazon Web Services and Google Cloud, and co-location data centers.
Product development
$2.7 billion in FY2026, 28.0% of revenue, up from $1.9 billion, or 36.6% of revenue, in FY2022.
Partners
Partners resell Workday, refer customers and help them set up the software. Management said about 25% of net new annual contract value in Q4 FY2026 came through partners.
Headquarters
About 1.0 million square feet of owned offices in Pleasanton, California, on land leased until 2108.
Sources (6)
- Form 10-K, fiscal 2026 (year ended Jan 31, 2026)
- Form 10-Q, Q2 fiscal 2027 (quarter ended Jul 31, 2026)
- Form 8-K (Items 2.02, 2.05, 2.06), February 2026 reorganization (~2% of workforce)
- Form 8-K (Items 2.02, 2.05), September 2026 reorganization (~2.5% of workforce)
- Form 10-K, fiscal 2024 (year ended Jan 31, 2024)
- Q4 fiscal 2026 earnings call prepared remarks (Bhusri, Kazmaier, Enslin, Rowe)
16Where it sells
16Where it sells · FY2026
Where does Workday sell?
- United States75%
- Other countries25%
17Competitors and what protects it
17Competitors and what protects it
Who does Workday compete with?
Oracle
NYSE: ORCL
Named in Workday's FY2026 10-K as a large, well-established enterprise software vendor it competes with.
SAP SE
Named in Workday's FY2026 10-K as a large, well-established enterprise software vendor it competes with.
ADP
Listed in Workday's FY2026 10-K among other enterprise software vendors it competes with.
Microsoft
NASDAQ: MSFT
Listed in Workday's FY2026 10-K among other enterprise software vendors it competes with.
ServiceNow
NYSE: NOW
Listed in Workday's FY2026 10-K among other enterprise software vendors it competes with.
What protects the business
Each strength is scored 1 (weak) to 5 (strong) for the business, with the reason. It is not a rating of the share.
- Multi-year subscriptions4 of 5
Subscriptions were 92.5% of FY2026 revenue, contracts typically run three years or longer, and subscription revenue backlog was $28.1 billion at Jan 31, 2026.
- Customers who stay4 of 5
Workday reports gross revenue retention of 97% in Q4 FY2026, Q1 FY2027 and Q2 FY2027.
- Spread of customers4 of 5
More than 11,500 customer organizations, and no customer accounted for more than 10% of revenue in FY2024, FY2025 or FY2026.
Weak spot
Slower backlog growth and AI-native rivals
Workday's FY2026 10-K names non-specialist AI-native solutions among its competitive risks. Total subscription revenue backlog grew 8.0% at Jul 31, 2026, against 20.9% two years earlier.
Sources (6)
- Form 10-K, fiscal 2026 (year ended Jan 31, 2026)
- Q4 fiscal 2026 earnings call prepared remarks (Bhusri, Kazmaier, Enslin, Rowe)
- Q1 fiscal 2027 earnings call prepared remarks
- Investor presentation, Q2 fiscal 2027
- Earnings release, Q2 fiscal 2027 (8-K Ex. 99.1)
- Earnings release, Q2 fiscal 2025 (8-K Ex. 99.1)
18Where growth could come from
18Where growth could come from
Where could Workday's growth come from?
Workday said on Aug 27, 2026 that it expects FY2027 subscription revenue of $9.940–9.950 billion, up 13%, and Q3 FY2027 subscription revenue of $2.515 billion, up 12%. On Sep 29, 2026 it repeated that guidance, except that it expects its FY2027 GAAP operating margin to be about 19 points below its non-GAAP margin of 31.0%.
AI agents
EarlyAbout $600M ARR
Workday's Q2 FY2027 deck puts annual recurring revenue from agentic AI at about $600 million, up more than 200% from a year earlier. Bhusri said AI drove more than 25% of new annual contract value in Q2 FY2027.
Status: Early, too early to judge.
Subscription growth
Mixed+13.9% in Q2 FY2027
Subscription revenue grew 13.9% in Q2 FY2027, after 14.4% in FY2026 and 16.9% in FY2025. The 12-month subscription backlog (cRPO) grew 14.2% at Jul 31, 2026.
Status: Mixed, partly on track.
Medium-sized organizations
WorkingAbout 60% of FY2026 net new ACV
Management said medium enterprise customers were roughly 60% of net new annual contract value in FY2026. Workday GO is its package designed and priced for them.
Status: Working, on track against what the company said.
Acquisitions
New$2.1B spent in FY2026
Workday paid $2.1 billion, net of cash acquired, for businesses in FY2026, including Paradox and Sana for about $1.1 billion each. It agreed on Oct 13, 2026 to buy C1.ai, without disclosing the price. Goodwill rose from $2,846 million at Jan 31, 2024 to $5,229 million at Jan 31, 2026.
Status: New, recently announced.
Status compares progress with what the company itself said it would do: Working = on track against what the company said; Mixed = partly on track; Behind = behind the company's own plan; New = recently announced; Early = too early to judge.
Sources (7)
- Earnings release, Q2 fiscal 2027 (8-K Ex. 99.1)
- Form 8-K (Items 2.02, 2.05), September 2026 reorganization (~2.5% of workforce)
- Investor presentation, Q2 fiscal 2027
- Form 10-K, fiscal 2026 (year ended Jan 31, 2026)
- Q4 fiscal 2026 earnings call prepared remarks (Bhusri, Kazmaier, Enslin, Rowe)
- Form 10-K, fiscal 2024 (year ended Jan 31, 2024)
- Form 8-K (Item 8.01) and Ex. 99.1, agreement to acquire C1.ai
19The company's own measures (non-GAAP)
19The company's own measures · FY2026 and Q2 FY2027
What do Workday's own measures show?
Official (GAAP): Operating income, FY2026
$721M
Company's own measure: Non-GAAP operating income, FY2026
$2.8B
Workday leaves out stock-based compensation, employer payroll tax on employee stock transactions, amortization of acquired intangible assets, acquisition-related costs and restructuring. Stock-based compensation was $1.6 billion in FY2026, a real cost paid in shares.
Official (GAAP): Operating margin, Q2 FY2027
11.8%
Company's own measure: Non-GAAP operating margin, Q2 FY2027
31.1%
Leaves out the same costs. Stock-based compensation was $462 million in Q2 FY2027, 17.4% of revenue, the largest part of the gap.
Official (GAAP): Diluted EPS, Q2 FY2027
$2.57
Company's own measure: Non-GAAP diluted EPS, Q2 FY2027
$2.75
Workday's release says $1.52 of the $2.57 GAAP figure is a $374 million tax benefit from moving intellectual property rights between Workday entities.
Official (GAAP): Diluted EPS, FY2026
$2.59
Company's own measure: Non-GAAP diluted EPS, FY2026
$9.23
Leaves out the same costs as non-GAAP operating income.
Official (GAAP): Total subscription revenue backlog, Jul 31, 2026
$27.4B
Company's own measure: 12-month subscription revenue backlog (cRPO), Jul 31, 2026
$9.0B
cRPO is subscription revenue under contract that Workday expects to book within 12 months. It grew 14.2% from a year earlier.
Official (GAAP): Subscription revenue growth, Q2 FY2027
13.9%
Company's own measure: Total subscription revenue backlog growth, Jul 31, 2026
8.0%
Backlog growth was 20.9% at Jul 31, 2024. Workday says backlog moves with the timing of renewals, contract length and acquisitions.
Official (GAAP): Subscription revenue, Q2 FY2027
$2.5B
Company's own measure: Agentic AI annual recurring revenue, Q2 FY2027 (about, as Workday states it)
$600M
Workday's own measure; the deck defines ARR as the annualized value of active subscription contracts but does not say which products count as agentic AI.
Official (GAAP)
No official figure measures this; it is the company's own operating measure.
Company's own measure: Gross revenue retention, Q2 FY2027 (as Workday states it)
97%
Workday's measure of recurring revenue kept from the same customers as at the corresponding prior period-end, in constant currency; it counts revenue lost when customers leave or drop products and leaves out add-ons and price or volume increases.
These are the company's own measures, defined by the company. They are not comparable across companies, and they are not added together. Each sits beside the nearest official (GAAP) figure.
Learn: Non-GAAP measures: what a company's "adjusted" numbers leave out · Stock-based compensation and dilution: pay that becomes shares
Sources (6)
20Financial strength and debt
20Financial strength · Jul 31, 2026
How much debt does Workday have?
- Total debt$3.0B
- Cash and investments$3.4B
- Net cash (cash minus debt)$414M
- Net worth (shareholders' money)$6.5B
- Debt to equity
- 0.46×
- $ of debt for every $1 of shareholders' money
- Net cash is a Cityfort calculation from the Q2 FY2027 10-Q and the FY2026 10-K: cash and marketable securities minus the carrying value of debt. Operating lease liabilities, $834 million at Jan 31, 2026, are not counted as debt here.
- Debt at Jul 31, 2026 was $3.0 billion of senior notes: $1.0 billion at 3.500% due Apr 1, 2027, $750 million at 3.700% due 2029 and $1.25 billion at 3.800% due 2032.
- On Oct 23, 2026, after the quarter, Workday issued $2.5 billion of new notes paying 5.700% to 6.500%, due 2029 to 2036. It said it intends to use the money to retire the 2027 notes and for general corporate purposes; no filing read shows the 2027 notes retired yet.
- Net cash fell as Workday spent $5.8 billion on buybacks in FY2026 and the first half of FY2027, and $2.1 billion on acquisitions in FY2026.
- A new $1.5 billion revolving credit line, signed Oct 1, 2026 and running to Oct 1, 2031, had no loans outstanding at closing.
- The Oct 21, 2026 pricing term sheet for the new notes lists ratings of BBB+ from S&P and Baa1 from Moody's.
Sources (7)
- Form 10-K, fiscal 2026 (year ended Jan 31, 2026)
- Form 10-Q, Q2 fiscal 2027 (quarter ended Jul 31, 2026)
- Earnings release, Q2 fiscal 2027 (8-K Ex. 99.1)
- Form 8-K (Items 1.01, 1.02, 2.03), new $1.5 billion revolving credit agreement
- Free writing prospectus: pricing term sheet for $2.5 billion senior notes (Oct 21, 2026)
- Form 8-K (Items 1.01, 2.03), $2.5 billion senior notes issued Oct 23, 2026
- Preliminary prospectus supplement (424B5) for the October 2026 senior notes
21Who owns it
21Who owns it · ownership as of Apr 17, 2026
Who owns Workday?
- Officers and directors (as a group), shares
- 18.6%
- Officers and directors (as a group), votes
- 69.0%
Shares vs votes by class
Workday has more than one class of shares, and the classes carry different votes. The share of votes a class holds can differ a lot from its share of the shares.
- Class A common stock: share of all votes30.3%
- Class B common stock: share of all votes69.7%
Each class's part of all votes = its shares outstanding × votes per share ÷ the total for all classes.
Share classes
Holders of 5% or more
From the company's proxy statement (DEF 14A), later Schedule 13G filings and the share counts on its latest annual or quarterly report. Each holder row shows the date of its own filing.
Insider trades · Form 4 data as of Nov 6, 2026
What did Workday's insiders report trading?
Workday's insiders made 96 Form 4A filing an insider must make within two business days of buying or selling the company's shares. Learn more filings in the 12 months to Nov 6, 2026.
They reported no purchases and 276 sales (3.6 million shares) in the open market or privately (codes P and S).
276 of the 276 sales were on forms with the Rule 10b5-1 plan box checked.
The same filings report 97 other share transactions (C: 37, F: 33, A: 24, G: 3).
They also report 38 transactions in options, stock units or other derivatives.
Insiders are a company's officers, directors and owners of more than 10% of a class of its shares. Most changes in their holdings must be reported to the SEC on a Form 4 within two business days. Source: SEC Form 4 filings on EDGAR.
- P
- a purchase in the open market or privately
- S
- a sale in the open market or privately
- A
- a grant, award or other acquisition from the company under Rule 16b-3
- F
- shares withheld or handed over to pay an exercise price or tax when an award is received, exercised or vests
- C
- conversion of a derivative security
- G
- a bona fide gift
Code meanings: General Instruction 8 of Form 4 (SEC).
The latest 25 of 373 transactions
Shares: A = acquired, D = disposed of. A price the filing gives only in a footnote shows as “See filing”. The 10b5-1 box is checked when at least one trade on the form was made under a Rule 10b5-1 plan. A Form 4/A replaces the form it amends. See all of Workday's Form 4 filings on EDGAR.
Learn: Dual-class shares: when votes and ownership don't match · How to read a proxy statement (DEF 14A): Nvidia's 2026 proxy · Form 4 insider filings: who files, the codes and the footnotes · Rule 10b5-1 trading plans: how insiders pre-schedule their trades
Sources (8)
- Form 10-Q, Q2 fiscal 2027 (quarter ended Jul 31, 2026)
- Definitive proxy statement (DEF 14A), 2026 annual meeting
- Schedule 13G/A filed by BlackRock, Inc. (event date Aug 31, 2026)
- Schedule 13G filed by Vanguard Capital Management (event date Mar 31, 2026)
- Schedule 13G/A filed by The Vanguard Group (event date Mar 13, 2026; reports 0 shares after internal realignment)
- Schedule 13G/A filed by Hotchkis and Wiley Capital Management (event date Jun 30, 2026)
- Schedule 13G filed by Eagle Capital Management (event date Jun 30, 2026)
- Schedule 13G filed by Vanguard Portfolio Management (event date Mar 31, 2026)
22What it does with profit
22What it does with profit
What does Workday do with its profit?
Buyback · Jan 31, 2023
Repurchased $75 million of common stock in FY2023.
$75M
Buyback · Jan 31, 2024
Repurchased $423 million of common stock in FY2024.
$423M
Buyback · Jan 31, 2025
Repurchased $700 million of common stock in FY2025.
$700M
Buyback · Jan 31, 2026
Repurchased $2.9 billion of common stock in FY2026; 12.8 million shares.
$2.9B
Buyback · Jul 31, 2026
Repurchased $2.9 billion in Q1 and Q2 FY2027, about 21.8 million shares. Average monthly prices from May to July 2026 ranged from $125.64 to $141.56.
$2.9B
Money raised · Oct 23, 2026
Sold $2.5 billion of senior notes in four parts, due 2029 to 2036, paying 5.700% to 6.500%. Workday said it intends to use the money to retire its $1.0 billion of notes due 2027 and for general corporate purposes.
$2.5B
Sources (7)
- Form 10-K, fiscal 2024 (year ended Jan 31, 2024)
- Form 10-K, fiscal 2026 (year ended Jan 31, 2026)
- Earnings release, Q1 fiscal 2027 (8-K Ex. 99.1)
- Earnings release, Q2 fiscal 2027 (8-K Ex. 99.1)
- Form 10-Q, Q2 fiscal 2027 (quarter ended Jul 31, 2026)
- Form 8-K (Items 1.01, 2.03), $2.5 billion senior notes issued Oct 23, 2026
- Preliminary prospectus supplement (424B5) for the October 2026 senior notes
23Governance signals
23Governance signals
What do Workday's governance filings show?
- Auditor
- Ernst & Young LLP, since 2008
- Auditor changes
- None in the period covered
- Audit qualifications
- None reported
- Related-party dealings
- The 2026 proxy reports that Workday paid $2.79 million in FY2026 to Incline Alchemy, an implementation partner 40.6% owned by co-founder David Duffield and majority-owned by his son, for services to Workday customers. Workday also leased office space in Nevada from a Duffield affiliate for $147,318. BlackRock and Vanguard, both 5% holders, are Workday customers.
- Credit rating
- S&P and Moody's (as listed in Workday's Oct 21, 2026 pricing term sheet for its senior notes) BBB+ (S&P) / Baa1 (Moody's) (Not stated in the term sheet), Oct 21, 2026
A credit rating describes the company's ability to repay debt. It is not a rating of the share.
Flags to know about
other · Feb 9, 2026
Chair and CEO roles combined
Co-founder Aneel Bhusri has been both chair and CEO since Feb 6, 2026. Mark Hawkins is lead independent director and vice chair.
other · Feb 9, 2026
CEO change in February 2026
Carl Eschenbach stepped down as CEO and director on Feb 6, 2026. Under his separation terms he received $3.60 million in cash plus accelerated vesting.
other · Jun 22, 2026
Executive pay vote: 87.6% in favor
At the Jun 16, 2026 annual meeting, 87.6% of for and against votes backed executive pay in an advisory vote, with Class B counted at 10 votes a share (Cityfort calculation from the 8-K filed Jun 22, 2026). A stockholder proposal to report vote results by share class received 91.1 million votes for and 534.5 million against.
related party
Business with a co-founder's companies
Incline Alchemy, 40.6% owned by David Duffield, received $2.79 million from Workday in FY2026 for services to Workday customers; Ridgeline, 81.8% owned by Duffield, is a Workday customer. The proxy says these were arms-length agreements.
Sources (5)
- Form 10-K, fiscal 2026 (year ended Jan 31, 2026)
- Definitive proxy statement (DEF 14A), 2026 annual meeting
- Free writing prospectus: pricing term sheet for $2.5 billion senior notes (Oct 21, 2026)
- Form 8-K (Items 5.02, 7.01) and Ex. 99.1, CEO transition: Aneel Bhusri returns as CEO
- Form 8-K (Item 5.07), 2026 annual meeting vote results
24What the market paid
24What the market paid · price as of Nov 5, 2026
What did the market pay for Workday on Nov 5, 2026?
Price as of Nov 5, 2026 (shown for education; prices change daily).
Price as of Nov 5, 2026: Workday's Class A shares closed at $200.17, from Nasdaq's historical price table. Times about 241 million Class A and Class B shares (Aug 25, 2026), that is a market value of about $48.2 billion (Cityfort calculation from the Nov 5, 2026 closing price on Nasdaq and the Q2 FY2027 10-Q). Class B shares are not listed but convert one-for-one into Class A. P/E is price ÷ earnings per share: 77.3 on FY2026 diluted EPS of $2.59 (Cityfort calculation from the Nov 5, 2026 closing price and the FY2026 10-K). Workday pays no dividend.
- Share price
- $200.17
- Market value (market cap)
- $48.2B
- P/E
- 77.3×
More price-based ratios · as of Nov 5, 2026
Each ratio divides a number from the company's filings by the market value or share price on Nov 5, 2026. Prices change daily, so these ratios do too.
Price to sales (P/S)
4.8×
$48.2B market value ÷ $10.2B revenue (four quarters to Jul 31, 2026) = 4.8×
Cityfort calculation from the Nov 5, 2026 closing price and the Q3 FY2026 to Q2 FY2027 10-Qs and earnings releases. Source: WDAY historical daily prices, Nasdaq (close of Nov 5, 2026: $200.17); Form 10-Q, Q2 fiscal 2027 (quarter ended Jul 31, 2026); Form 10-K, fiscal 2026 (year ended Jan 31, 2026) and 5 more
How price ratios workFree cash flow yield
5.8%
$2.8B free cash flow (FY2026) ÷ $48.2B market value = 5.8%
Cityfort calculation from the FY2026 10-K and the Nov 5, 2026 closing price. Source: WDAY historical daily prices, Nasdaq (close of Nov 5, 2026: $200.17); Form 10-Q, Q2 fiscal 2027 (quarter ended Jul 31, 2026); Form 10-K, fiscal 2026 (year ended Jan 31, 2026)
What free cash flow means
Shares used for the market value: 241 million ($200.17 × 241 million shares ≈ $48.2B). Source: Form 10-Q, Q2 fiscal 2027 (quarter ended Jul 31, 2026); Definitive proxy statement (DEF 14A), 2026 annual meeting
Source: WDAY historical daily prices, Nasdaq (close of Nov 5, 2026: $200.17); Form 10-Q, Q2 fiscal 2027 (quarter ended Jul 31, 2026); Form 10-K, fiscal 2026 (year ended Jan 31, 2026)
Sources (9)
- WDAY historical daily prices, Nasdaq (close of Nov 5, 2026: $200.17)
- Form 10-Q, Q2 fiscal 2027 (quarter ended Jul 31, 2026)
- Form 10-K, fiscal 2026 (year ended Jan 31, 2026)
- Earnings release, Q3 fiscal 2026 (8-K Ex. 99.1)
- Earnings release, Q4 and full fiscal 2026 (8-K Ex. 99.1)
- Earnings release, Q1 fiscal 2027 (8-K Ex. 99.1)
- Form 10-Q, Q1 fiscal 2027 (quarter ended Apr 30, 2026)
- Earnings release, Q2 fiscal 2027 (8-K Ex. 99.1)
- Definitive proxy statement (DEF 14A), 2026 annual meeting
25How it got here
25How it got here
How did Workday get here?
2005
Milestone
Founded
David Duffield and Aneel Bhusri co-founded Workday in 2005; it says it pioneered HR (HCM) software in the cloud.
2022
Milestone
$3.0 billion of senior notes
In FY2023 Workday issued $3.0 billion of senior notes due 2027, 2029 and 2032, and repaid $1.8 billion of earlier debt.
2024
Milestone
Operating profit in FY2024
Workday reported operating income of $183 million in FY2024, after operating losses in FY2022 and FY2023.
2024
Business-model change
Bought HiredScore
Workday bought HiredScore, an AI recruiting tool, in March 2024 for $530 million in cash.
2025
Crisis
Job cuts of about 7.5%
In February 2025 Workday announced a plan to cut about 7.5% of its workforce. Restructuring charges were $84 million in FY2025 and $303 million in FY2026.
2025
Business-model change
Paradox and Sana
Workday bought Paradox, a conversational AI recruiting tool, in September 2025 and Sana Labs, an AI company building knowledge tools, in November 2025, for about $1.1 billion each.
2026
Business-model change
Co-founder back as CEO
Aneel Bhusri returned as CEO on Feb 6, 2026, replacing Carl Eschenbach.
2026
Milestone
New buyback and new debt
The board authorized a new $4.0 billion buyback in August 2026, and Workday sold $2.5 billion of notes on Oct 23, 2026.
2026
Milestone
Agreed to buy C1.ai
On Oct 13, 2026 Workday agreed to buy C1.ai, an agentic identity company. It did not disclose the price and expects the deal to close in Q4 FY2027.
Sources (8)
- Form 10-K, fiscal 2026 (year ended Jan 31, 2026)
- Definitive proxy statement (DEF 14A), 2026 annual meeting
- Form 10-K, fiscal 2024 (year ended Jan 31, 2024)
- Earnings release, Q1 fiscal 2026 (8-K Ex. 99.1)
- Form 8-K (Items 5.02, 7.01) and Ex. 99.1, CEO transition: Aneel Bhusri returns as CEO
- Form 10-Q, Q2 fiscal 2027 (quarter ended Jul 31, 2026)
- Form 8-K (Items 1.01, 2.03), $2.5 billion senior notes issued Oct 23, 2026
- Form 8-K (Item 8.01) and Ex. 99.1, agreement to acquire C1.ai
26Sources and changes
Where every number on this page comes from
Sources (36 documents)
- S1Form 10-K, fiscal 2026 (year ended Jan 31, 2026) · Workday, Inc. (SEC EDGAR) · Tier 1: company or exchange filing · Mar 6, 2026
- S3Form 10-K, fiscal 2024 (year ended Jan 31, 2024) · Workday, Inc. (SEC EDGAR) · Tier 1: company or exchange filing · Mar 8, 2024
- S5Form 10-Q, Q2 fiscal 2027 (quarter ended Jul 31, 2026) · Workday, Inc. (SEC EDGAR) · Tier 1: company or exchange filing · Aug 27, 2026
- S6Form 10-Q, Q1 fiscal 2027 (quarter ended Apr 30, 2026) · Workday, Inc. (SEC EDGAR) · Tier 1: company or exchange filing · May 22, 2026
- S7Earnings release, Q2 fiscal 2027 (8-K Ex. 99.1) · Workday, Inc. (SEC EDGAR) · Tier 1: company or exchange filing · Aug 27, 2026
- S8Earnings release, Q1 fiscal 2027 (8-K Ex. 99.1) · Workday, Inc. (SEC EDGAR) · Tier 1: company or exchange filing · May 21, 2026
- S9Earnings release, Q4 and full fiscal 2026 (8-K Ex. 99.1) · Workday, Inc. (SEC EDGAR) · Tier 1: company or exchange filing · Feb 24, 2026
- S10Earnings release, Q3 fiscal 2026 (8-K Ex. 99.1) · Workday, Inc. (SEC EDGAR) · Tier 1: company or exchange filing · Nov 25, 2025
- S11Earnings release, Q2 fiscal 2026 (8-K Ex. 99.1) · Workday, Inc. (SEC EDGAR) · Tier 1: company or exchange filing · Aug 21, 2025
- S12Earnings release, Q1 fiscal 2026 (8-K Ex. 99.1) · Workday, Inc. (SEC EDGAR) · Tier 1: company or exchange filing · May 22, 2025
- S13Earnings release, Q4 and full fiscal 2025 (8-K Ex. 99.1) · Workday, Inc. (SEC EDGAR) · Tier 1: company or exchange filing · Feb 25, 2025
- S14Earnings release, Q3 fiscal 2025 (8-K Ex. 99.1) · Workday, Inc. (SEC EDGAR) · Tier 1: company or exchange filing · Nov 26, 2024
- S15Earnings release, Q2 fiscal 2025 (8-K Ex. 99.1) · Workday, Inc. (SEC EDGAR) · Tier 1: company or exchange filing · Aug 22, 2024
- S16Definitive proxy statement (DEF 14A), 2026 annual meeting · Workday, Inc. (SEC EDGAR) · Tier 1: company or exchange filing · May 5, 2026
- S17Form 8-K (Item 5.07), 2026 annual meeting vote results · Workday, Inc. (SEC EDGAR) · Tier 1: company or exchange filing · Jun 22, 2026
- S18Form 8-K (Items 2.02, 2.05, 2.06), February 2026 reorganization (~2% of workforce) · Workday, Inc. (SEC EDGAR) · Tier 1: company or exchange filing · Feb 4, 2026
- S19Form 8-K (Items 5.02, 7.01) and Ex. 99.1, CEO transition: Aneel Bhusri returns as CEO · Workday, Inc. (SEC EDGAR) · Tier 1: company or exchange filing · Feb 9, 2026
- S20Form 8-K (Item 5.02), CEO equity awards granted Mar 5, 2026 · Workday, Inc. (SEC EDGAR) · Tier 1: company or exchange filing · Mar 6, 2026
- S21Form 8-K (Items 2.02, 2.05), September 2026 reorganization (~2.5% of workforce) · Workday, Inc. (SEC EDGAR) · Tier 1: company or exchange filing · Sep 29, 2026
- S22Form 8-K (Items 1.01, 1.02, 2.03), new $1.5 billion revolving credit agreement · Workday, Inc. (SEC EDGAR) · Tier 1: company or exchange filing · Oct 1, 2026
- S23Form 8-K (Item 8.01) and Ex. 99.1, agreement to acquire C1.ai · Workday, Inc. (SEC EDGAR) · Tier 1: company or exchange filing · Oct 13, 2026
- S24Free writing prospectus: pricing term sheet for $2.5 billion senior notes (Oct 21, 2026) · Workday, Inc. (SEC EDGAR) · Tier 1: company or exchange filing · Oct 22, 2026
- S25Form 8-K (Items 1.01, 2.03), $2.5 billion senior notes issued Oct 23, 2026 · Workday, Inc. (SEC EDGAR) · Tier 1: company or exchange filing · Oct 23, 2026
- S26Preliminary prospectus supplement (424B5) for the October 2026 senior notes · Workday, Inc. (SEC EDGAR) · Tier 1: company or exchange filing · Oct 21, 2026
- S27Schedule 13G/A filed by BlackRock, Inc. (event date Aug 31, 2026) · BlackRock, Inc. (SEC EDGAR) · Tier 1: company or exchange filing · Sep 4, 2026
- S28Schedule 13G filed by Vanguard Capital Management (event date Mar 31, 2026) · Vanguard Capital Management (SEC EDGAR) · Tier 1: company or exchange filing · Apr 29, 2026
- S29Schedule 13G filed by Vanguard Portfolio Management (event date Mar 31, 2026) · Vanguard Portfolio Management (SEC EDGAR) · Tier 1: company or exchange filing · Apr 29, 2026
- S30Schedule 13G/A filed by The Vanguard Group (event date Mar 13, 2026; reports 0 shares after internal realignment) · The Vanguard Group (SEC EDGAR) · Tier 1: company or exchange filing · Mar 27, 2026
- S31Schedule 13G/A filed by Hotchkis and Wiley Capital Management (event date Jun 30, 2026) · Hotchkis and Wiley Capital Management, LLC (SEC EDGAR) · Tier 1: company or exchange filing · Aug 12, 2026
- S32Schedule 13G filed by Eagle Capital Management (event date Jun 30, 2026) · Eagle Capital Management, LLC (SEC EDGAR) · Tier 1: company or exchange filing · Aug 14, 2026
- S33Q4 fiscal 2026 earnings call prepared remarks (Bhusri, Kazmaier, Enslin, Rowe) · Workday, Inc. (investor relations) · Tier 1: company or exchange filing · Feb 24, 2026
- S34Q1 fiscal 2027 earnings call prepared remarks · Workday, Inc. (investor relations) · Tier 1: company or exchange filing · May 21, 2026
- S35Q3 fiscal 2026 earnings call prepared remarks · Workday, Inc. (investor relations) · Tier 1: company or exchange filing · Nov 25, 2025
- S36Investor presentation, Q2 fiscal 2027 · Workday, Inc. (investor relations) · Tier 1: company or exchange filing · Aug 27, 2026
- S37WDAY historical daily prices, Nasdaq (close of Nov 5, 2026: $200.17) · Nasdaq, Inc. · Tier 1: company or exchange filing · Nov 5, 2026
- S38EDGAR company filings index for Workday, Inc. (CIK 0001327811) · SEC EDGAR · Tier 1: company or exchange filing · Nov 6, 2026
Changes to this page (v1 · Nov 6, 2026)
- v1 · Nov 6, 2026First version, through Q2 FY2027 (quarter ended Jul 31, 2026). (first version)
Numbers come only from tier 1 and tier 2 sources. Read how we research.
Disclaimer
For learning only. Cityfort is not a registered investment adviser or broker-dealer and does not recommend buying or selling any security. Prices shown are dated and may be out of date.
Investing in securities involves risk, including loss of capital. Before making any investment decision, do your own research and consider consulting a registered investment adviser or other qualified professional.
Cityfort, its owners and contributors may or may not hold securities of companies covered. Cityfort is not paid by any company it covers. Content is not an offer or solicitation to buy or sell any security, including in any initial public offering.
Read the positions policyRead the full disclaimerHide the full disclaimer
Cityfort publishes general educational content that explains how listed companies work. Cityfort is not registered with the US Securities and Exchange Commission or any state securities regulator as an investment adviser, and is not a broker-dealer or a member of FINRA. Cityfort does not provide investment, tax or legal advice, recommendations, ratings, price targets or any opinion on whether to buy, sell or hold any security. Nothing on the site is tailored to any person's circumstances.
All information is taken from publicly available sources, mainly company filings with the SEC, which are listed on each page with dates. We work to keep it accurate and correct errors publicly, but we do not guarantee that it is complete, accurate or up to date. Any market price or price-based ratio shown is dated, may be out of date by the time you read it, and is included only to explain concepts.
Statements by company management, including forward-looking statements and guidance, are reported as the company's statements, with their date and source; they are not our forecasts. Adjusted (non-GAAP) figures are the company's own measures and are shown next to the official (GAAP) figures.