Health Care · NYSE: SYK
Stryker: how the business works
Stryker makes knee and hip implants, surgical equipment, patient care and emergency products and the Mako surgical robot, mostly for hospitals, with net sales of $25.1 billion in FY2025.
By Hardik Bhandare · Checked against filings: . Editorial policy. Corrections
Follow Stryker
Email me when Stryker's page is updated after earnings.
We'll send a confirmation email first. See our privacy policy.
Stryker Corporation · Portage, Michigan · Founded 1941
Updated for Q3 FY2026 · checked
- Net sales, FY2025
- $25.1B
- Net earnings, FY2025
- $3.2B
- Countries where it sells, FY2025
- About 61
- Employees, Dec 31, 2025
- About 56,000
- Founded
- 1941
The short version
Stryker in 5 points
1 · What it sells
Stryker sells orthopedic implants, surgical and endoscopy equipment, patient care products and the Mako robot, with FY2025 net sales of $25.1 billion, 54.5% from MedSurg and Neurotechnology and 45.5% from Orthopaedics.
2 · Who pays it
Stryker reports no sales by type of payer and names no large customer; by selling location, customers in the US paid 75.7% of FY2025 net sales and customers outside the US 24.3%.
3 · What it keeps from $100
Of every $100 that came in during FY2025, Stryker kept $12.8 as net earnings after a 28.1% tax rate, and its operating income was $19.47 per $100 of sales.
4 · Where the operating profit comes from
In FY2025 Orthopaedics earned 50.6% of Stryker's segment operating income on 45.5% of net sales, and MedSurg and Neurotechnology 49.4% on 54.5%.
5 · The one thing to watch
Stryker lowered its FY2026 organic sales growth outlook to 6.5% to 7.0% on Oct 29, 2026, from 8.0% to 9.5% in January, and its Q3 FY2026 net earnings of $753 million included a $293 million goodwill impairment.
Sources: From Stryker's FY2025 10-K, its Jun 26, 2026 segment recast and its Q3 FY2026 earnings release and 10-Q · checked
See the full receipt and the management scorecard below
Sources (5)
01Where the money goes · FY2025
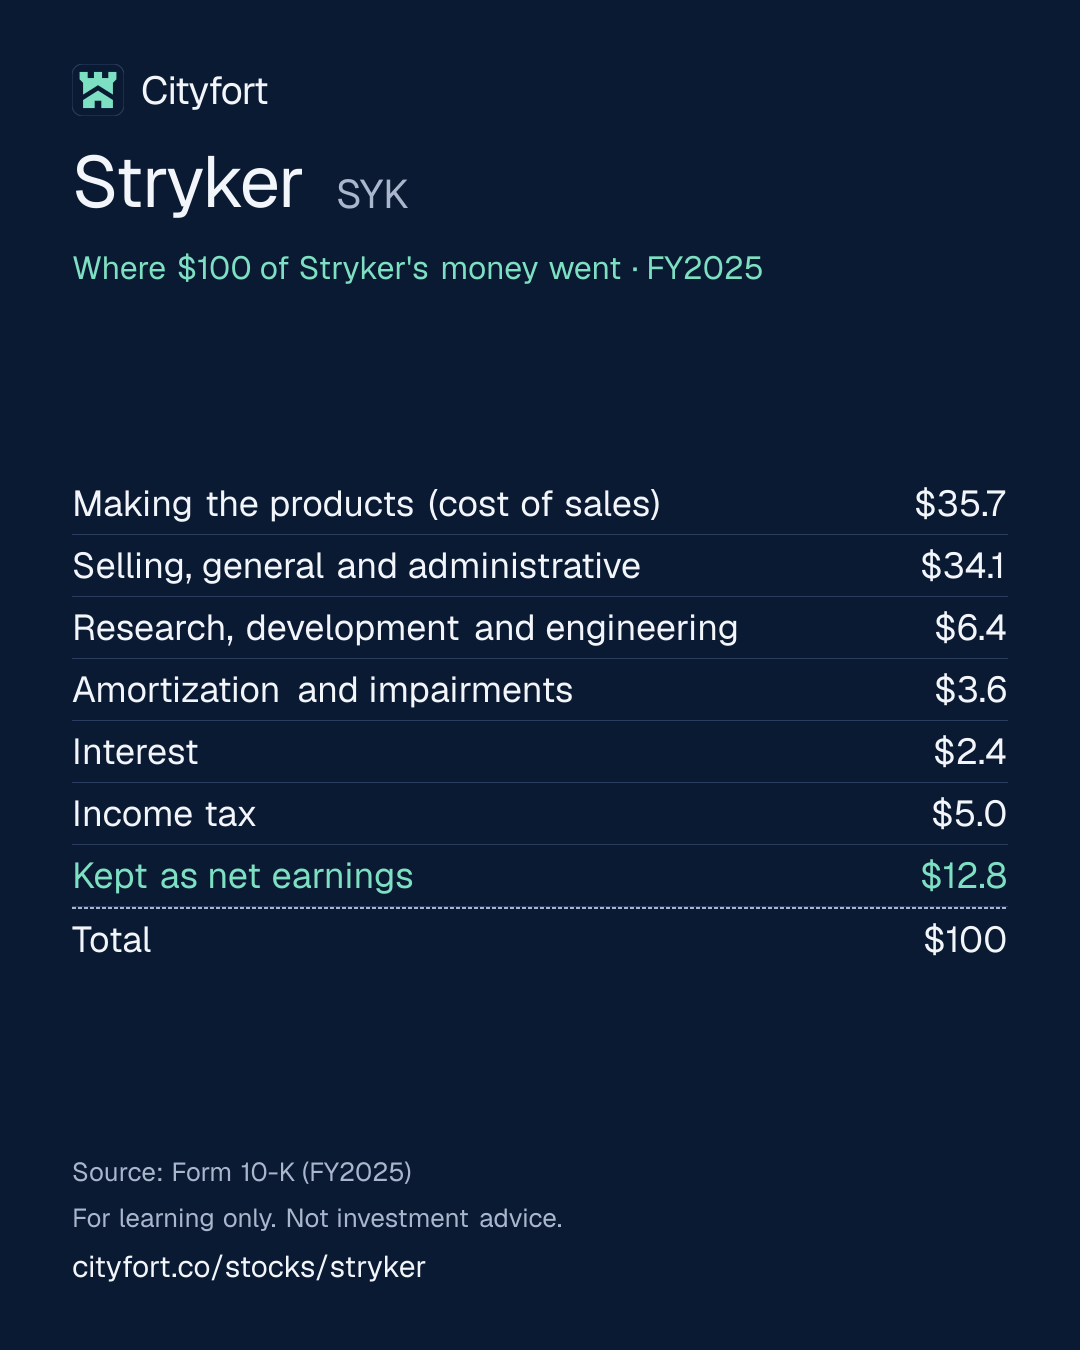
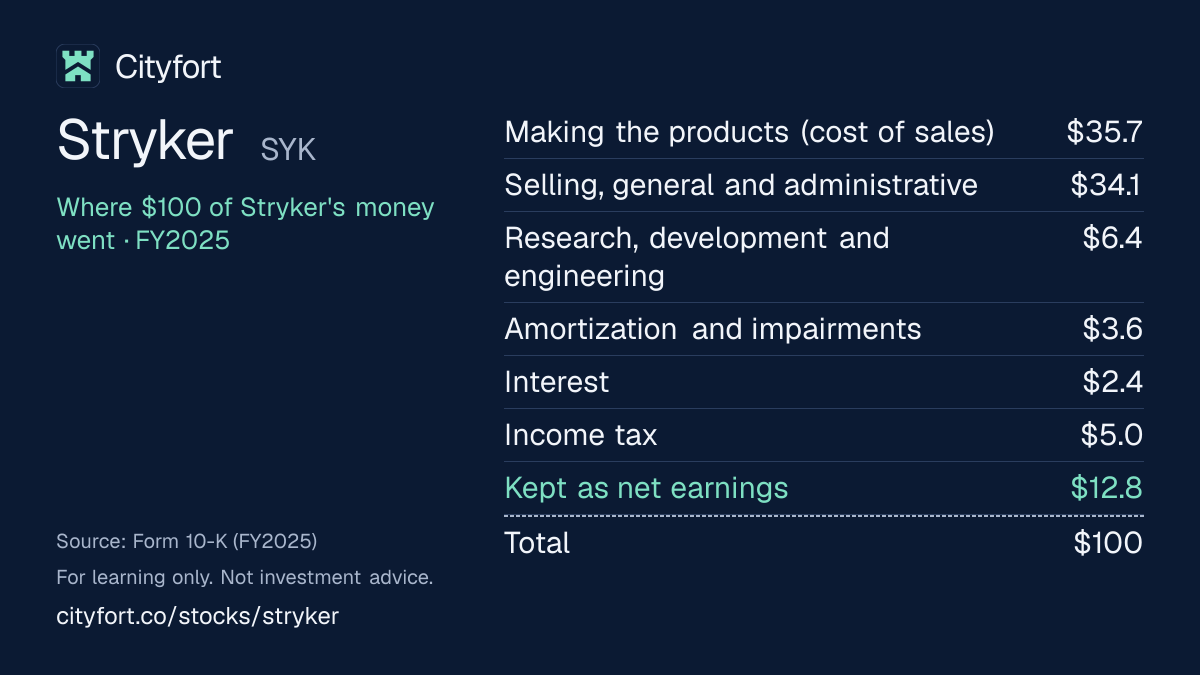
Where does $100 of Stryker's money go?
Stryker · FY2025
Receipt for every $100
| Making the products (cost of sales) | $35.7 |
|---|---|
| Selling, general and administrative | $34.1 |
| Research, development and engineering | $6.4 |
| Amortization and impairments | $3.6 |
| Interest | $2.4 |
| Income tax | $5.0 |
| Kept as net earnings | $12.8 |
| Total | $100 |
Each line = amount ÷ total money in × 100. Lines may not add to exactly $100 because of rounding.
How this is worked out
Cityfort calculation from the FY2025 10-K. Of every $100 that came in during FY2025 (net sales of $25.1 billion plus $232 million of other income): each line = line ÷ $25.35 billion × 100.
Save this receipt as an image:
1080 × 1350 PNG for Instagram, LinkedIn1200 × 675 PNG for X
Embed this receipt
Paste this code into a blog or website to show the receipt, with a link back to this page:
Each week: one company explained in 5 points, picked by earnings date.
Free, no tips, unsubscribe anytime.
We'll send a confirmation email. See our privacy policy.
02The business in one line
What does Stryker do?
Hospitals and surgeons pay Stryker for implants, surgical equipment and patient care products; most of the money goes on making those products and on selling them, and about $13 of every $100 of sales is left as net earnings.
- In FY2025, MedSurg and Neurotechnology (surgical equipment, endoscopy, patient care, stroke and brain products) was 54.5% of net sales, and Orthopaedics (knees, hips, trauma and the Mako robot) 45.5%.
- Customers in the US paid 75.7% of FY2025 net sales; Stryker sells in about 61 countries, mostly directly to doctors and hospitals.
03Who pays it
Who pays Stryker?
Hospitals and doctors in the US
76%
of revenue
Doctors, hospitals and other healthcare facilities buying implants, equipment and disposables, reached mostly through Stryker's own sales teams.
Hospitals and doctors outside the US
24%
of revenue
Customers in Europe, the Middle East and Africa (12.7% of FY2025 net sales), Asia Pacific (8.6%) and Canada and Latin America (3.0%), served by Stryker subsidiaries and by distributors.
- Hospitals and doctors in the US76%
- Hospitals and doctors outside the US24%
How spread out the customers are
Stryker's FY2025 10-K names no customer as a large share of sales and does not split sales by type of payer. The split above is by Stryker's selling location (Cityfort calculation from the FY2025 10-K).
04Why it makes money
Why does Stryker make money?
Stryker keeps about $64 of gross profit per $100 of sales, then spends most of it on its sales teams and administration.
Gross profit stayed between $62.8 and $64.1 per $100 of sales in FY2021 to FY2025. Selling, general and administrative costs took $34.44 per $100 in FY2025. Operating income per $100 rose from $15.10 in FY2021 to $19.47 in FY2025, with a dip to $16.33 in FY2024 after $977 million of impairments.
Operating income per $100 of net sales
$15.1$19.5
FY2021 to FY2025
- Sales teams work with surgeons and hospitals
- Hospitals buy equipment they keep, such as beds, cameras, power tools and the Mako robot
- Surgeons use Stryker implants and disposables in operations
- About $64 of each $100 of sales is left after making the products
- Sales costs and research take about $41 of that
- Cash pays for dividends and for buying other device makers
↺ Step 6 feeds back into step 1.
05Business segments · FY2025
Which businesses make up Stryker?
MedSurg and Neurotechnology
55%Surgical instruments, endoscopy, patient care and emergency equipment, stroke and blood clot devices, and brain and skull surgery products. It earned 49.4% of FY2025 segment operating income on 54.5% of net sales.
Revenue $13.7B · Operating profit $3.7B
Orthopaedics
46%Knee and hip implants, trauma and extremities implants, and Ortho Tech (the Mako robot, power tools and instruments). It earned 50.6% of FY2025 segment operating income on 45.5% of net sales.
Revenue $11.4B · Operating profit $3.8B
How the mix changed
- MedSurg and Neurotechnology
- Orthopaedics
Revenue by segment, FY2023 to FY2025.
US$
See the numbers
06The numbers · Consolidated · US$
How has Stryker done?
Revenue
$25.1BFY2025
Net sales rose every year, from $17.1 billion in FY2021 to $25.1 billion in FY2025; Q1 FY2026 sales grew only 2.6% after a cyber incident disrupted order processing, manufacturing and shipping.
US$
See the numbers
Net profit
$3.2BFY2025
Net earnings rose from $2.0 billion in FY2021 to $3.2 billion in FY2025, with a dip in FY2024 after $977 million of impairments and a 28.1% tax rate in FY2025 after transfers of intellectual property between tax jurisdictions.
US$
See the numbers
Profit kept per $100 of revenue
$12.9FY2025
Net earnings per $100 of sales peaked at $15.4 in FY2023 and were $12.9 in FY2025, while EBITDA, operating income plus depreciation and amortization (Cityfort calculation from the FY2023 and FY2025 10-Ks), rose to $24.2 per $100 and is not shown by quarter.
$ of profit per $100 of revenue (net margin)
See the numbers
Free cash flow
$4.3BFY2025
Free cash flow, cash from operations minus purchases of property, plant and equipment, rose from $2.7 billion in FY2021 to $4.3 billion in FY2025, after a dip to $2.0 billion in FY2022 when inventories and receivables grew.
US$ · cash from operations minus spending on plants and equipment
See the numbers
See all yearly numbers
EBITDA here = operating income plus depreciation and amortization (from the cash flow statement). Fiscal years are the company's own (December 31 (the fiscal year is the calendar year, so Q3 FY2026 is July to September 2026)). Net profit is the share belonging to the company's owners.
Download Stryker's yearly and quarterly numbers (CSV, with source ids)
Learn: Stock-based compensation and dilution: pay that becomes shares
Sources (11)
- Form 10-K for fiscal 2025 (year ended Dec 31, 2025)
- Form 10-K for fiscal 2023 (year ended Dec 31, 2023)
- Q4 and full-year 2024 earnings release (8-K Ex. 99.1)
- Q1 2025 earnings release (8-K Ex. 99.1)
- Q2 2025 earnings release (8-K Ex. 99.1)
- Q3 2025 earnings release (8-K Ex. 99.1)
- Q4 and full-year 2025 earnings release (8-K Ex. 99.1)
- Q1 2026 earnings release (8-K Ex. 99.1)
- Q2 2026 earnings release (8-K Ex. 99.1)
- Q3 2026 earnings release (8-K Ex. 99.1)
- Form 10-Q for Q3 2026 (quarter ended Sep 30, 2026)
07Who runs it
Who runs Stryker, and did they deliver?
Kevin A. Lobo
Chair and Chief Executive Officer · since 2012
CEO since October 2012 and Chair since July 2014. He becomes Executive Chair on Jan 1, 2027. 2025 total pay was $21.4 million, 264 times the median employee's.
Spencer S. Stiles
President and Chief Operating Officer · since 2026
President and COO since Jan 1, 2026, after serving as Group President, Orthopaedics. The board named him CEO from Jan 1, 2027, when he also joins the board.
Preston W. Wells
Vice President and Chief Financial Officer
Emily Baculik
Vice President, Corporate Controller and Chief Accounting Officer · since 2026
Chief accounting officer since Sep 1, 2026, when William E. Berry Jr. retired.
What they said, and what happened
2 delivered · 2 too early to tell
Said on Jan 28, 2025
Stryker said it expected FY2025 organic sales growth of 8.0% to 9.0%.
DeliveredWhat happened
Stryker reported FY2025 organic sales growth of 10.3%, above the range.
Said on Oct 30, 2025
Stryker said it expected FY2025 adjusted (non-GAAPThe company's own "adjusted" numbers, not the official (GAAP) ones. Always read them next to the official figure. Learn more) diluted EPS of $13.50 to $13.60.
DeliveredWhat happened
Stryker reported FY2025 adjusted diluted EPS of $13.63, just above the range; GAAP diluted EPS was $8.40.
Said on Jan 29, 2026
Stryker said it expected FY2026 organic sales growth of 8.0% to 9.5% and adjusted (non-GAAP) diluted EPS of $14.90 to $15.10.
Too early to tellWhat happened
Stryker narrowed the outlook to 8.3% to 9.3% and $14.95 to $15.10 on Jul 30, 2026, then lowered it to 6.5% to 7.0% and $14.80 to $14.90 on Oct 29, 2026. FY2026 results are not out yet.
Said on Oct 29, 2026
Stryker said it expected FY2026 organic sales growth of 6.5% to 7.0% and adjusted (non-GAAP) diluted EPS of $14.80 to $14.90.
Too early to tellWhat happened
FY2026 results are not out yet; the company had not announced their date in the filings used for this page.
Sources (10)
- Form 10-K for fiscal 2025 (year ended Dec 31, 2025)
- 2026 proxy statement (DEF 14A)
- 8-K (Item 5.02) Ex. 99.1: Spencer Stiles to succeed Kevin Lobo as CEO on Jan 1, 2027
- 8-K (Item 5.02) Ex. 99.1: Spencer Stiles named President and COO
- 8-K (Item 5.02): chief accounting officer transition
- Q4 and full-year 2024 earnings release (8-K Ex. 99.1)
- Q4 and full-year 2025 earnings release (8-K Ex. 99.1)
- Q3 2025 earnings release (8-K Ex. 99.1)
- Q2 2026 earnings release (8-K Ex. 99.1)
- Q3 2026 earnings release (8-K Ex. 99.1)
08What could go wrong
What could go wrong for Stryker?
- Technology
Cyber incident hit Q1 FY2026
A cybersecurity incident found on Mar 11, 2026 disrupted order processing, manufacturing and shipping. Stryker said it had a material impact on Q1 FY2026 results: net sales grew 2.6% and organic growth was 2.4%, against 7.7% to 11.0% in the seven other quarters from Q4 FY2024 to Q3 FY2026. The cost has not been disclosed. A Mar 20, 2026 letter from the outside investigators, Unit 42, filed with an 8-K on Mar 23, 2026, reported that all known signs of the intrusion had been addressed.
Watch Further 8-K filings and the cybersecurity risk factor in each 10-Q and 10-K.
- Execution
Peripheral Vascular impairment after the Inari deal
Stryker paid $4.81 billion, net of cash acquired, for Inari Medical in February 2025. In Q3 FY2026 it booked a $293 million goodwill impairment on Peripheral Vascular, citing near-term operational and supply constraints and a longer expected path to growth.
Watch Vascular sales and any further impairment in the goodwill note of each 10-Q and 10-K.
- Execution
Acquired assets are half of the balance sheet
Goodwill and other intangible assets were $25.0 billion, 52.2% of total assets, at Dec 31, 2025. Impairments cut operating income by $977 million in FY2024 and $170 million in FY2025. The 10-K names acquisitions that do not deliver as a risk.
Watch Goodwill and other impairments line in each earnings release.
- Pricing
Pricing pressure from hospitals and governments
The 10-K names hospital cost-cutting, provider consolidation, government payers and China's volume-based procurement (bulk tendering) as sources of pressure on prices. US customers paid 75.7% of FY2025 net sales.
Watch Organic sales growth and gross profit per $100 of sales in each release.
- Regulation
Tariffs and device rules abroad
Stryker's May 1, 2025 outlook absorbed about $200 million of tariff costs, and Q2 FY2026 gross profit included a $158 million reversal of 2025 tariffs. The 10-K also names the EU Medical Device Regulation, phased in to December 2028.
Watch Tariff items in the non-GAAP reconciliation of each earnings release.
- Legal
German tax assessments
German tax authorities issued final assessments of $754 million for 2010 to 2017, which Stryker intends to appeal or litigate. Unrecognized tax benefits were $403 million at Dec 31, 2025.
Watch The income taxes note in each 10-Q and 10-K.
- Legal
Hip recall claims
Stryker had $144 million accrued at Dec 31, 2025 for recall-related hip claims, and says the final cost may be materially different. Recall-related charges were $58 million in FY2025.
Watch The contingencies note in each 10-Q and 10-K.
- Demand
Slower knee and hip sales
Knee sales grew 1.1% and hip sales fell 1.0% in Q3 FY2026, after 8.5% and 9.5% growth in FY2025. The 10-K says fewer orthopedic implant surgeries take place in summer.
Watch Knees and Hips lines in the sales-by-business table of each release.
Sources (18)
- 8-K (Item 8.01): cybersecurity incident identified Mar 11, 2026
- 8-K/A (Item 1.05): material cybersecurity incident
- 8-K (Item 7.01): cybersecurity incident update by the CISO
- Q1 2026 earnings release (8-K Ex. 99.1)
- Form 10-Q for Q1 2026 (quarter ended Mar 31, 2026)
- 8-K (Item 7.01) Ex. 99.1: Unit 42 status letter on the cybersecurity incident
- Q4 and full-year 2024 earnings release (8-K Ex. 99.1)
- Q1 2025 earnings release (8-K Ex. 99.1)
- Q2 2025 earnings release (8-K Ex. 99.1)
- Q3 2025 earnings release (8-K Ex. 99.1)
- Q4 and full-year 2025 earnings release (8-K Ex. 99.1)
- Q2 2026 earnings release (8-K Ex. 99.1)
- Q3 2026 earnings release (8-K Ex. 99.1)
- Form 10-K for fiscal 2025 (year ended Dec 31, 2025)
- 8-K (Item 2.01): completion of the Inari Medical acquisition
- Form 10-Q for Q3 2026 (quarter ended Sep 30, 2026)
- Form 10-Q for Q2 2026 (quarter ended Jun 30, 2026)
- 8-K (Item 8.01): recast of 2025 10-K items for the 2026 segment reorganization, Ex. 99.1
09Both sides
What do supporters and critics point to?
What supporters point to
- Net sales rose every year, from $17.1 billion in FY2021 to $25.1 billion in FY2025, about 10.1% a year (Cityfort calculation from the FY2025 10-K).
- Free cash flow rose from $2.7 billion in FY2021 to $4.3 billion in FY2025.
- In FY2025 the Orthopaedics segment earned $33.2 of segment operating income per $100 of sales and MedSurg and Neurotechnology $27.0.
- Ortho Tech sales grew 15.8% and Endoscopy 13.9% in Q3 FY2026.
- Dividends declared rose every year from $2.585 a share in FY2021 to $3.40 in FY2025, and Stryker bought back $1.0 billion of shares in Q3 FY2026.
What critics point to
- Stryker said a March 2026 cyber incident had a material impact on Q1 FY2026, when net sales grew 2.6%.
- Stryker booked a $293 million goodwill impairment on Peripheral Vascular in Q3 FY2026, after buying Inari in February 2025.
- Stryker lowered its FY2026 organic growth outlook from 8.0% to 9.5% in January 2026 to 6.5% to 7.0% in October 2026.
- Goodwill and other intangible assets were 52.2% of total assets at Dec 31, 2025.
- Net earnings per $100 of sales fell from $15.4 in FY2023 to $12.9 in FY2025, partly because of a 28.1% tax rate in FY2025.
10What to watch next
What should you watch next at Stryker?
Next event
Q4 FY2026 results
Date not announced yet.
FY2026 results against the October outlook
Stryker said on Oct 29, 2026 that it expects FY2026 organic sales growth of 6.5% to 7.0% and adjusted diluted EPS of $14.80 to $14.90. Organic growth was 2.4%, 9.0% and 7.7% in the first three quarters.
New CEO from Jan 1, 2027
Spencer Stiles takes over as CEO and Kevin Lobo becomes Executive Chair.
Vascular and the Inari business
Vascular sales were $566 million in Q3 FY2026, the quarter of the $293 million Peripheral Vascular impairment.
11Key dates
What are the key dates for Stryker?
| Event | Date | Source |
|---|---|---|
| Spencer Stiles becomes CEO; Kevin Lobo becomes Executive ChairAnnounced in an 8-K filed Oct 6, 2026. | 8-K (Item 5.02) Ex. 99.1: Spencer Stiles to succeed Kevin Lobo as CEO on Jan 1, 2027 |
Learn: What is an 8-K? A company's news report, with a real Adobe filing
12Key facts
Key facts about Stryker
- What does Stryker do?
- Stryker Corporation makes medical devices: knee and hip implants, trauma implants, the Mako robotic-arm system, surgical and endoscopy equipment, patient handling and emergency products, and stroke and brain surgery products. Stryker's net sales were $25.1 billion in FY2025 (calendar 2025).
- How does Stryker make money?
- Stryker sells its devices mostly directly to doctors, hospitals and other healthcare facilities, and through distributors in some markets. In FY2025, 54.5% of Stryker's net sales came from its MedSurg and Neurotechnology segment and 45.5% from its Orthopaedics segment.
- Is Stryker profitable?
- Yes. Stryker had operating income of $4.9 billion and net earnings of $3.2 billion in FY2025, on net sales of $25.1 billion. In Q3 FY2026 Stryker's net earnings were $753 million, after a $293 million goodwill impairment on its Peripheral Vascular business.
- What is Stryker's revenue by segment?
- On the segment basis Stryker adopted in 2026, MedSurg and Neurotechnology had FY2025 net sales of $13.7 billion and segment operating income of $3.7 billion, and Orthopaedics had net sales of $11.4 billion and segment operating income of $3.8 billion.
- Who are Stryker's customers?
- Stryker's customers are mainly doctors, hospitals and other healthcare facilities. Stryker's FY2025 10-K names no customer as a large share of sales; customers in the US paid 75.7% of FY2025 net sales and customers outside the US 24.3%.
- Who owns Stryker?
- Stryker's 2026 proxy statementThe yearly filing about shareholder votes, the board and executive pay. Learn more shows its directors and executive officers holding 4.6% of the shares on Feb 28, 2026, including 4.0% held by director Ronda E. Stryker. Vanguard Capital Management reported 6.73% on Mar 31, 2026.
- How much does Stryker sell in knee and hip implants?
- Stryker sold $2.66 billion of knee products and $1.87 billion of hip products in FY2025, and $3.95 billion of trauma and extremities products, all in its Orthopaedics segment.
- How much does Stryker earn from the Mako robot and Ortho Tech?
- Stryker's Ortho Tech business, which includes the Mako robotic-arm system, power tools, cutting accessories and orthopedic instruments, had net sales of $2.77 billion in FY2025 and $754 million in Q3 FY2026, up 15.8% from a year earlier. Stryker does not report Mako sales on their own.
- How much does Stryker sell in surgical and patient care equipment?
- In FY2025 Stryker's Medical business (patient handling, emergency care and clinical communication) had net sales of $4.20 billion, Endoscopy $3.81 billion, Neuro Cranial $2.49 billion, Vascular $1.97 billion and Instruments $1.23 billion.
Sources (6)
- Form 10-K for fiscal 2025 (year ended Dec 31, 2025)
- 8-K (Item 8.01): recast of 2025 10-K items for the 2026 segment reorganization, Ex. 99.1
- Q3 2026 earnings release (8-K Ex. 99.1)
- Form 10-Q for Q3 2026 (quarter ended Sep 30, 2026)
- 2026 proxy statement (DEF 14A)
- Schedule 13G: Vanguard Capital Management LLC (event Mar 31, 2026)
Terms on this page
- Capital expenditures (capex)
- Debt-to-equity
- Dividend payout ratio
- Earnings per share (EPS)
- EBITDA
- Free cash flow
- Market cap
- Net debt
- Net margin
- P/E ratio
Each explains the term in plain English, with the same number from other companies on Cityfort.
Go deeper
More detail from the same filings. Open any section.
13What it sells
13What it sells
What does Stryker sell?
Medical ($4.20B)
Patient handling and emergency medical equipment, intensive care disposables, clinical communication systems and virtual care.
Trauma and Extremities ($3.95B)
Implants and other products used to repair broken bones (trauma) and to treat the extremities, such as arms and legs.
Endoscopy ($3.81B)
Cameras, light sources and communication systems for minimally invasive (keyhole) surgery.
Ortho Tech ($2.77B)
The Mako robotic-arm system for joint replacement, plus surgical power tools, cutting accessories and orthopedic instruments.
Knees ($2.66B) and Hips ($1.87B)
Artificial knee and hip joints used in joint replacement surgery.
Neuro Cranial ($2.49B)
Products for brain and skull surgery, bone grafts and products that treat spine fractures.
Vascular ($1.97B)
Devices that treat strokes and remove blood clots in veins, including products from Inari Medical, bought in February 2025.
Instruments ($1.23B)
Surgical equipment, safety technology and navigation systems that guide surgeons during operations.
What it does
- Does: Makes implants that stay in the patient's body, such as artificial knees, hips and bone plates
- Does: Sells equipment hospitals keep and reuse, such as robots, cameras, power tools and beds
- Does: Sells most products directly to doctors and hospitals, and uses distributors in some markets
What it does not do
- Does not: Does not sell medicines
- Does not: Sold its Spinal Implants business in April 2025; small leftover sales remain ($4 million in Q3 FY2026)
- Does not: Does not report Mako robot sales or the number of Mako systems installed on their own
14How the money flows
14How the money flows · FY2025
How does money flow through Stryker?
Money in
- Net sales$25.1B
- Other income$232M
The company
Stryker
$25.3B came in
Money out
- Cost of sales (making the products)$9.1B
- Selling, general and administrative costs$8.7B
- Research, development and engineering$1.6B
- Amortization of acquired intangibles and impairments$902M
- Interest expense$607M
- Income tax$1.3B
- Net earnings$3.2B
- Hospitals, doctors and other customers paid Stryker $25.1 billion of net sales in FY2025.
- Making the products cost $9.1 billion, leaving $16.1 billion of gross profit.
- Sales teams and administration took $8.7 billion, research and development $1.6 billion, and amortization and impairments $0.9 billion.
- That left $4.9 billion of operating income; interest cost $0.6 billion and other income added $0.2 billion.
- Income tax took $1.3 billion, a 28.1% rate, and $3.2 billion was left as net earnings.
15What it needs to run
15What it needs to run
What does Stryker need to run?
People
About 56,000 employees at Dec 31, 2025, about 28,000 of them in the US, including the sales teams that work with surgeons and hospitals.
Factories
Manufacturing sites in the US, Ireland, Mexico, the Netherlands, Poland, Switzerland and other countries; the 10-K lists interruptions at these sites as a risk.
Raw materials and suppliers
Stryker buys raw materials, components and services from outside suppliers; its 10-K names shortages, price rises and quality problems as risks.
Patents
About 5,600 US patents and about 9,000 patents outside the US at Dec 31, 2025.
Borrowed money
Total debt of $14.9 billion at Sep 30, 2026, mostly 20 series of senior notes due 2027 to 2050, plus a $3.0 billion revolving credit line maturing in February 2030.
16Where it sells
16Where it sells · FY2025
Where does Stryker sell?
- United States76%
- Europe, Middle East and Africa13%
- Asia Pacific9%
- Canada and Latin America3%
17Competitors and what protects it
17Competitors and what protects it
Who does Stryker compete with?
Zimmer Biomet
Named in Stryker's FY2025 10-K as a competitor in joint replacement, trauma and extremities, robotics and surgical instruments.
Johnson & Johnson MedTech
NYSE: JNJ
The medical device business of Johnson & Johnson, named in Stryker's FY2025 10-K as a competitor in joint replacement, instruments, vascular and neuro cranial products.
Medtronic
NYSE: MDT
Named in Stryker's FY2025 10-K as a competitor in surgical instruments and in vascular and neuro cranial products.
Smith & Nephew
Named in Stryker's FY2025 10-K as a competitor in joint replacement, trauma and extremities, robotics and endoscopy.
Penumbra
Named in Stryker's FY2025 10-K as a competitor in vascular and neuro cranial products.
What protects the business
Each strength is scored 1 (weak) to 5 (strong) for the business, with the reason. It is not a rating of the share.
- Direct sales reach4 of 5
Stryker sells in about 61 countries through its own subsidiaries and distributors, and markets most products directly to doctors and hospitals.
- Broad product range4 of 5
Nine of Stryker's ten product businesses had FY2025 net sales above $1 billion; the tenth, Spinal Implants, was sold in 2025. The largest, Medical, had $4.20 billion.
- Steady gross profit4 of 5
Gross profit stayed between $62.8 and $64.1 per $100 of net sales in each year from FY2021 to FY2025.
- Patents3 of 5
Stryker held about 5,600 US patents and about 9,000 patents outside the US at Dec 31, 2025.
Weak spot
Reliance on US hospitals and their budgets
Customers in the US paid 75.7% of FY2025 net sales, and the 10-K names hospital cost-cutting, provider consolidation and reimbursement changes as sources of pricing pressure.
18Where growth could come from
18Where growth could come from
Where could Stryker's growth come from?
Stryker said in its Q3 FY2026 earnings release (Oct 29, 2026) that it expects FY2026 organic sales growth of 6.5% to 7.0% and adjusted (non-GAAP) diluted EPS of $14.80 to $14.90. On Jan 29, 2026 it had said 8.0% to 9.5% and $14.90 to $15.10. Organic growth leaves out currency moves, acquisitions and divestitures.
Ortho Tech (Mako robot, power tools)
Working+15.8% in Q3 FY2026
Ortho Tech net sales were $754 million in Q3 FY2026, up from $651 million a year earlier, and $2.77 billion in FY2025.
Status: Working, on track against what the company said.
Endoscopy
Working+13.9% in Q3 FY2026
Endoscopy net sales were $1,021 million in Q3 FY2026, up from $896 million, after growing 12.3% to $3.81 billion in FY2025.
Status: Working, on track against what the company said.
Medical (patient care and emergency equipment)
Working+9.7% in Q3 FY2026
Medical net sales were $1,081 million in Q3 FY2026, up from $985 million a year earlier.
Status: Working, on track against what the company said.
Vascular, including Inari Medical
Mixed+8.0% in Q3 FY2026
Vascular sales rose 50.6% to $1.97 billion in FY2025 with Inari, bought in February 2025. In Q3 FY2026 they were $566 million, and Stryker booked a $293 million goodwill impairment on Peripheral Vascular, citing near-term operational and supply constraints.
Status: Mixed, partly on track.
Knees and hips
MixedKnees +1.1%, hips −1.0%, Q3 FY2026
Knee sales were $635 million and hip sales $453 million in Q3 FY2026, after growing 8.5% and 9.5% in FY2025.
Status: Mixed, partly on track.
Status compares progress with what the company itself said it would do: Working = on track against what the company said; Mixed = partly on track; Behind = behind the company's own plan; New = recently announced; Early = too early to judge.
19The company's own measures (non-GAAP)
19The company's own measures · FY2025 and Q3 FY2026
What do Stryker's own measures show?
Official (GAAP): Diluted EPS, FY2025
$8.40
Company's own measure: Adjusted diluted EPS, FY2025
$13.63
Stryker leaves out acquisition and integration costs, amortization of purchased intangibles, structural optimization (restructuring) charges, impairments, EU medical device regulation costs, recall and legal matters, and tax matters.
Official (GAAP): Operating income, FY2025
$4.9B
Company's own measure: Adjusted operating income, FY2025
$6.6B
Same exclusions; amortization of purchased intangibles alone was $732 million in FY2025.
Official (GAAP): Net earnings, FY2025
$3.2B
Company's own measure: Adjusted net earnings, FY2025
$5.3B
Same exclusions, including the tax effect of intellectual property transfers that raised FY2025 GAAP income tax.
Official (GAAP): Diluted EPS, Q3 FY2026
$1.96
Company's own measure: Adjusted diluted EPS, Q3 FY2026
$3.52
Same exclusions; GAAP EPS includes the $293 million Peripheral Vascular goodwill impairment and $153 million of structural optimization charges.
Official (GAAP): Reported net sales growth, FY2025 (Cityfort calculation from the FY2025 10-K)
11.2%
Company's own measure: Organic net sales growth, FY2025
10.3%
Stryker's organic growth leaves out the effects of currency moves, acquisitions such as Inari and divestitures such as Spinal Implants.
These are the company's own measures, defined by the company. They are not comparable across companies, and they are not added together. Each sits beside the nearest official (GAAP) figure.
Learn: Non-GAAP measures: what a company's "adjusted" numbers leave out
20Financial strength and debt
20Financial strength · Sep 30, 2026
How much debt does Stryker have?
- Total debt$14.9B
- Cash and investments$3.3B
- Net debt (debt minus cash)$11.7B
- Net worth (shareholders' money)$23.5B
- Debt to equity
- 0.64×
- $ of debt for every $1 of shareholders' money
- Net debt is total debt of $14.9 billion minus $3.3 billion of cash (Cityfort calculation from the Q3 FY2026 10-Q). It was $11.8 billion at Dec 31, 2025 (Cityfort calculation from the FY2025 10-K).
- Debt is mostly 20 series of senior unsecured notes due 2027 to 2050, several in euros, plus $250 million of commercial paper at Sep 30, 2026. Stryker repaid $1.0 billion of 3.500% notes in March 2026.
- Stryker has a $3.0 billion revolving credit line maturing Feb 25, 2030, with a maximum leverage ratio of 3.75 to 1.
- Goodwill and other intangible assets, mostly from acquisitions, were $25.0 billion, or 52.2% of total assets of $47.8 billion at Dec 31, 2025 (Cityfort calculation from the FY2025 10-K).
- Debt leaves out operating lease liabilities of $503 million at Sep 30, 2026.
21Who owns it
21Who owns it · ownership as of Feb 28, 2026
Who owns Stryker?
- Officers and directors (as a group), shares
- 4.6%
Share classes
Holders of 5% or more
From the company's proxy statement (DEF 14A), later Schedule 13G filings and the share counts on its latest annual or quarterly report. Each holder row shows the date of its own filing.
Insider trades · Form 4 data as of Nov 6, 2026
What did Stryker's insiders report trading?
Stryker's insiders made 64 Form 4A filing an insider must make within two business days of buying or selling the company's shares. Learn more filings in the 12 months to Nov 6, 2026.
They reported 5 purchases (131 shares) and 71 sales (1.7 million shares) in the open market or privately (codes P and S).
6 of the 71 sales were on forms with the Rule 10b5-1 plan box checked.
The same filings report 65 other share transactions (F: 21, A: 19, M: 14, G: 7, J: 4).
They also report 25 transactions in options, stock units or other derivatives.
Insiders are a company's officers, directors and owners of more than 10% of a class of its shares. Most changes in their holdings must be reported to the SEC on a Form 4 within two business days. Source: SEC Form 4 filings on EDGAR.
- P
- a purchase in the open market or privately
- S
- a sale in the open market or privately
- A
- a grant, award or other acquisition from the company under Rule 16b-3
- F
- shares withheld or handed over to pay an exercise price or tax when an award is received, exercised or vests
- M
- exercise or conversion of an option or other derivative, exempt under Rule 16b-3
- G
- a bona fide gift
- J
- another acquisition or disposition, described in a footnote
Code meanings: General Instruction 8 of Form 4 (SEC).
The latest 25 of 141 transactions
Shares: A = acquired, D = disposed of. A price the filing gives only in a footnote shows as “See filing”. The 10b5-1 box is checked when at least one trade on the form was made under a Rule 10b5-1 plan. A Form 4/A replaces the form it amends. See all of Stryker's Form 4 filings on EDGAR.
Learn: How to read a proxy statement (DEF 14A): Nvidia's 2026 proxy · Form 4 insider filings: who files, the codes and the footnotes · Rule 10b5-1 trading plans: how insiders pre-schedule their trades
Sources (7)
- Form 10-Q for Q3 2026 (quarter ended Sep 30, 2026)
- Form 10-K for fiscal 2025 (year ended Dec 31, 2025)
- Schedule 13G: Vanguard Capital Management LLC (event Mar 31, 2026)
- 2026 proxy statement (DEF 14A)
- Schedule 13G/A: Greenleaf Trust (event Dec 31, 2025)
- Schedule 13D/A: Ronda E. Stryker (event Feb 27, 2026)
- Schedule 13G/A: The Vanguard Group (0%)
22What it does with profit
22What it does with profit
What does Stryker do with its profit?
Dividend per share
$3.40FY2025
Dividend paid for each share, by financial year.
$ per share
See the numbers
Buyback · Sep 30, 2026
Bought back 3 million shares for $1.0 billion in Q3 FY2026, the first repurchases since at least FY2021. The board added $3.0 billion to the authorization in October 2026, bringing it to $3.03 billion.
$1.0B
23Governance signals
23Governance signals
What do Stryker's governance filings show?
- Auditor
- Ernst & Young LLP, since 1974
- Auditor changes
- None in the period covered
- Audit qualifications
- None reported
- Related-party dealings
- This version of the page does not summarize the related-person transactions section of the 2026 proxy. The proxy says Stryker's directors and officers may not hedge Stryker stock or use it as collateral for loans, except for shares already used as collateral when the guidelines took effect or when a person became subject to them.
- Credit rating
- No public credit rating found in a search of rating agency sites on Nov 7, 2026
Flags to know about
other
Material cybersecurity incident in March 2026
Stryker identified a cybersecurity incident on Mar 11, 2026 that disrupted order processing, manufacturing and shipping. In an Apr 9, 2026 filing it said the incident had a material impact on its operations and on Q1 FY2026 results. It has not disclosed the cost.
other
German tax assessments under appeal
Germany's Federal Central Tax Office issued final assessments of $754 million for 2010 to 2017. Stryker says it intends to defend its position through appeals or litigation. Its auditor named uncertain tax positions a critical audit matter.
other
Hip implant recall claims
Stryker had $144 million accrued at Dec 31, 2025 for claims tied to voluntary recalls of certain hip stems and femoral heads and legacy Wright hip claims. It says the final cost may be materially different.
regulatory
Foreign bribery inquiries closed
Stryker's FY2025 10-K says the SEC and the Department of Justice each told Stryker in 2025 that they had closed their inquiries under the Foreign Corrupt Practices Act.
disclosure
No call transcripts filed; cyber incident cost not given
Stryker files no earnings call transcripts or slides with the SEC, and its filings give no dollar cost for the March 2026 cyber incident.
Sources (8)
- Form 10-K for fiscal 2025 (year ended Dec 31, 2025)
- 2026 proxy statement (DEF 14A)
- Form 10-Q for Q3 2026 (quarter ended Sep 30, 2026)
- 8-K (Item 8.01): cybersecurity incident identified Mar 11, 2026
- 8-K (Item 7.01): cybersecurity incident update by the CISO
- 8-K/A (Item 1.05): material cybersecurity incident
- Form 10-Q for Q1 2026 (quarter ended Mar 31, 2026)
- EDGAR submissions record: Stryker Corp (CIK 0000310764)
24What the market paid
24What the market paid · price as of Nov 5, 2026
What did the market pay for Stryker on Nov 5, 2026?
Price as of Nov 5, 2026 (shown for education; prices change daily).
Price as of Nov 5, 2026: Stryker closed at $335.08, from Nasdaq's historical price table; Stryker's shares are listed on the NYSE. The market value of about $127.6 billion (Cityfort calculation from the Nov 5, 2026 closing price and the Q3 FY2026 10-Q) uses the 380.7 million shares on the 10-Q cover (Sep 30, 2026). P/E is price ÷ earnings per share: 35.7 on diluted EPS of $9.39 for the four quarters to Q3 FY2026 (Cityfort calculation from the Q4 FY2025 to Q3 FY2026 earnings releases), and 39.9 on FY2025 diluted EPS of $8.40.
- Share price
- $335.08
- Market value (market cap)
- $127.6B
- P/E
- 35.7×
More price-based ratios · as of Nov 5, 2026
Each ratio divides a number from the company's filings by the market value or share price on Nov 5, 2026. Prices change daily, so these ratios do too.
Price to sales (P/S)
4.9×
$127.6B market value ÷ $26.3B revenue (four quarters to Sep 30, 2026) = 4.9×
Cityfort calculation from the Nov 5, 2026 closing price and the Q4 FY2025 to Q3 FY2026 10-Qs and earnings releases. Source: SYK historical prices, Oct 29 to Nov 5, 2026 (closing price Nov 5, 2026); Form 10-Q for Q3 2026 (quarter ended Sep 30, 2026); Form 10-K for fiscal 2025 (year ended Dec 31, 2025) and 4 more
How price ratios workDividend yield
1.01%
$3.40 dividends per share (FY2025) ÷ $335.08 share price = 1.01%
Cityfort calculation from the FY2025 10-K and the Nov 5, 2026 closing price. Source: SYK historical prices, Oct 29 to Nov 5, 2026 (closing price Nov 5, 2026); Form 10-Q for Q3 2026 (quarter ended Sep 30, 2026); Form 10-K for fiscal 2025 (year ended Dec 31, 2025) and 4 more
What dividend yield meansFree cash flow yield
3.4%
$4.3B free cash flow (FY2025) ÷ $127.6B market value = 3.4%
Cityfort calculation from the FY2025 10-K and the Nov 5, 2026 closing price. Source: SYK historical prices, Oct 29 to Nov 5, 2026 (closing price Nov 5, 2026); Form 10-Q for Q3 2026 (quarter ended Sep 30, 2026); Form 10-K for fiscal 2025 (year ended Dec 31, 2025) and 4 more
What free cash flow means
Shares used for the market value: 380.69 million ($335.08 × 380.69 million shares ≈ $127.6B). Source: Form 10-Q for Q3 2026 (quarter ended Sep 30, 2026); Form 10-K for fiscal 2025 (year ended Dec 31, 2025)
Source: SYK historical prices, Oct 29 to Nov 5, 2026 (closing price Nov 5, 2026); Form 10-Q for Q3 2026 (quarter ended Sep 30, 2026); Form 10-K for fiscal 2025 (year ended Dec 31, 2025) and 4 more
Sources (7)
- SYK historical prices, Oct 29 to Nov 5, 2026 (closing price Nov 5, 2026)
- Form 10-Q for Q3 2026 (quarter ended Sep 30, 2026)
- Form 10-K for fiscal 2025 (year ended Dec 31, 2025)
- Q4 and full-year 2025 earnings release (8-K Ex. 99.1)
- Q1 2026 earnings release (8-K Ex. 99.1)
- Q2 2026 earnings release (8-K Ex. 99.1)
- Q3 2026 earnings release (8-K Ex. 99.1)
25How it got here
25How it got here
How did Stryker get here?
1941
Milestone
Founded by a surgeon
Dr. Homer H. Stryker, an orthopedic surgeon, founded the business in 1941; Stryker Corporation was incorporated in Michigan in 1946.
2012
Milestone
Kevin Lobo becomes CEO
Stryker says sales grew from $8.7 billion in 2012 to more than $26 billion in 2026 under Lobo, with more than 60 acquisitions, including Mako.
2024
Business-model change
Spinal Implants put up for sale
Stryker classed Spinal Implants as held for sale in November 2024, booking a $362 million charge, and sold it to Viscogliosi Brothers in April 2025.
2025
Business-model change
Inari Medical bought
Stryker closed its $80-a-share purchase of Inari Medical, a maker of blood clot removal devices, on Feb 19, 2025, paying $4.81 billion net of cash acquired.
2026
Crisis
Cybersecurity incident
An incident found on Mar 11, 2026 disrupted orders, manufacturing and shipping; Stryker later reported a material impact on Q1 FY2026 results.
2026
Business-model change
Segments reorganized
From 2026 orthopedic instruments and the Mako robot sit in a new Ortho Tech business in Orthopaedics; Stryker recast FY2023 to FY2025 on this basis on Jun 26, 2026.
2026
Crisis
Peripheral Vascular impairment
Stryker booked a $293 million goodwill impairment on the Peripheral Vascular unit, which holds Inari, in Q3 FY2026.
2026
Milestone
CEO succession announced
On Oct 6, 2026 Stryker said Spencer Stiles will become CEO on Jan 1, 2027 and Kevin Lobo will become Executive Chair.
Sources (8)
- Form 10-K for fiscal 2025 (year ended Dec 31, 2025)
- 8-K (Item 5.02) Ex. 99.1: Spencer Stiles to succeed Kevin Lobo as CEO on Jan 1, 2027
- 8-K (Item 8.01): recast of 2025 10-K items for the 2026 segment reorganization, Ex. 99.1
- 8-K (Item 2.01): completion of the Inari Medical acquisition
- 8-K (Item 1.01) Ex. 99.1: agreement to acquire Inari Medical
- 8-K (Item 8.01): cybersecurity incident identified Mar 11, 2026
- 8-K/A (Item 1.05): material cybersecurity incident
- Form 10-Q for Q3 2026 (quarter ended Sep 30, 2026)
26Sources and changes
Where every number on this page comes from
Sources (32 documents)
- S1Form 10-K for fiscal 2025 (year ended Dec 31, 2025) · Stryker Corporation (SEC EDGAR) · Tier 1: company or exchange filing · Feb 11, 2026
- S2Form 10-K for fiscal 2023 (year ended Dec 31, 2023) · Stryker Corporation (SEC EDGAR) · Tier 1: company or exchange filing · Feb 14, 2024
- S3Form 10-Q for Q3 2026 (quarter ended Sep 30, 2026) · Stryker Corporation (SEC EDGAR) · Tier 1: company or exchange filing · Oct 30, 2026
- S4Form 10-Q for Q2 2026 (quarter ended Jun 30, 2026) · Stryker Corporation (SEC EDGAR) · Tier 1: company or exchange filing · Jul 31, 2026
- S5Form 10-Q for Q1 2026 (quarter ended Mar 31, 2026) · Stryker Corporation (SEC EDGAR) · Tier 1: company or exchange filing · May 11, 2026
- S6Q4 and full-year 2024 earnings release (8-K Ex. 99.1) · Stryker Corporation (SEC EDGAR) · Tier 1: company or exchange filing · Jan 28, 2025
- S7Q1 2025 earnings release (8-K Ex. 99.1) · Stryker Corporation (SEC EDGAR) · Tier 1: company or exchange filing · May 1, 2025
- S8Q2 2025 earnings release (8-K Ex. 99.1) · Stryker Corporation (SEC EDGAR) · Tier 1: company or exchange filing · Jul 31, 2025
- S9Q3 2025 earnings release (8-K Ex. 99.1) · Stryker Corporation (SEC EDGAR) · Tier 1: company or exchange filing · Oct 30, 2025
- S10Q4 and full-year 2025 earnings release (8-K Ex. 99.1) · Stryker Corporation (SEC EDGAR) · Tier 1: company or exchange filing · Jan 29, 2026
- S11Q1 2026 earnings release (8-K Ex. 99.1) · Stryker Corporation (SEC EDGAR) · Tier 1: company or exchange filing · Apr 30, 2026
- S12Q2 2026 earnings release (8-K Ex. 99.1) · Stryker Corporation (SEC EDGAR) · Tier 1: company or exchange filing · Jul 30, 2026
- S13Q3 2026 earnings release (8-K Ex. 99.1) · Stryker Corporation (SEC EDGAR) · Tier 1: company or exchange filing · Oct 29, 2026
- S142026 proxy statement (DEF 14A) · Stryker Corporation (SEC EDGAR) · Tier 1: company or exchange filing · Mar 23, 2026
- S158-K (Item 8.01): recast of 2025 10-K items for the 2026 segment reorganization, Ex. 99.1 · Stryker Corporation (SEC EDGAR) · Tier 1: company or exchange filing · Jun 26, 2026
- S168-K (Item 8.01): cybersecurity incident identified Mar 11, 2026 · Stryker Corporation (SEC EDGAR) · Tier 1: company or exchange filing · Mar 11, 2026
- S178-K/A (Item 1.05): material cybersecurity incident · Stryker Corporation (SEC EDGAR) · Tier 1: company or exchange filing · Apr 9, 2026
- S188-K (Item 7.01): cybersecurity incident update by the CISO · Stryker Corporation (SEC EDGAR) · Tier 1: company or exchange filing · Mar 12, 2026
- S198-K (Item 5.02) Ex. 99.1: Spencer Stiles to succeed Kevin Lobo as CEO on Jan 1, 2027 · Stryker Corporation (SEC EDGAR) · Tier 1: company or exchange filing · Oct 6, 2026
- S208-K (Item 5.02) Ex. 99.1: Spencer Stiles named President and COO · Stryker Corporation (SEC EDGAR) · Tier 1: company or exchange filing · Dec 4, 2025
- S218-K (Item 2.01): completion of the Inari Medical acquisition · Stryker Corporation (SEC EDGAR) · Tier 1: company or exchange filing · Feb 19, 2025
- S228-K (Item 1.01) Ex. 99.1: agreement to acquire Inari Medical · Stryker Corporation (SEC EDGAR) · Tier 1: company or exchange filing · Jan 7, 2025
- S23Schedule 13G: Vanguard Capital Management LLC (event Mar 31, 2026) · Vanguard Capital Management LLC (SEC EDGAR) · Tier 1: company or exchange filing · Apr 30, 2026
- S24Schedule 13D/A: Ronda E. Stryker (event Feb 27, 2026) · Ronda E. Stryker (SEC EDGAR) · Tier 1: company or exchange filing · Apr 14, 2026
- S25Schedule 13G/A: Greenleaf Trust (event Dec 31, 2025) · Greenleaf Trust (SEC EDGAR) · Tier 1: company or exchange filing · Feb 11, 2026
- S26SYK historical prices, Oct 29 to Nov 5, 2026 (closing price Nov 5, 2026) · Nasdaq · Tier 1: company or exchange filing · Nov 5, 2026
- S27EDGAR submissions record: Stryker Corp (CIK 0000310764) · SEC (data.sec.gov) · Tier 1: company or exchange filing · Nov 7, 2026
- S288-K (Item 5.02): chief accounting officer transition · Stryker Corporation (SEC EDGAR) · Tier 1: company or exchange filing · May 20, 2026
- S298-K (Items 1.01, 2.03): $3.0 billion revolving credit agreement · Stryker Corporation (SEC EDGAR) · Tier 1: company or exchange filing · Feb 27, 2025
- S30Schedule 13G/A: The Vanguard Group (0%) · The Vanguard Group (SEC EDGAR) · Tier 1: company or exchange filing · Mar 27, 2026
- S31XBRL company facts: Stryker Corp (quarter-end debt split and cash) · SEC (data.sec.gov) · Tier 1: company or exchange filing · Nov 7, 2026
- S328-K (Item 7.01) Ex. 99.1: Unit 42 status letter on the cybersecurity incident · Stryker Corporation (SEC EDGAR) · Tier 1: company or exchange filing · Mar 23, 2026
Changes to this page (v1 · Nov 6, 2026)
- v1 · Nov 6, 2026First version. (first version)
Numbers come only from tier 1 and tier 2 sources. Read how we research.
Disclaimer
For learning only. Cityfort is not a registered investment adviser or broker-dealer and does not recommend buying or selling any security. Prices shown are dated and may be out of date.
Investing in securities involves risk, including loss of capital. Before making any investment decision, do your own research and consider consulting a registered investment adviser or other qualified professional.
Cityfort, its owners and contributors may or may not hold securities of companies covered. Cityfort is not paid by any company it covers. Content is not an offer or solicitation to buy or sell any security, including in any initial public offering.
Read the positions policyRead the full disclaimerHide the full disclaimer
Cityfort publishes general educational content that explains how listed companies work. Cityfort is not registered with the US Securities and Exchange Commission or any state securities regulator as an investment adviser, and is not a broker-dealer or a member of FINRA. Cityfort does not provide investment, tax or legal advice, recommendations, ratings, price targets or any opinion on whether to buy, sell or hold any security. Nothing on the site is tailored to any person's circumstances.
All information is taken from publicly available sources, mainly company filings with the SEC, which are listed on each page with dates. We work to keep it accurate and correct errors publicly, but we do not guarantee that it is complete, accurate or up to date. Any market price or price-based ratio shown is dated, may be out of date by the time you read it, and is included only to explain concepts.
Statements by company management, including forward-looking statements and guidance, are reported as the company's statements, with their date and source; they are not our forecasts. Adjusted (non-GAAP) figures are the company's own measures and are shown next to the official (GAAP) figures.