Health Care · NYSE: TMO
Thermo Fisher: how the business works
Thermo Fisher Scientific sells lab instruments, lab supplies and drug development services to drugmakers, hospitals, universities and labs, with revenue of $44.6 billion in FY2025.
By Hardik Bhandare · Checked against filings: . Editorial policy. Corrections
Follow Thermo Fisher
Email me when Thermo Fisher's page is updated after earnings.
We'll send a confirmation email first. See our privacy policy.
Thermo Fisher Scientific Inc. · Waltham, Massachusetts
Updated for Q3 FY2026 · checked
- Revenue, FY2025
- $44.6B
- Net income, FY2025
- $6.7B
- Revenue, Q3 FY2026 (up 9% from a year earlier)
- $12.14B
- Consumables and services, share of FY2025 revenue
- 83.6%
- Employees, Dec 31, 2025
- About 125,000
The short version
Thermo Fisher in 5 points
1 · What it sells
Thermo Fisher sells lab supplies, instruments and services for drug companies: consumables were $18.7 billion of FY2025 revenue of $44.6 billion, services $18.6 billion and instruments $7.3 billion.
2 · Who pays it
Thermo Fisher does not split revenue by customer type, but by region North America was 51.7% of FY2025 revenue, Europe 26.5%, Asia-Pacific 18.2% and other regions 3.6%.
3 · What it keeps from $100
Of every $100 that came in during FY2025, Thermo Fisher kept $14.7 as net income, after interest income of $993 million and a 7.5% tax rate lowered by deferred tax benefits from domestication transactions and capital losses, while operating income was $17.4 per $100 of revenue.
4 · Where the operating profit comes from
Of FY2025 segment income of $10.1 billion, a company measure before amortization and restructuring, Life Sciences Solutions earned $3.77 billion, Laboratory Products and Biopharma Services $3.35 billion, Analytical Instruments $1.74 billion and Specialty Diagnostics $1.26 billion, against GAAP operating income of $7.7 billion.
5 · The one thing to watch
Thermo Fisher paid $8.875 billion in cash for Clario in March 2026, and net debt rose from $29.3 billion at Dec 31, 2025 to $35.3 billion at Sep 26, 2026.
Sources: From Thermo Fisher's FY2025 10-K, Q3 FY2026 10-Q and the 8-K on the Clario purchase · checked
See the full receipt and the management scorecard below
01Where the money goes · FY2025
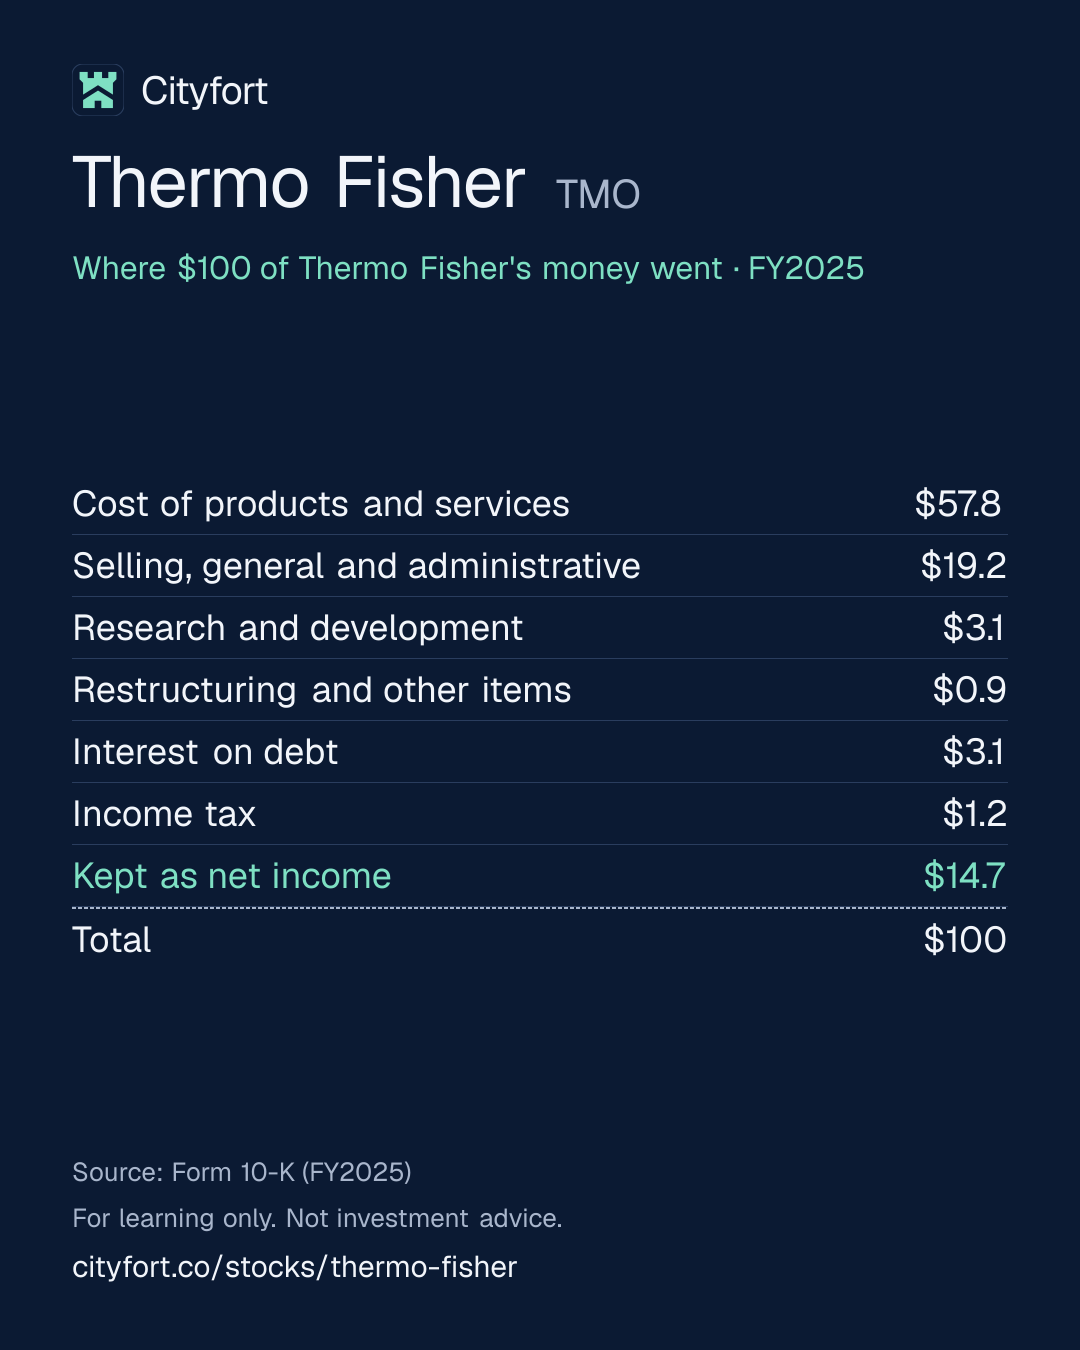
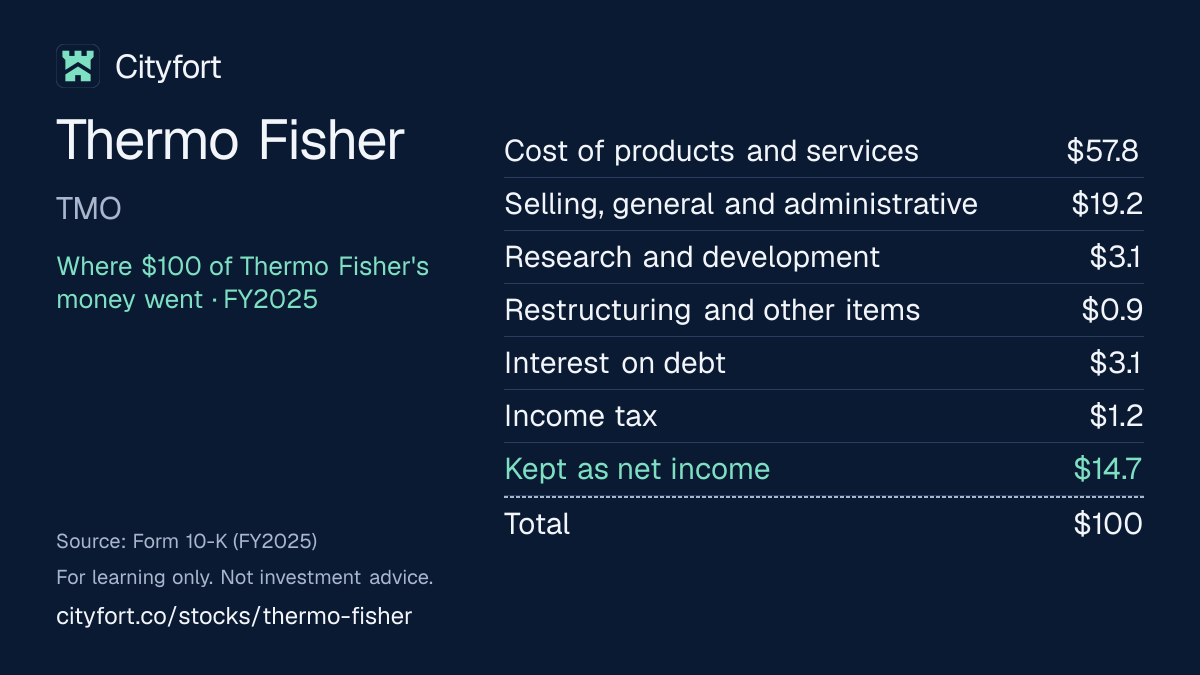
Where does $100 of Thermo Fisher's money go?
Thermo Fisher · FY2025
Receipt for every $100
| Cost of products and services | $57.8 |
|---|---|
| Selling, general and administrative | $19.2 |
| Research and development | $3.1 |
| Restructuring and other items | $0.9 |
| Interest on debt | $3.1 |
| Income tax | $1.2 |
| Kept as net income | $14.7 |
| Total | $100 |
Each line = amount ÷ total money in × 100. Lines may not add to exactly $100 because of rounding.
How this is worked out
Cityfort calculation from the FY2025 10-K. Of every $100 that came in during FY2025 (revenue of $44,556 million plus $993 million of interest income): each line = line ÷ $45,549 million × 100. Restructuring and other items = restructuring and other costs ($362 million), other expense ($12 million), losses of companies it partly owns ($41 million) and the share of partners in subsidiaries ($17 million). The 10-K spreads $1,730 million of amortization of acquired intangible assets across cost of revenue and SG&A.
Save this receipt as an image:
1080 × 1350 PNG for Instagram, LinkedIn1200 × 675 PNG for X
Embed this receipt
Paste this code into a blog or website to show the receipt, with a link back to this page:
Each week: one company explained in 5 points, picked by earnings date.
Free, no tips, unsubscribe anytime.
We'll send a confirmation email. See our privacy policy.
02The business in one line
What does Thermo Fisher do?
Drugmakers, hospitals, universities and other labs pay Thermo Fisher for instruments, the supplies that run them and services such as clinical trials; in FY2025, making those products and services took $57.8 of every $100 that came in, and $14.7 was left as net income.
- Consumables such as reagents were $18.7 billion of FY2025 revenue, services $18.6 billion and instruments $7.3 billion.
- Revenue was $44.6 billion in FY2025, below FY2022's $44.9 billion, the first full year with PPD, a year that still included COVID-19 testing and vaccine work. In Q3 FY2026 it was $12.14 billion, up 9% from a year earlier.
03Who pays it
Who pays Thermo Fisher?
Pharmaceutical and biotech companies
Not disclosed
Buy reagents and production supplies, and pay for clinical trials, drug development and manufacturing. The FY2025 10-K says revenue from this market grew in 2025.
Universities, research institutions and government agencies
Not disclosed
Buy instruments and supplies for research. The FY2025 10-K says revenue from academic and government customers fell in 2025, with uncertainty in the US and conditions in China.
Hospitals and clinical labs
Not disclosed
Buy diagnostic tests, transplant tests and supplies through the healthcare market channel.
Industrial and environmental labs
Not disclosed
Buy analytical instruments for quality control, process control, environmental testing and chip manufacturing.
How spread out the customers are
Thermo Fisher does not disclose revenue by customer type or a share for its largest customers. By region, North America was 51.7% of FY2025 revenue, Europe 26.5%, Asia-Pacific 18.2% and other regions 3.6% (Cityfort calculation from the FY2025 10-K).
04Why it makes money
Why does Thermo Fisher make money?
Most of Thermo Fisher's revenue comes from consumables and services that customers buy again, so profit follows how much labs and drugmakers keep spending.
Consumables and services were 83.6% of FY2025 revenue. COVID-19 testing and vaccine work lifted profit in FY2021: operating income was $25.6 per $100 of revenue that year. As that demand faded it fell to $16.0 in FY2023, and it was $17.4 in FY2025.
Operating income per $100 of revenue
$25.6$17.4
FY2021 to FY2025
- Thermo Fisher sells instruments to labs and factories
- Customers buy reagents and other supplies to use with them
- Its distribution channel delivers its own and other makers' products to the same labs
- Drugmakers also pay it to run trials and make medicines
- Cash from operations pays mainly for acquisitions, then buybacks and dividends
↺ Step 5 feeds back into step 1.
05Business segments · FY2025
Which businesses make up Thermo Fisher?
Laboratory Products and Biopharma Services
54%Lab products, the Fisher Scientific distribution channel, drug manufacturing for other companies and clinical research. Segment income was $3.35 billion, a 14.0% margin. Sales to outside customers were $23.8 billion, 53.5% of total revenue.
Revenue $24.0B · Operating profit $3.4B
Life Sciences Solutions
20%Reagents, instruments and supplies for biology research and drug production, including the filtration business bought in 2025. Segment income was $3.77 billion, a 36.3% margin. Sales to outside customers were $8.8 billion, 19.7% of total revenue.
Revenue $10.4B · Operating profit $3.8B
Analytical Instruments
17%Chromatography and mass spectrometry, chemical analysis and electron microscopes. Segment income was $1.74 billion, a 23.0% margin, down from 26.2% in FY2024. Sales to outside customers were $7.4 billion, 16.5% of total revenue.
Revenue $7.6B · Operating profit $1.7B
Specialty Diagnostics
10%Diagnostic tests, transplant tests and the healthcare market channel; microbiology was sold in August 2026. Segment income was $1.26 billion, a 26.9% margin. Sales to outside customers were $4.6 billion, 10.3% of total revenue.
Revenue $4.7B · Operating profit $1.3B
How the mix changed
- Laboratory Products and Biopharma Services
- Life Sciences Solutions
- Analytical Instruments
- Specialty Diagnostics
Revenue by segment, FY2021 to FY2025.
US$
See the numbers
06The numbers · Consolidated · US$
How has Thermo Fisher done?
Revenue
$44.6BFY2025
Revenue reached $44.9 billion in FY2022, the first full year with PPD, a year that still included COVID-19 testing and vaccine work, was $42.9 billion in FY2023 and FY2024 and $44.6 billion in FY2025; Q3 FY2026 revenue of $12.14 billion was 9% above a year earlier.
US$
See the numbers
Net profit
$6.7BFY2025
Net income fell from $7.7 billion in FY2021 to $6.0 billion in FY2023 as COVID-19 demand faded, then rose to $6.7 billion in FY2025; Q3 FY2026 net income was $1.72 billion, up 6.5% from a year earlier.
US$
See the numbers
Profit kept per $100 of revenue
$15.0FY2025
Net income per $100 of revenue fell from $19.7 in FY2021 to $14.0 in FY2023 and was $15.0 in FY2025, when operating income was $17.4 per $100 after $1.73 billion of amortization of acquired intangible assets.
$ of profit per $100 of revenue (net margin)
See the numbers
Free cash flow
$6.3BFY2025
Cash from operations minus capital spending was between $6.8 billion and $7.3 billion from FY2021 to FY2024 and $6.3 billion in FY2025, a year in which Thermo Fisher also spent $4.0 billion buying businesses.
US$ · cash from operations minus spending on plants and equipment
See the numbers
See all yearly numbers
EBITDA here = operating income plus depreciation and amortization (from the cash flow statement). Fiscal years are the company's own (Dec 31 (fiscal year = calendar year; quarters end on a Saturday near the quarter end)). Net profit is the share belonging to the company's owners.
Download Thermo Fisher's yearly and quarterly numbers (CSV, with source ids)
Learn: Fiscal years that don't end in December: Nvidia's FY2027 explained · Stock-based compensation and dilution: pay that becomes shares
Sources (11)
- Form 10-K for fiscal 2023 (year ended Dec 31, 2023)
- Form 10-K for fiscal 2025 (year ended Dec 31, 2025)
- Q4 and full-year 2024 earnings release (Form 8-K, Exhibit 99.1)
- Q1 2025 earnings release (Form 8-K, Exhibit 99.1)
- Q2 2025 earnings release (Form 8-K, Exhibit 99.1)
- Q3 2025 earnings release (Form 8-K, Exhibit 99.1)
- Q4 and full-year 2025 earnings release (Form 8-K, Exhibit 99.1)
- Q1 2026 earnings release (Form 8-K, Exhibit 99.1)
- Q2 2026 earnings release (Form 8-K, Exhibit 99.1)
- Q3 2026 earnings release (Form 8-K, Exhibit 99.1)
- Form 10-Q for Q3 2026 (quarter ended Sep 26, 2026)
07Who runs it
Who runs Thermo Fisher, and did they deliver?
Marc N. Casper
Chairman and Chief Executive Officer · since 2009
President and CEO since 2009 and later also chairman; an executive officer since 2001. His title became Chairman and CEO on Mar 1, 2026. 2025 total pay was $79.9 million, including a five-year performance award with a target value of about $60 million.
Gianluca Pettiti
President and Chief Operating Officer · since 2026
Took the role on Mar 1, 2026; Chief Operating Officer Michel Lagarde left on Mar 31, 2026. An executive officer since 2021, he earlier ran the Specialty Diagnostics segment.
James R. Meyer
Senior Vice President and Chief Financial Officer · since 2026
CFO from Mar 1, 2026, succeeding Stephen Williamson, who retired on Mar 31, 2026. He joined Thermo Fisher in 2009.
What they said, and what happened
1 delivered · 5 too early to tell
Said on Oct 29, 2025
Thermo Fisher said it expected to complete the Clario purchase by the middle of 2026.
DeliveredWhat happened
Completed on Mar 24, 2026.
Said on Oct 29, 2025
Thermo Fisher said Clario adds $0.45 of adjusted EPS in the first year after closing.
Too early to tellWhat happened
The first year after closing ends in March 2027. The Q3 FY2026 10-Q says clinical research revenue rose $425 million from a year earlier, mainly from Clario.
Said on Sep 2, 2025
Thermo Fisher said the Solventum filtration purchase was expected to reduce adjusted EPS by $0.06 in the first year of ownership.
Too early to tellWhat happened
The filings used for this page do not report the business's effect on EPS separately.
Said on Feb 26, 2026
Thermo Fisher said it expects 2026 capital spending, net of disposals, of $1.8 billion to $2.0 billion.
Too early to tellWhat happened
Capital spending net of disposals was $1.25 billion in the first nine months of 2026 (Cityfort calculation from the Q3 FY2026 earnings release).
Said on Feb 26, 2026
Thermo Fisher said it expects its 2026 GAAP tax rate to be between 7% and 9%.
Too early to tellWhat happened
The full-year rate will be reported in the FY2026 10-K.
Said on Feb 26, 2026
Thermo Fisher said restructuring actions already identified would bring about $250 million of further charges, mainly in 2026.
Too early to tellWhat happened
The FY2026 10-K will show the year's restructuring charges.
Sources (10)
- Form 10-K for fiscal 2025 (year ended Dec 31, 2025)
- Form 8-K filed Jan 12, 2026 (Item 5.02: COO and EVP departures; new structure from Mar 1, 2026)
- 2026 proxy statement (DEF 14A)
- Form 8-K filed May 22, 2025 (Item 5.02: CEO performance award)
- Form 8-K filed Jul 23, 2025 (Item 5.02: CFO succession)
- Form 8-K filed Oct 29, 2025 (Item 8.01, Exhibit 99.1: agreement to acquire Clario)
- Form 8-K filed Mar 24, 2026 (Item 8.01, Exhibit 99.1: Clario acquisition completed)
- Form 10-Q for Q3 2026 (quarter ended Sep 26, 2026)
- Form 8-K filed Sep 2, 2025 (Item 8.01, Exhibit 99.1: Solventum purification and filtration acquisition completed)
- Q3 2026 earnings release (Form 8-K, Exhibit 99.1)
08What could go wrong
What could go wrong for Thermo Fisher?
- Debt
More debt after acquisitions
Debt rose from $31.3 billion at Dec 31, 2024 to $41.4 billion at Sep 26, 2026, after the filtration and Clario purchases and $7.0 billion of buybacks. Interest expense was $417 million in Q3 FY2026, up from $347 million a year earlier.
Watch Net debt and interest expense in each 10-Q; buyback amounts.
- Demand
Customers' budgets and research funding
The FY2025 10-K says demand for some products depends on customers' capital spending and government funding policies. Academic and government revenue fell in 2025, and sales in China declined.
Watch End-market comments in each 10-Q, especially academic and government and China.
- Regulation
Tariffs and trade rules
The 10-K lists US and foreign tariffs, trade barriers and Chinese rules favoring local suppliers among its risks. It names tariffs and related currency effects among the reasons Analytical Instruments' margin fell from 26.2% to 23.0% in FY2025.
Watch Analytical Instruments segment margin each quarter; trade rule changes.
- Execution
Making acquisitions pay off
Goodwill from acquisitions was $54.3 billion at Sep 26, 2026, close to total equity of $54.8 billion. Clario, bought for $8.875 billion, added $5.9 billion of goodwill. If a business underperforms, goodwill can be written down.
Watch Clario's contribution to clinical research revenue; any impairment charge.
- Governance
Shareholder votes on pay and leadership turnover
Shareholders rejected the advisory pay vote in 2026, after about 36% support in 2025. The CFO, the COO and two executive vice presidents changed or are leaving between February and December 2026.
Watch The 2027 proxy's pay changes and say-on-pay result; 8-K officer changes.
- Other
Low tax rate from one-time benefits
The GAAP tax rate was 7.5% in FY2025, helped by deferred tax benefits, and the auditor named income taxes a critical audit matter. Thermo Fisher expects 7% to 9% in 2026.
Watch The effective tax rate in each 10-Q and the FY2026 10-K.
- Competition
Competition in every market
The 10-K says Thermo Fisher faces aggressive and able competition in virtually all of its markets, from manufacturers, distributors and service providers, and competes with some of its own large customers and suppliers.
Watch Segment margins and organic growth each quarter.
Sources (10)
- Form 10-K for fiscal 2025 (year ended Dec 31, 2025)
- Form 10-Q for Q3 2026 (quarter ended Sep 26, 2026)
- Q3 2026 earnings release (Form 8-K, Exhibit 99.1)
- Q3 2025 earnings release (Form 8-K, Exhibit 99.1)
- Form 8-K filed Mar 24, 2026 (Item 8.01, Exhibit 99.1: Clario acquisition completed)
- Form 8-K filed May 26, 2026 (Item 5.07, 2026 annual meeting vote results)
- 2026 proxy statement (DEF 14A)
- Form 8-K filed Jul 23, 2025 (Item 5.02: CFO succession)
- Form 8-K filed Jan 12, 2026 (Item 5.02: COO and EVP departures; new structure from Mar 1, 2026)
- Form 8-K filed Oct 30, 2026 (Item 5.02: EVP Michael Shafer to retire)
09Both sides
What do supporters and critics point to?
What supporters point to
- Q3 FY2026 revenue rose 9% from a year earlier to $12.14 billion, and organic growth, the company's measure, was 6%.
- Consumables and services were 83.6% of FY2025 revenue.
- Cash from operations minus capital spending was $6.3 billion in FY2025 and between $6.8 billion and $7.3 billion in each of FY2021 to FY2024.
- Remaining performance obligations were $29.87 billion at Sep 26, 2026, up from $26.46 billion a year earlier.
- The quarterly dividend rose to $0.47 in 2026 from $0.43, and buybacks were $4.0 billion in the first nine months of 2026.
What critics point to
- FY2025 revenue of $44.6 billion was below FY2022's $44.9 billion, and FY2025 diluted EPS of $17.74 was below FY2021's $19.46.
- Net debt rose from $25.7 billion at Dec 31, 2024 and $29.3 billion at Dec 31, 2025 to $35.3 billion at Sep 26, 2026.
- Goodwill of $54.3 billion at Sep 26, 2026 was close to total equity of $54.8 billion.
- Shareholders voted 214.5 million to 99.9 million against the 2026 pay proposal, after CEO pay of $79.9 million in 2025.
- The FY2025 GAAP tax rate of 7.5% was helped by deferred tax benefits.
10What to watch next
What should you watch next at Thermo Fisher?
Next event
Q4 FY2026 results
Date not announced yet.
Clario's first year
Thermo Fisher said on Oct 29, 2025, when it agreed to buy Clario, that Clario adds $0.45 of adjusted EPS in the first year after closing; the deal closed on Mar 24, 2026. Clinical research revenue rose $425 million in Q3 FY2026, mainly from Clario.
Net debt and buybacks
Net debt was $35.3 billion at Sep 26, 2026. Thermo Fisher announced a new buyback authorization and its next dividend in press releases on Nov 5, 2026; the 10-K and 10-Qs show what is spent.
Organic growth and end markets
Organic growth, the company's measure, was 1% in Q1 FY2026 and 6% in Q3. Academic and government demand was flat in Q3.
11Key dates
What are the key dates for Thermo Fisher?
| Event | Date | Source |
|---|---|---|
| Executive Vice President Michael Shafer retiresThermo Fisher reported his planned retirement in an 8-K filed Oct 30, 2026. | Form 8-K filed Oct 30, 2026 (Item 5.02: EVP Michael Shafer to retire) | |
| New share buyback authorization and next quarterly dividend announcedAnnounced in company press releases; the amounts will appear in later SEC filings. The new authorization replaces what was left of the November 2025 one. | Thermo Fisher Scientific Authorizes $5 Billion of Share Repurchases (press release); Thermo Fisher Scientific Announces Quarterly Dividend (press release, Nov 5, 2026) |
Learn: What is an 8-K? A company's news report, with a real Adobe filing
12Key facts
Key facts about Thermo Fisher
- What does Thermo Fisher Scientific do?
- Thermo Fisher Scientific sells lab instruments, reagents and other lab supplies, diagnostic tests, and services that help drug companies run clinical trials and make medicines. Its customers include drugmakers, hospitals, universities and government labs. Revenue was $44.6 billion in FY2025 (year ended Dec 31, 2025).
- How does Thermo Fisher make money?
- Thermo Fisher makes most of its money from things customers buy again and again. In FY2025, consumables brought in $18.7 billion and services $18.6 billion, together 83.6% of revenue of $44.6 billion. Instruments brought in $7.3 billion.
- What is Thermo Fisher's business model?
- Thermo Fisher sells instruments and the supplies used with them, distributes its own and other companies' lab products through its Fisher Scientific channel, and runs clinical trials and makes drugs for drug companies. Its FY2025 10-K says it uses its capital mainly for acquisitions, then for buybacks and dividends.
- Is Thermo Fisher profitable?
- Yes. Thermo Fisher had net income of $6.7 billion and operating income of $7.7 billion in FY2025, on revenue of $44.6 billion. In Q3 FY2026 (quarter ended Sep 26, 2026), net income was $1.72 billion, up 6.5% from $1.62 billion a year earlier.
- What is Thermo Fisher's revenue by segment?
- In FY2025, Thermo Fisher's Laboratory Products and Biopharma Services segment had revenue of $24.0 billion and segment income of $3.35 billion. Life Sciences Solutions had $10.4 billion and $3.77 billion, Analytical Instruments $7.6 billion and $1.74 billion, and Specialty Diagnostics $4.7 billion and $1.26 billion. Segment income, a company measure before amortization and restructuring, totaled $10.1 billion, against GAAP operating income of $7.7 billion. Segment revenue includes $2.0 billion of sales between segments.
- How much does Thermo Fisher earn from services for drug companies?
- Thermo Fisher's clinical research business, which runs drug trials for drugmakers (PPD), had revenue of $7.9 billion in FY2025. Its pharma services business, which develops and makes drugs for other companies (Patheon), had $7.1 billion. Both sit in the Laboratory Products and Biopharma Services segment.
- How much does Thermo Fisher earn from lab instruments?
- Thermo Fisher's Analytical Instruments segment had revenue of $7.6 billion in FY2025. Chromatography and mass spectrometry, which separate and identify chemicals, brought in $3.4 billion, electron microscopy $3.0 billion and chemical analysis $1.2 billion. Instruments across all segments were $7.3 billion of revenue.
- Who are Thermo Fisher's customers?
- Thermo Fisher sells to pharmaceutical and biotech companies, hospitals and clinical labs, universities, research institutions and government agencies, and industrial and environmental labs. It does not split revenue by customer type. By region, North America was 51.7% of FY2025 revenue, Europe 26.5% and Asia-Pacific 18.2%.
- Who owns Thermo Fisher?
- Thermo Fisher has one class of common stock with one vote per share; 370.5 million shares were outstanding on Sep 26, 2026. Vanguard Capital Management reported 7.53% on Mar 31, 2026 and FMR LLC 6.0% on Sep 30, 2026. The 2026 proxy lists BlackRock at 7.62%, from a February 2024 filing, and directors and executive officers together at less than 1%.
- What were Thermo Fisher's latest quarterly results?
- Thermo Fisher's revenue was $12.14 billion in Q3 FY2026 (quarter ended Sep 26, 2026), up 9% from $11.12 billion in Q3 FY2025. Net income was $1.72 billion and diluted EPS $4.64, up from $4.27. The quarter included the Clario business, bought in March 2026.
Sources (6)
Terms on this page
- Capital expenditures (capex)
- Debt-to-equity
- Earnings per share (EPS)
- EBITDA
- Free cash flow
- Interest coverage
- Market cap
- Net debt
- Net margin
- P/E ratio
Each explains the term in plain English, with the same number from other companies on Cityfort.
Go deeper
More detail from the same filings. Open any section.
13What it sells
13What it sells
What does Thermo Fisher sell?
Consumables ($18.7B in FY2025)
Reagents, cell culture products, filters and other supplies that are used up in biology research, drug and vaccine production, and diagnosis.
Services ($18.6B)
Clinical research for drugmakers (PPD, $7.9B), drug development and manufacturing for other companies (Patheon, $7.1B), and instrument service. Clario, which collects clinical trial data, was added in March 2026.
Instruments ($7.3B)
Chromatography and mass spectrometry systems that separate and identify chemicals, electron microscopes, including for chipmakers, and chemical analysis equipment.
Lab supply distribution ($7.4B)
The research and safety market channel delivers Thermo Fisher's own, private-label and other companies' products to labs; a separate healthcare channel had $1.8B.
Diagnostics
Clinical diagnostics ($1.1B), immunodiagnostics ($0.9B) and transplant tests ($0.5B) in FY2025. The microbiology business was sold in August 2026.
Think of it like this
For a research lab, Thermo Fisher works like a supplier that sells the equipment, then keeps selling the ingredients the equipment uses.
What it does
- Does: Makes most of its money from consumables and services, 83.6% of FY2025 revenue
- Does: Runs clinical trials and makes drugs under contract for drug companies
- Does: Distributes other companies' lab products as well as its own
What it does not do
- Does not: Does not split its revenue by customer type, such as drugmakers versus universities
- Does not: Does not put its yearly outlook in its earnings releases: it gives it on the earnings call
- Does not: Does not depend on one supplier: its 10-K says no single supplier is material, though some materials have only one or a few sources
14How the money flows
14How the money flows · FY2025
How does money flow through Thermo Fisher?
Money in
- Products (instruments and consumables)$26.0B
- Services$18.6B
- Interest income$993M
The company
Thermo Fisher
$45.6B came in
Money out
- Cost of products and services$26.3B
- Selling, general and administrative$8.7B
- Research and development$1.4B
- Restructuring and other items$432M
- Interest on debt$1.4B
- Income tax$547M
- Net income$6.7B
- Customers paid Thermo Fisher $44.6 billion in FY2025: $26.0 billion for products and $18.6 billion for services.
- Making those products and delivering the services cost $26.3 billion.
- Selling and administration took $8.7 billion, research $1.4 billion and restructuring $362 million, leaving $7.7 billion of operating income.
- Interest earned added $993 million; interest on debt took $1.4 billion, tax $547 million and other items took $70 million.
- That left $6.7 billion of net income for shareholders.
15What it needs to run
15What it needs to run
What does Thermo Fisher need to run?
People
About 125,000 employees at Dec 31, 2025, about 59,000 of them in the Americas. About 14,000 work in sales.
Acquisitions
Thermo Fisher spent $30.3 billion buying businesses from FY2021 to FY2025 (Cityfort calculation from the FY2025 and FY2023 10-Ks), and total goodwill from past acquisitions was $49.4 billion at Dec 31, 2025.
Factories and labs
Property, plant and equipment was $10.6 billion at Dec 31, 2025. Capital spending was $1.5 billion in FY2025.
Research
Research and development cost $1.4 billion in FY2025, 3.1% of revenue.
Materials
The FY2025 10-K says no single supplier is material, but some materials come from only one or a few sources.
16Where it sells
16Where it sells · FY2025, by region as reported in the 10-K
Where does Thermo Fisher sell?
- North America52%
- Europe27%
- Asia-Pacific18%
- Other regions4%
17Where growth could come from
17Where growth could come from
Where could Thermo Fisher's growth come from?
At its Investor Day on May 20, 2026, Thermo Fisher said its growth strategy and capital deployment 'position the company to deliver 7% organic revenue CAGR and low-teens adjusted EPS growth over the long term' (company press release). In its FY2025 10-K (Feb 26, 2026) it said it expects 2026 capital spending, net of disposals, of $1.8 billion to $2.0 billion and a GAAP tax rate of 7% to 9%. It gives its 2026 revenue outlook only on its earnings calls.
Clario purchase
NewClinical research +$425M in Q3 FY2026
Thermo Fisher completed the $8.875 billion cash purchase of Clario, which collects clinical trial data, on Mar 24, 2026. The Q3 FY2026 10-Q says clinical research revenue rose $425 million from a year earlier, mainly from Clario.
Status: New, recently announced.
Drugmaker demand
WorkingOrganic growth 6% in Q3 FY2026
The Q3 FY2026 10-Q describes pharma and biotech demand as "very strong". Organic growth, the company's measure that leaves out acquisitions, sales of businesses and currency, rose from 1% in Q1 FY2026 to 6% in Q3.
Status: Working, on track against what the company said.
Filtration business for drug production
EarlyBioProduction $3.2B in FY2025
Thermo Fisher bought Solventum's purification and filtration business for about $4.0 billion in cash on Sep 1, 2025. BioProduction revenue was $3.2 billion in FY2025, up from $2.65 billion in FY2024, partly from the purchase.
Status: Early, too early to judge.
Universities and government labs
BehindFlat in Q3 FY2026
The FY2025 10-K says academic and government revenue fell in 2025. The Q3 FY2026 10-Q describes this market as flat.
Status: Behind, behind the company's own plan.
Analytical Instruments margin
MixedSegment margin 26.9% in Q3 FY2026
The segment's margin fell from 26.2% in FY2024 to 23.0% in FY2025; the 10-K names tariffs, related currency effects, investments and mix. It was 26.9% in Q3 FY2026, up from 22.6% a year earlier.
Status: Mixed, partly on track.
Status compares progress with what the company itself said it would do: Working = on track against what the company said; Mixed = partly on track; Behind = behind the company's own plan; New = recently announced; Early = too early to judge.
Sources (8)
- Thermo Fisher Scientific Highlights Industry Leadership, Growth Outlook and Long-Term Value Creation at 2026 Investor Day (press release)
- Form 10-K for fiscal 2025 (year ended Dec 31, 2025)
- Q3 2026 earnings release (Form 8-K, Exhibit 99.1)
- Form 8-K filed Mar 24, 2026 (Item 8.01, Exhibit 99.1: Clario acquisition completed)
- Form 10-Q for Q3 2026 (quarter ended Sep 26, 2026)
- Q1 2026 earnings release (Form 8-K, Exhibit 99.1)
- Form 8-K filed Sep 2, 2025 (Item 8.01, Exhibit 99.1: Solventum purification and filtration acquisition completed)
- Q3 2025 earnings release (Form 8-K, Exhibit 99.1)
18The company's own measures (non-GAAP)
18The company's own measures · FY2025 and Q3 FY2026
What do Thermo Fisher's own measures show?
Official (GAAP): Operating income, FY2025
$7.7B
Company's own measure: Adjusted operating income, FY2025
$10.1B
Thermo Fisher leaves out $1.73 billion of amortization of acquired intangible assets, restructuring costs and some other charges. It equals the total of its four segments' income.
Official (GAAP): Diluted EPS, FY2025
$17.74
Company's own measure: Adjusted EPS, FY2025
$22.87
Leaves out the same items after tax; amortization alone added $4.58 a share, and tax items took $1.21 off.
Official (GAAP): Diluted EPS, Q3 FY2026
$4.64
Company's own measure: Adjusted EPS, Q3 FY2026
$6.68
Amortization added $1.40 a share and restructuring and other costs, including a $244 million loss on a factory being sold, $0.54.
Official (GAAP): Reported revenue growth, Q3 FY2026
9.1%
Company's own measure: Organic revenue growth, Q3 FY2026
6%
Growth leaving out businesses bought and sold and currency changes; acquisitions and sales of businesses added 3 points.
Official (GAAP): Cash flow from operations, FY2025
$7.8B
Company's own measure: Free cash flow (Thermo Fisher's definition), FY2025
$6.3B
Thermo Fisher subtracts capital spending and adds back money from selling property and equipment ($44 million). The free cash flowCash from operations minus spending on buildings and equipment. Learn more in "The numbers" subtracts capital spending only: $6,293 million.
These are the company's own measures, defined by the company. They are not comparable across companies, and they are not added together. Each sits beside the nearest official (GAAP) figure.
Learn: Non-GAAP measures: what a company's "adjusted" numbers leave out
19Financial strength and debt
19Financial strength · Sep 26, 2026
How much debt does Thermo Fisher have?
- Total debt$41.4B
- Cash and investments$6.1B
- Net debt (debt minus cash)$35.3B
- Net worth (shareholders' money)$54.8B
- Debt to equity
- 0.76×
- $ of debt for every $1 of shareholders' money
- Interest cover
- 5.5×
- how many times operating profit covers interest
- Net debt is a Cityfort calculation from the Q3 FY2026 10-Q: debt of $41,370 million, including finance leases, minus cash of $5,461 million and short-term investments of $600 million. On the same basis it was $25,705 million at Dec 31, 2024 and $29,280 million at Dec 31, 2025 (Cityfort calculation from the FY2025 10-K).
- Cash from operations for the four quarters is a Cityfort calculation from the Q4 FY2025 and Q3 FY2026 earnings releases ($3,457 million plus $5,867 million). Interest coverage of 5.5 is operating income of $8,468 million divided by interest expense of $1,537 million over the same four quarters (Cityfort calculation from the Q4 FY2025 to Q3 FY2026 earnings releases).
- Net worth is total equity of $54,767 million at Sep 26, 2026. Goodwill from acquisitions was $54,263 million at that date, up from $49,362 million at Dec 31, 2025 after the Clario purchase.
- At Dec 31, 2025, $3,528 million of borrowings were due in 2026, about $3.1 billion to $3.3 billion in each of 2027 to 2030, and $23,366 million later. A $5.0 billion credit line, expiring Jan 7, 2028, was undrawn.
- In February 2026 Thermo Fisher issued $3.8 billion of notes due 2031 to 2046, at rates from 4.215% to 5.546%. Operating lease liabilities ($1,470 million at Dec 31, 2025) are not counted as debt here.
Sources (8)
- Form 10-Q for Q3 2026 (quarter ended Sep 26, 2026)
- Q3 2026 earnings release (Form 8-K, Exhibit 99.1)
- Q4 and full-year 2025 earnings release (Form 8-K, Exhibit 99.1)
- Q1 2026 earnings release (Form 8-K, Exhibit 99.1)
- Q2 2026 earnings release (Form 8-K, Exhibit 99.1)
- Form 10-K for fiscal 2025 (year ended Dec 31, 2025)
- Free writing prospectus: pricing term sheet for $3.8B senior notes (Feb 9, 2026)
- Form 8-K filed Feb 12, 2026 (Items 1.01, 8.01: senior notes issued)
20Who owns it
20Who owns it · ownership as of Feb 28, 2026
Who owns Thermo Fisher?
Share classes
Holders of 5% or more
From the company's proxy statement (DEF 14A), later Schedule 13G filings and the share counts on its latest annual or quarterly report. Each holder row shows the date of its own filing.
Insider trades · Form 4 data as of Nov 6, 2026
What did Thermo Fisher's insiders report trading?
Thermo Fisher's insiders made 83 Form 4A filing an insider must make within two business days of buying or selling the company's shares. Learn more filings in the 12 months to Nov 6, 2026.
They reported no purchases and 144 sales (249,630.577 shares) in the open market or privately (codes P and S).
132 of the 144 sales were on forms with the Rule 10b5-1 plan box checked.
The same filings report 101 other share transactions (F: 47, M: 27, A: 24, G: 3).
They also report 53 transactions in options, stock units or other derivatives.
Insiders are a company's officers, directors and owners of more than 10% of a class of its shares. Most changes in their holdings must be reported to the SEC on a Form 4 within two business days. Source: SEC Form 4 filings on EDGAR.
- P
- a purchase in the open market or privately
- S
- a sale in the open market or privately
- A
- a grant, award or other acquisition from the company under Rule 16b-3
- F
- shares withheld or handed over to pay an exercise price or tax when an award is received, exercised or vests
- M
- exercise or conversion of an option or other derivative, exempt under Rule 16b-3
- G
- a bona fide gift
Code meanings: General Instruction 8 of Form 4 (SEC).
The latest 25 of 245 transactions
Shares: A = acquired, D = disposed of. A price the filing gives only in a footnote shows as “See filing”. The 10b5-1 box is checked when at least one trade on the form was made under a Rule 10b5-1 plan. A Form 4/A replaces the form it amends. See all of Thermo Fisher's Form 4 filings on EDGAR.
Learn: How to read a proxy statement (DEF 14A): Nvidia's 2026 proxy · Form 4 insider filings: who files, the codes and the footnotes · Rule 10b5-1 trading plans: how insiders pre-schedule their trades
Sources (6)
21What it does with profit
21What it does with profit
What does Thermo Fisher do with its profit?
Dividend per share
$1.72FY2025
Dividend paid for each share, by financial year.
$ per share
See the numbers
Buyback · Dec 31, 2024
Bought 7.4 million shares for $4.0 billion during FY2024.
$4.0B
Buyback · Dec 31, 2025
Bought 5.8 million shares for $3.0 billion during FY2025.
$3.0B
Buyback · Sep 26, 2026
Bought 6.9 million shares for $4.0 billion in the first nine months of 2026, none in Q3; $1.0 billion remained under the November 2025 authorization at Sep 26, 2026.
$4.0B
Money raised · Feb 12, 2026
Issued $3.8 billion of notes: $1.0 billion at 4.215% due 2031, $750 million at 4.550% due 2033, $1.3 billion at 4.902% due 2036 and $750 million at 5.546% due 2046.
$3.8B
Sources (5)
22Governance signals
22Governance signals
What do Thermo Fisher's governance filings show?
- Auditor
- PricewaterhouseCoopers LLP, since 2002
- Auditor changes
- None in the period covered
- Audit qualifications
- None reported
- Related-party dealings
- Thermo Fisher's 2026 proxy says its Audit Committee reviews and approves in advance any transaction over $120,000 in which a director, executive officer, certain shareholders or their families have a material interest.
- Credit rating
- No public credit rating found in a search of rating agency sites on Nov 6, 2026
Flags to know about
other
Shareholders voted against executive pay in 2026
At the May 20, 2026 annual meeting, the advisory vote on executive pay was not approved: 99.9 million shares for and 214.5 million against. The 2025 vote received about 36% support.
other
CEO pay of $79.9 million in 2025
CEO Marc Casper's 2025 total pay included a performance award granted in May 2025 with a target value of about $60 million. It vests after five years, pays 50% to 125% of target based on shareholder return against the S&P 500, and shares are delivered in years 8 to 10.
other
Leadership changes in 2026
A new CFO and a new President and COO started on Mar 1, 2026; COO Michel Lagarde and Executive Vice President Frederick Lowery left, and Executive Vice President Michael Shafer retires on Dec 31, 2026.
other
Insiders may not hedge or use company stock as loan collateral
The 2026 proxy says the insider trading policy prohibits officers and directors from hedging Thermo Fisher stock or using it as collateral for loans.
disclosure
Yearly outlook only on calls; no customer split
Thermo Fisher's earnings releases say its outlook is given on the earnings call, not in the release. Its 10-K gives no revenue split by customer type and no share for its largest customers.
Sources (11)
- Form 10-K for fiscal 2025 (year ended Dec 31, 2025)
- 2026 proxy statement (DEF 14A)
- Form 10-Q for Q3 2026 (quarter ended Sep 26, 2026)
- Free writing prospectus: pricing term sheet for $3.8B senior notes (Feb 9, 2026)
- Form 8-K filed Feb 12, 2026 (Items 1.01, 8.01: senior notes issued)
- Form 8-K filed May 26, 2026 (Item 5.07, 2026 annual meeting vote results)
- Form 8-K filed May 22, 2025 (Item 5.02: CEO performance award)
- Form 8-K filed Jul 23, 2025 (Item 5.02: CFO succession)
- Form 8-K filed Jan 12, 2026 (Item 5.02: COO and EVP departures; new structure from Mar 1, 2026)
- Form 8-K filed Oct 30, 2026 (Item 5.02: EVP Michael Shafer to retire)
- Q3 2026 earnings release (Form 8-K, Exhibit 99.1)
23What the market paid
23What the market paid · price as of Nov 5, 2026
What did the market pay for Thermo Fisher on Nov 5, 2026?
Price as of Nov 5, 2026 (shown for education; prices change daily).
Price as of Nov 5, 2026: Thermo Fisher closed at $676.94, according to Nasdaq's historical price table (the stock trades on the NYSE). Times 370.5 million shares (Sep 26, 2026), that is a market value of about $250.8 billion (Cityfort calculation from the Nov 5, 2026 closing price and the Q3 FY2026 10-Q cover). P/E is price ÷ earnings per share: 35.7 on diluted EPS of $18.96 for the four quarters to Sep 26, 2026 (Cityfort calculation from the Q4 FY2025 to Q3 FY2026 earnings releases). EV/EBITDA adds net debt of $35.3 billion to market value, then divides by EBITDA of $11.6 billion for the same four quarters: 24.7. The $0.47 quarterly dividend is $1.88 a year, or 0.28% of that price.
- Share price
- $676.94
- Market value (market cap)
- $250.8B
- P/E
- 35.7×
- EV/EBITDA
- 24.7×
More price-based ratios · as of Nov 5, 2026
Each ratio divides a number from the company's filings by the market value or share price on Nov 5, 2026. Prices change daily, so these ratios do too.
Price to sales (P/S)
5.3×
$250.8B market value ÷ $47.4B revenue (four quarters to Sep 26, 2026) = 5.3×
Cityfort calculation from the Nov 5, 2026 closing price and the Q4 FY2025 to Q3 FY2026 10-Qs and earnings releases. Source: TMO historical daily prices, Nasdaq table for an NYSE-listed share (close of Nov 5, 2026: $676.94); Form 10-Q for Q3 2026 (quarter ended Sep 26, 2026); Q3 2026 earnings release (Form 8-K, Exhibit 99.1) and 3 more
How price ratios workDividend yield
0.25%
$1.72 dividends per share (FY2025) ÷ $676.94 share price = 0.25%
Cityfort calculation from the FY2025 10-K and the Nov 5, 2026 closing price. Source: TMO historical daily prices, Nasdaq table for an NYSE-listed share (close of Nov 5, 2026: $676.94); Form 10-Q for Q3 2026 (quarter ended Sep 26, 2026); Q3 2026 earnings release (Form 8-K, Exhibit 99.1) and 4 more
What dividend yield meansFree cash flow yield
2.5%
$6.3B free cash flow (FY2025) ÷ $250.8B market value = 2.5%
Cityfort calculation from the FY2025 10-K and the Nov 5, 2026 closing price. Source: TMO historical daily prices, Nasdaq table for an NYSE-listed share (close of Nov 5, 2026: $676.94); Form 10-Q for Q3 2026 (quarter ended Sep 26, 2026); Q3 2026 earnings release (Form 8-K, Exhibit 99.1) and 4 more
What free cash flow means
Shares used for the market value: 370.5 million ($676.94 × 370.5 million shares ≈ $250.8B). Source: Form 10-Q for Q3 2026 (quarter ended Sep 26, 2026); Form 10-K for fiscal 2025 (year ended Dec 31, 2025)
Source: TMO historical daily prices, Nasdaq table for an NYSE-listed share (close of Nov 5, 2026: $676.94); Form 10-Q for Q3 2026 (quarter ended Sep 26, 2026); Q3 2026 earnings release (Form 8-K, Exhibit 99.1) and 3 more
Sources (7)
- TMO historical daily prices, Nasdaq table for an NYSE-listed share (close of Nov 5, 2026: $676.94)
- Form 10-Q for Q3 2026 (quarter ended Sep 26, 2026)
- Q3 2026 earnings release (Form 8-K, Exhibit 99.1)
- Q2 2026 earnings release (Form 8-K, Exhibit 99.1)
- Q1 2026 earnings release (Form 8-K, Exhibit 99.1)
- Q4 and full-year 2025 earnings release (Form 8-K, Exhibit 99.1)
- Form 10-K for fiscal 2025 (year ended Dec 31, 2025)
24How it got here
24How it got here
How did Thermo Fisher get here?
2021
Business-model change
Bought PPD, a clinical research company
Thermo Fisher bought PPD, which runs clinical trials for drugmakers, on Dec 8, 2021. PPD added $7.11 billion of revenue in 2022, its first full year.
2022
Milestone
Revenue reaches $44.9 billion
FY2022 revenue was $44.9 billion, the highest of FY2021 to FY2025, with COVID-19 testing and vaccine work and the first full year of PPD.
2023
Crisis
COVID-19 demand fades
Life Sciences Solutions revenue fell from $15.6 billion in FY2021 to $10.0 billion in FY2023, and net income fell to $6.0 billion.
2024
Milestone
Bought Olink
Thermo Fisher bought Olink, a Swedish company whose tools measure proteins in biological samples, on Jul 10, 2024.
2025
Business-model change
Bought a filtration business for drug production
Thermo Fisher paid about $4.0 billion in cash for Solventum's purification and filtration business on Sep 1, 2025. Shareholders gave about 36% support to the pay vote that year.
2026
Business-model change
Bought Clario for $8.875 billion
On Mar 24, 2026 Thermo Fisher completed its $8.875 billion cash purchase of Clario, which collects clinical trial data. It had issued $3.8 billion of notes in February 2026.
2026
Milestone
Sold microbiology; new leadership team
Thermo Fisher sold its microbiology business for about $1.07 billion on Aug 12, 2026. A new CFO and a new President and COO started on Mar 1, 2026.
Sources (10)
- Form 10-K for fiscal 2022 (year ended Dec 31, 2022)
- Form 10-K for fiscal 2023 (year ended Dec 31, 2023)
- Form 10-K for fiscal 2025 (year ended Dec 31, 2025)
- Form 8-K filed Sep 2, 2025 (Item 8.01, Exhibit 99.1: Solventum purification and filtration acquisition completed)
- 2026 proxy statement (DEF 14A)
- Form 8-K filed Mar 24, 2026 (Item 8.01, Exhibit 99.1: Clario acquisition completed)
- Form 8-K filed Feb 12, 2026 (Items 1.01, 8.01: senior notes issued)
- Form 10-Q for Q3 2026 (quarter ended Sep 26, 2026)
- Form 8-K filed Jul 23, 2025 (Item 5.02: CFO succession)
- Form 8-K filed Jan 12, 2026 (Item 5.02: COO and EVP departures; new structure from Mar 1, 2026)
25Sources and changes
Where every number on this page comes from
Sources (30 documents)
- S1Form 10-K for fiscal 2025 (year ended Dec 31, 2025) · Thermo Fisher Scientific Inc. (SEC EDGAR) · Tier 1: company or exchange filing · Feb 26, 2026
- S3Form 10-K for fiscal 2023 (year ended Dec 31, 2023) · Thermo Fisher Scientific Inc. (SEC EDGAR) · Tier 1: company or exchange filing · Feb 22, 2024
- S4Form 10-K for fiscal 2022 (year ended Dec 31, 2022) · Thermo Fisher Scientific Inc. (SEC EDGAR) · Tier 1: company or exchange filing · Feb 23, 2023
- S5Form 10-Q for Q3 2026 (quarter ended Sep 26, 2026) · Thermo Fisher Scientific Inc. (SEC EDGAR) · Tier 1: company or exchange filing · Oct 30, 2026
- S9Q3 2026 earnings release (Form 8-K, Exhibit 99.1) · Thermo Fisher Scientific Inc. (SEC EDGAR) · Tier 1: company or exchange filing · Oct 21, 2026
- S10Q2 2026 earnings release (Form 8-K, Exhibit 99.1) · Thermo Fisher Scientific Inc. (SEC EDGAR) · Tier 1: company or exchange filing · Jul 23, 2026
- S11Q1 2026 earnings release (Form 8-K, Exhibit 99.1) · Thermo Fisher Scientific Inc. (SEC EDGAR) · Tier 1: company or exchange filing · Apr 23, 2026
- S12Q4 and full-year 2025 earnings release (Form 8-K, Exhibit 99.1) · Thermo Fisher Scientific Inc. (SEC EDGAR) · Tier 1: company or exchange filing · Jan 29, 2026
- S13Q3 2025 earnings release (Form 8-K, Exhibit 99.1) · Thermo Fisher Scientific Inc. (SEC EDGAR) · Tier 1: company or exchange filing · Oct 22, 2025
- S14Q2 2025 earnings release (Form 8-K, Exhibit 99.1) · Thermo Fisher Scientific Inc. (SEC EDGAR) · Tier 1: company or exchange filing · Jul 23, 2025
- S15Q1 2025 earnings release (Form 8-K, Exhibit 99.1) · Thermo Fisher Scientific Inc. (SEC EDGAR) · Tier 1: company or exchange filing · Apr 23, 2025
- S16Q4 and full-year 2024 earnings release (Form 8-K, Exhibit 99.1) · Thermo Fisher Scientific Inc. (SEC EDGAR) · Tier 1: company or exchange filing · Jan 30, 2025
- S172026 proxy statement (DEF 14A) · Thermo Fisher Scientific Inc. (SEC EDGAR) · Tier 1: company or exchange filing · Apr 7, 2026
- S18Form 8-K filed May 26, 2026 (Item 5.07, 2026 annual meeting vote results) · Thermo Fisher Scientific Inc. (SEC EDGAR) · Tier 1: company or exchange filing · May 26, 2026
- S19Form 8-K filed Mar 24, 2026 (Item 8.01, Exhibit 99.1: Clario acquisition completed) · Thermo Fisher Scientific Inc. (SEC EDGAR) · Tier 1: company or exchange filing · Mar 24, 2026
- S20Form 8-K filed Oct 29, 2025 (Item 8.01, Exhibit 99.1: agreement to acquire Clario) · Thermo Fisher Scientific Inc. (SEC EDGAR) · Tier 1: company or exchange filing · Oct 29, 2025
- S21Form 8-K filed Sep 2, 2025 (Item 8.01, Exhibit 99.1: Solventum purification and filtration acquisition completed) · Thermo Fisher Scientific Inc. (SEC EDGAR) · Tier 1: company or exchange filing · Sep 2, 2025
- S23Form 8-K filed May 22, 2025 (Item 5.02: CEO performance award) · Thermo Fisher Scientific Inc. (SEC EDGAR) · Tier 1: company or exchange filing · May 22, 2025
- S24Form 8-K filed Jul 23, 2025 (Item 5.02: CFO succession) · Thermo Fisher Scientific Inc. (SEC EDGAR) · Tier 1: company or exchange filing · Jul 23, 2025
- S25Form 8-K filed Jan 12, 2026 (Item 5.02: COO and EVP departures; new structure from Mar 1, 2026) · Thermo Fisher Scientific Inc. (SEC EDGAR) · Tier 1: company or exchange filing · Jan 12, 2026
- S26Form 8-K filed Oct 30, 2026 (Item 5.02: EVP Michael Shafer to retire) · Thermo Fisher Scientific Inc. (SEC EDGAR) · Tier 1: company or exchange filing · Oct 30, 2026
- S27Free writing prospectus: pricing term sheet for $3.8B senior notes (Feb 9, 2026) · Thermo Fisher Scientific Inc. (SEC EDGAR) · Tier 1: company or exchange filing · Feb 9, 2026
- S28Form 8-K filed Feb 12, 2026 (Items 1.01, 8.01: senior notes issued) · Thermo Fisher Scientific Inc. (SEC EDGAR) · Tier 1: company or exchange filing · Feb 12, 2026
- S29Schedule 13G by FMR LLC (event Sep 30, 2026) · FMR LLC (SEC EDGAR) · Tier 1: company or exchange filing · Nov 5, 2026
- S30Schedule 13G by Vanguard Capital Management (event Mar 31, 2026) · Vanguard Capital Management (SEC EDGAR) · Tier 1: company or exchange filing · Apr 30, 2026
- S31Schedule 13G/A by The Vanguard Group (event Mar 13, 2026) · The Vanguard Group (SEC EDGAR) · Tier 1: company or exchange filing · Mar 27, 2026
- S32TMO historical daily prices, Nasdaq table for an NYSE-listed share (close of Nov 5, 2026: $676.94) · Nasdaq, Inc. · Tier 1: company or exchange filing · Nov 5, 2026
- S34Thermo Fisher Scientific Authorizes $5 Billion of Share Repurchases (press release) · Thermo Fisher Scientific Inc. · Tier 3: context only · Nov 5, 2026
- S35Thermo Fisher Scientific Announces Quarterly Dividend (press release, Nov 5, 2026) · Thermo Fisher Scientific Inc. · Tier 3: context only · Nov 5, 2026
- S36Thermo Fisher Scientific Highlights Industry Leadership, Growth Outlook and Long-Term Value Creation at 2026 Investor Day (press release) · Thermo Fisher Scientific Inc. · Tier 3: context only · May 20, 2026
Changes to this page (v1 · Nov 6, 2026)
- v1 · Nov 6, 2026First version. (first version)
Numbers come only from tier 1 and tier 2 sources. Read how we research.
Disclaimer
For learning only. Cityfort is not a registered investment adviser or broker-dealer and does not recommend buying or selling any security. Prices shown are dated and may be out of date.
Investing in securities involves risk, including loss of capital. Before making any investment decision, do your own research and consider consulting a registered investment adviser or other qualified professional.
Cityfort, its owners and contributors may or may not hold securities of companies covered. Cityfort is not paid by any company it covers. Content is not an offer or solicitation to buy or sell any security, including in any initial public offering.
Read the positions policyRead the full disclaimerHide the full disclaimer
Cityfort publishes general educational content that explains how listed companies work. Cityfort is not registered with the US Securities and Exchange Commission or any state securities regulator as an investment adviser, and is not a broker-dealer or a member of FINRA. Cityfort does not provide investment, tax or legal advice, recommendations, ratings, price targets or any opinion on whether to buy, sell or hold any security. Nothing on the site is tailored to any person's circumstances.
All information is taken from publicly available sources, mainly company filings with the SEC, which are listed on each page with dates. We work to keep it accurate and correct errors publicly, but we do not guarantee that it is complete, accurate or up to date. Any market price or price-based ratio shown is dated, may be out of date by the time you read it, and is included only to explain concepts.
Statements by company management, including forward-looking statements and guidance, are reported as the company's statements, with their date and source; they are not our forecasts. Adjusted (non-GAAP) figures are the company's own measures and are shown next to the official (GAAP) figures.