Financials · NYSE: PNC
PNC: how the business works
PNC takes deposits, makes loans and manages money for people and companies across the US, with revenue of $23.1 billion in FY2025.
By Hardik Bhandare · Checked against filings: . Editorial policy. Corrections
Follow PNC
Email me when PNC's page is updated after earnings.
We'll send a confirmation email first. See our privacy policy.
The PNC Financial Services Group, Inc. · Pittsburgh, Pennsylvania · Founded 1983
Updated for Q3 FY2026 · checked
- Revenue, FY2025
- $23.1B
- Net income to common shareholders, FY2025
- $6.6B
- Deposits, Sep 30, 2026
- $466.4B
- Branches, Dec 31, 2025
- 2,224
- Employees, Dec 31, 2025
- 55,333
The short version
PNC in 5 points
1 · What it sells
PNC takes deposits, makes loans and sells payments, advice and money management to people, companies and institutions across the US, with revenue of $23.1 billion in FY2025.
2 · Who pays it
Of the three segments' combined FY2025 revenue, consumers and small businesses paid 53.5%, companies and governments 40.4%, and wealthy clients and institutions 6.2% (Cityfort calculation from the FY2025 10-K).
3 · What it keeps from $100
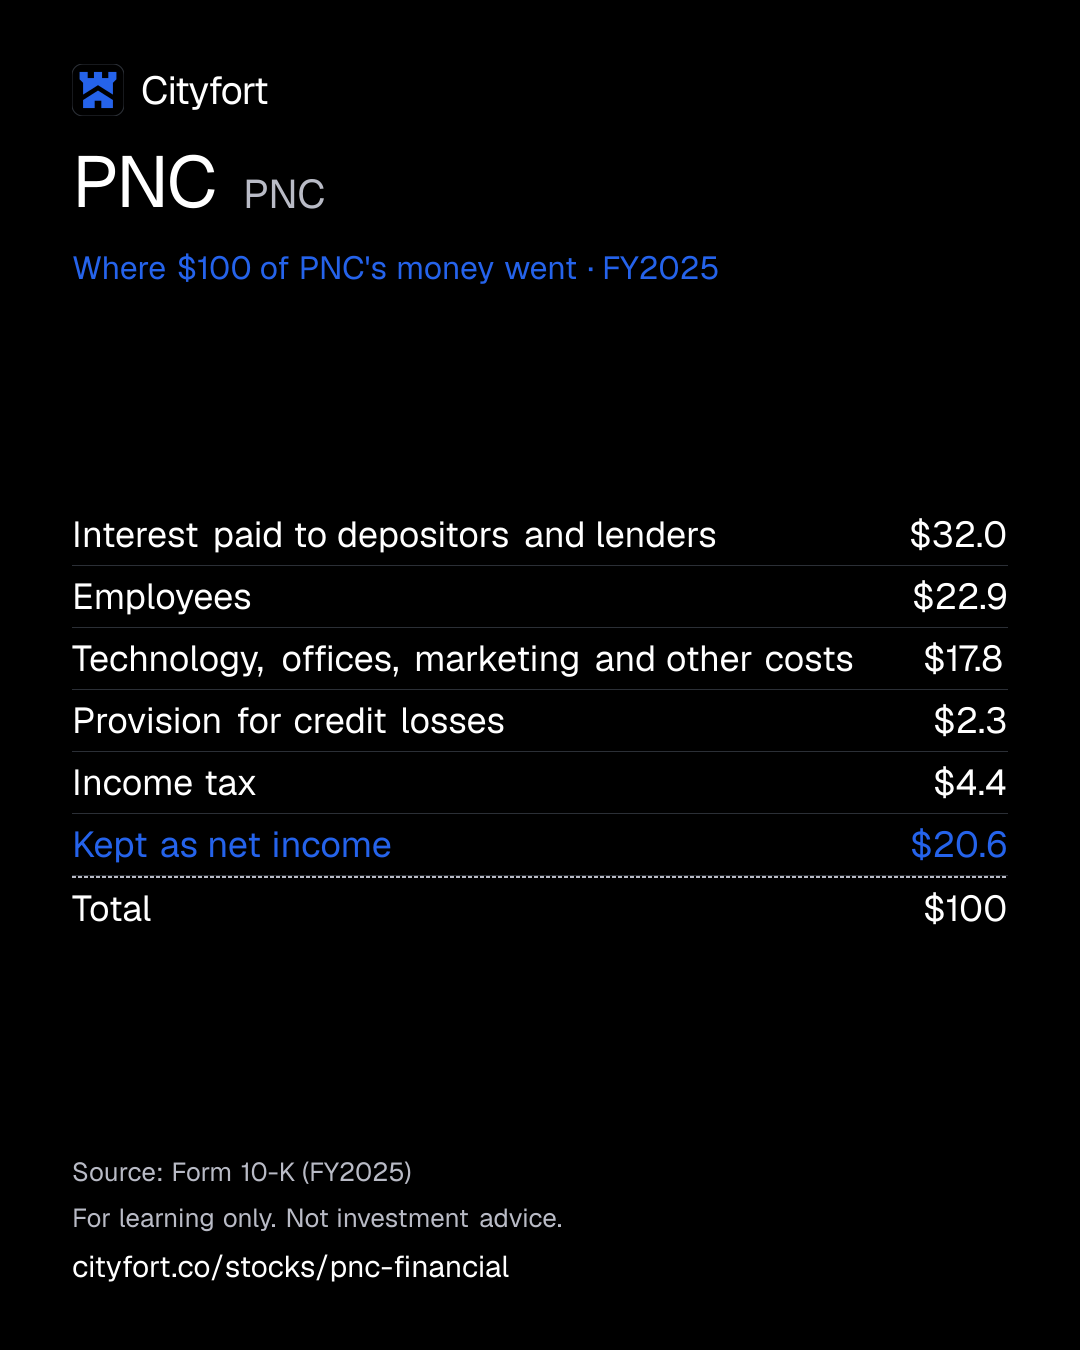
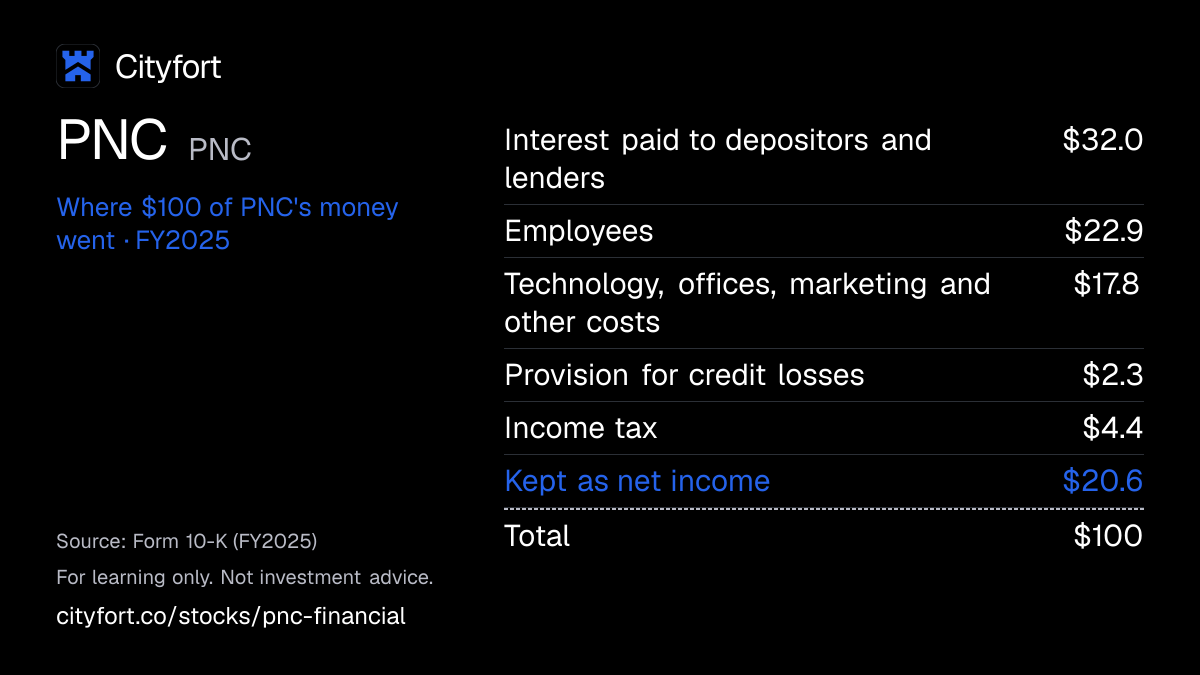
Of every $100 that came in during FY2025, PNC paid $32.0 in interest to depositors and lenders and kept $20.6 as net income; its operating profit before credit losses and tax (pre-provision profit) was $9.3 billion.
4 · Where the operating profit comes from
Of FY2025 segment net income, Corporate & Institutional Banking earned $5.5 billion, Retail Banking $5.1 billion and Asset Management Group $0.5 billion.
5 · The one thing to watch
PNC's deposits that pay no interest fell from $155.2 billion at Dec 31, 2021 to $91.7 billion at Dec 31, 2025, while interest paid rose from $487 million to $10.9 billion.
Sources: From PNC's FY2021 and FY2025 10-Ks · checked
01Where $100 of a bank's money goes · FY2025
Where does $100 of PNC's money go?
PNC · FY2025
Receipt for every $100
| Interest paid to depositors and lenders | $32.0 |
|---|---|
| Employees | $22.9 |
| Technology, offices, marketing and other costs | $17.8 |
| Provision for credit losses | $2.3 |
| Income tax | $4.4 |
| Kept as net income | $20.6 |
| Total | $100 |
Each line = amount ÷ total money in × 100. Lines may not add to exactly $100 because of rounding.
How this is worked out
Cityfort calculation from the FY2025 10-K. Of every $100 that came in (interest income of $25,307 million plus noninterest income of $8,689 million = $33,996 million): each line = line ÷ $33,996 million × 100. Net income includes $61 million for noncontrolling interests and $308 million of preferred dividends.
Save this receipt as an image
Embed this receipt or the key numbers
Paste this code into a blog or website to show the card you choose, with a link back to this page.
Each week: the next company due to report earnings, explained in 5 points.
No tips. Unsubscribe anytime.
We'll send a confirmation email. See our privacy policy.
02The business in one line
What does PNC do?
People and companies pay PNC interest on loans and fees for services; interest to depositors is its biggest cost, and the rest pays staff and becomes profit.
- In FY2025, consumers and small businesses brought in 53.5% of the three segments' combined revenue, and companies and governments 40.4% (Cityfort calculation from the FY2025 10-K).
- Of every $100 that came in during FY2025, $32.0 paid interest to depositors and lenders, $22.9 paid employees and $20.6 was kept as net income.
03Who pays it
Who pays PNC?
Consumers and small businesses
53.5%
of revenue
Retail Banking: interest on mortgages, cards and other loans, the margin on deposits, and fees. Segment revenue $14.9 billion in FY2025.
Companies, governments and not-for-profits
40.4%
of revenue
Corporate & Institutional Banking: loan interest, treasury management and capital markets fees. Segment revenue $11.2 billion in FY2025.
Wealthy clients and institutions
6.2%
of revenue
Asset Management Group: fees on money managed and private banking. Segment revenue $1.7 billion in FY2025.
- Consumers and small businesses53.5%
- Companies, governments and not-for-profits40.4%
- Wealthy clients and institutions6.2%
How spread out the customers are
PNC does not disclose revenue from its largest customers. Shares are of the three segments' combined FY2025 revenue of $27.8 billion (Cityfort calculation from the FY2025 10-K).
Sources (1)
04How it makes money
How does PNC make money?
It earns the gap between interest on loans and investments and interest on deposits, plus fees
Deposits are the bank's main source of money, and $91.7 billion of them paid no interest at the end of FY2025. PNC lends and invests that money at higher rates. Fees from cards, payments, advice and money management add to the interest margin.
Net interest margin (taxable-equivalent)
2.3%2.8%
FY2021 to FY2025
- Collect deposits from people and companies
- Lend and invest the money
- Earn interest, plus fees on other services
- Pay depositors, staff and credit losses
- Keep the rest as capital and profit
↺ Step 5 feeds back into step 1.
05Business segments · FY2025
Which businesses make up PNC?
Retail Banking
53.5%Accounts, loans and cards for consumers and small businesses; FY2025 net income $5.1 billion. Shares are of the three segments' combined $27.8 billion (Cityfort calculation from the FY2025 10-K); PNC's other activities subtract $4.7 billion to reach total revenue of $23.1 billion.
Revenue $14.9B ($14,863M)
Corporate & Institutional Banking
40.4%Loans, treasury management and capital markets for companies and governments; FY2025 net income $5.5 billion.
Revenue $11.2B ($11,228M)
Asset Management Group
6.2%Private banking and institutional asset management; FY2025 net income $0.5 billion.
Revenue $1.7B ($1,710M)
How the mix changed
- Retail Banking
- Corporate & Institutional Banking
- Asset Management Group
Revenue by segment, FY2023 to FY2025.
US$
See the numbers
Sources (1)
06The numbers · Consolidated · US$
How has PNC done?
Net interest income
$14.4BFY2025
Net interest income rose from $10.6 billion in FY2021 to $14.4 billion in FY2025, with a dip in FY2024, and was $4.2 billion in Q3 FY2026, a quarter that includes FirstBank.
* FY2021: BBVA USA from Jun 1, 2021; FY2024: Visa gain, securities loss; Q1 FY2026: FirstBank from Jan 5, 2026.
US$ · interest earned minus interest paid
See the yearly numbers
See the quarterly numbers
Net income
$6.6BFY2025
Pre-provision profit, before credit losses and tax, rose from $6.2 billion in FY2021 to $9.3 billion in FY2025, with a dip in FY2023.
* FY2021: BBVA USA from Jun 1, 2021; FY2024: Visa gain, securities loss.
US$ · after the provision for credit losses and tax
See the yearly numbers
See the quarterly numbers
Net interest margin
2.83%FY2025
PNC's net interest margin rose from 2.29% in FY2021 to 2.83% in FY2025 and was 2.94% in Q3 FY2026.
% · net interest income as a share of the assets that earn interest, as reported by the company
See the numbers
Loans written off (net charge-offs)
0.23%FY2025
Net charge-offs were 0.33% of average loans in FY2024 and 0.23% in FY2025; the allowance was 1.58% of loans at Dec 31, 2025 and 1.42% at Sep 30, 2026.
* FY2021: BBVA USA from Jun 1, 2021; FY2024: Visa gain, securities loss; Q1 FY2026: FirstBank from Jan 5, 2026.
% of average loans · loans written off as unlikely to be repaid, minus amounts later recovered, as reported
See the yearly numbers
See the quarterly numbers
See all yearly numbers
Net interest income = interest earned on loans and securities minus interest paid to depositors and lenders. Revenue (net of interest expense) = net interest income + noninterest income (fees and other income). Provision for credit losses = money set aside for loans that may not be repaid. Net income is the amount for common stockholders. Fiscal years are the company's own (December 31).
- Net interest margin is on a taxable-equivalent basis, a non-GAAP measure PNC reports in its 10-K and earnings releases.
- Loans are total loans and the allowance is the allowance for credit losses, which includes reserves for unfunded lending commitments: the totals PNC's own allowance ratio divides. The allowance for loan and lease losses alone was $4,410 million at Dec 31, 2025.
- CET1 is on the Basel III standardized approach. As a Category III bank, PNC excludes accumulated other comprehensive income from regulatory capital. The FY2024 ratio reflects a transition option for the CECL accounting standard.
- FirstBank, acquired on Jan 5, 2026, had $16.0 billion of loans and $23.1 billion of deposits at close. FY2025 and earlier years exclude it, so 2026 loans, deposits and net interest income are not like-for-like with 2025.
- FY2024 includes a $754 million gain on exchanging Visa shares and a $497 million loss on repositioning securities in Q2 2024. BBVA USA is included from Jun 1, 2021.
- The efficiency ratio here is noninterest expense ÷ total revenue (PNC states 60% for FY2025). ROE is on average common equity, as PNC reports it. Net income is net income attributable to common shareholders.
Learn: What is net interest income and margin? NII and NIM at real US banks · How to read a US earnings release: Nvidia's Q2 fiscal 2027 · What a margin means: dollars kept per $100
07Who runs it
Who runs PNC, and did they deliver?
William S. Demchak
Chairman and Chief Executive Officer
Joined PNC in 2002; also a director.
Mark Wiedman
President · since 2025
Joined PNC in 2025.
Robert Q. Reilly
Executive Vice President and Chief Financial Officer
With PNC since 1987.
Michael D. Thomas
Head of Corporate & Institutional Banking
With PNC since 1997.
Alexander E. C. Overstrom
Head of Retail Banking
With PNC since 2014.
Amy Wierenga
Chief Risk Officer
Joined PNC in 2024.
What they said, and what happened
1 delivered
Said on Feb 20, 2026
PNC said in its FY2025 10-K that it expected to convert FirstBank customers to PNC Bank in the summer of 2026.
DeliveredWhat happened
PNC said in its Q3 FY2026 10-Q that in June 2026 it converted about 780,000 customers, more than 1,620 employees and 95 branches, merging FirstBank into PNC Bank.
08What could go wrong
What could go wrong for PNC?
- Pricing
Interest rates
PNC's 10-K says its results are affected significantly by market interest rates. Net interest income was $14.4 billion of its $23.1 billion FY2025 revenue, and depends on the gap between what loans earn and what deposits cost.
Watch Net interest margin each quarter (2.94% in Q3 FY2026)
- Concentration
Borrowers who cannot repay
The 10-K names customer creditworthiness and the concentration and mix of assets as risks, and PNC reports a separate commercial real estate office portfolio. Net charge-offs were $744 million in FY2025.
Watch Net charge-off ratio (0.28% in Q3 FY2026) and the allowance (1.42% of loans)
- Regulation
Capital and regulation
PNC and PNC Bank must meet capital and liquidity rules set by the Federal Reserve and the OCC, and the 10-K says these can limit dividends and buybacks. Its stress capital buffer is set at the 2.5% minimum through Dec 31, 2027.
Watch CET1 ratio (an estimated 9.8% at Sep 30, 2026) and the Federal Reserve stress test
- Competition
Competition for deposits and customers
The 10-K says PNC faces intense competition from banks and non-bank firms, including fintech companies. Noninterest-bearing deposits fell from $155.2 billion at Dec 31, 2021 to $91.7 billion at Dec 31, 2025.
Watch Noninterest-bearing deposits and interest expense each quarter
- Execution
Absorbing acquisitions
The 10-K says PNC grows partly by buying other financial businesses, and that acquisitions carry risks. FirstBank, bought on Jan 5, 2026, added $26.4 billion of assets.
Watch Integration costs and FirstBank-related loan and deposit balances in quarterly releases
- Technology
Technology and cyber attacks
The 10-K says PNC is vulnerable to cyber attacks and breaches, and could suffer a material adverse impact from failures or interruptions in its technology.
Watch Any disclosed outage or breach in 8-K filings
- Legal
Legal proceedings
The 10-K lists the risk of adverse results in legal proceedings, including interchange fee and USAA patent cases, and says some reasonably possible losses cannot be estimated.
Watch Updates in the legal proceedings note of each 10-Q and 10-K
09Supporters vs. critics
What do supporters and critics point to?
What supporters point to
- PNC's net interest margin rose from 2.29% in FY2021 to 2.83% in FY2025 and was 2.94% in Q3 FY2026.
- Net income to common shareholders rose from $5.5 billion in FY2024 to $6.6 billion in FY2025, and diluted EPS from $13.74 to $16.59.
- Net charge-offs were 0.23% of average loans in FY2025, down from 0.33% in FY2024.
- PNC said in its FY2025 10-K it expected to move FirstBank customers to PNC Bank in summer 2026; it moved about 780,000 in June 2026.
- On Oct 2, 2026 PNC declared a quarterly dividend of $2.00 per common share, up from $1.70.
What critics point to
- Deposits that pay no interest fell from 33.9% of PNC's deposits at Dec 31, 2021 to 20.8% at Dec 31, 2025 (Cityfort calculation from the FY2021 and FY2025 10-Ks).
- The CET1 capital ratio was an estimated 9.8% at Sep 30, 2026, down from 10.6% at Dec 31, 2025.
- Net interest income was $14.4 billion of FY2025 revenue of $23.1 billion, and the 10-K says PNC's results are affected significantly by market interest rates.
- The FY2025 10-K describes interchange fee lawsuits and USAA patent cases, and PNC says it cannot estimate reasonably possible losses for some matters it discloses.
- Loans rose from $331.5 billion at Dec 31, 2025 to $378.8 billion at Sep 30, 2026, and part of that is the FirstBank acquisition, so 2026 is not like-for-like with 2025.
10What to watch next
What should you watch next at PNC?
Next event
Q4 FY2026 results
Date not announced yet.
Share repurchases
PNC said on Oct 15, 2026 that it expects Q4 FY2026 repurchases to approximate Q3 levels, which were $0.6 billion.
CET1 capital ratio
PNC estimated it at 9.8% at Sep 30, 2026, against 10.6% at Dec 31, 2025; its stress capital buffer stays at the 2.5% minimum through Dec 31, 2027.
Deposit costs and margin
Interest paid was $10.9 billion in FY2025, and the net interest margin was 2.94% in Q3 FY2026.
11Key facts
Key facts about PNC
- What does PNC do?
- The PNC Financial Services Group is a Pittsburgh-based bank holding company. Its main bank, PNC Bank, takes deposits, makes loans and sells payments, advice and money management across the US. It held $440.9 billion of deposits at Dec 31, 2025.
- How does PNC make money?
- PNC earns most of its money as net interest income, the gap between what its loans and investments earn and what its deposits cost: $14.4 billion of its $23.1 billion revenue in FY2025. The other $8.7 billion was noninterest income, such as card, treasury management and asset management fees.
- Who are PNC's customers?
- Consumers and small businesses brought in 53.5% of PNC's three segments' combined FY2025 revenue of $27.8 billion. Companies, governments and not-for-profits brought in 40.4%, and wealthy clients and institutions 6.2% (Cityfort calculation from the FY2025 10-K).
- How big is PNC?
- PNC had revenue of $23.1 billion and net income to common shareholders of $6.6 billion in FY2025, up from $21.6 billion and $5.5 billion in FY2024. PNC had $573.6 billion of total assets at Dec 31, 2025.
- Who owns PNC?
- PNC has one class of common stock with one vote per share, and 396,778,009 shares were outstanding at Oct 14, 2026. PNC's 2026 proxy says directors and executive officers owned about 0.4% at Jan 30, 2026, and lists Vanguard (9.2%) and BlackRock (7.2%) from filings dated early 2024.
- What did PNC buy in 2026?
- PNC completed its acquisition of FirstBank, a Colorado bank with $16.0 billion of loans and $23.1 billion of deposits, on Jan 5, 2026, for $4.2 billion in cash and stock. PNC moved about 780,000 FirstBank customers and 95 branches to PNC Bank in June 2026.
- How much capital does PNC hold?
- PNC's CET1 capital ratio, a regulatory measure of loss-absorbing capital, was 10.6% at Dec 31, 2025 and an estimated 9.8% at Sep 30, 2026, according to PNC's filings.
- How much did PNC return to shareholders in FY2025?
- PNC returned $3.9 billion to shareholders in FY2025: more than $2.6 billion of common dividends and $1.2 billion of share repurchases. On Oct 2, 2026 PNC declared a quarterly dividend of $2.00 per common share, up from $1.70.
Terms on this page
- Allowance for credit losses
- CET1 ratio
- Earnings per share (EPS)
- Efficiency ratio
- Net charge-offs
- Net interest income and margin
- Stock buyback
Each explains the term in plain English, with the same number from other companies on Cityfort.
Go deeper
More detail from the same filings. Open any section.
12What it sells
12What it sells
What does PNC sell?
Retail Banking
Checking, savings and money market accounts, mortgages, home equity loans, auto loans, credit cards and brokerage for consumers and small businesses, through branches, ATMs, apps and call centers.
Corporate & Institutional Banking
Loans, treasury management (cash, payments and receivables services), capital markets and merger advice for mid-sized and large companies, governments and not-for-profits.
Asset Management Group
PNC Private Bank for wealthy clients and institutional asset management, such as outsourced investment management, custody and retirement plan services.
Think of it like this
Like a store whose stock is money: it pays savers for their deposits and earns more by lending and investing them.
What it does
- Does: Takes deposits: $440.9 billion at Dec 31, 2025
- Does: Lends to consumers and companies: $331.5 billion of loans at Dec 31, 2025
- Does: Earns fees from cards, treasury management, capital markets advice, asset management and mortgages
What it does not do
- Does not: It is not one of the largest global banks: regulators place it in Category III, for banks with $250 billion to $700 billion of assets
- Does not: It does not do much business abroad: the 10-K says foreign activities are a relatively small part of the business
- Does not: It does not keep every mortgage it makes: many are sold, with PNC keeping the servicing
Sources (2)
13How the money flows
13How the money flows · FY2025
How does money flow through PNC?
Money in
- Interest earned on loans, securities and other assets$25.3B
- Fees and other noninterest income$8.7B
The company
PNC
$34.0B came in
Money out
- Interest paid to depositors and lenders$10.9B
- Employees$7.8B
- Technology, offices, marketing and other costs$6.1B
- Provision for credit losses$779M
- Income tax$1.5B
- Net income$7.0B
- People and companies held $440.9 billion of deposits at PNC at the end of FY2025.
- PNC lends and invests that money, and earned $25.3 billion of interest in FY2025.
- It also earned $8.7 billion of fees and other income from cards, payments, advice and asset management.
- It paid $10.9 billion of interest to depositors and lenders, then staff, other costs, credit losses and tax.
- What was left, $7.0 billion, is net income; $6.6 billion of it belonged to common shareholders.
Sources (1)
14What it needs to run
14What it needs to run
What does PNC need to run?
Deposits
$440.9 billion at Dec 31, 2025 and $466.4 billion at Sep 30, 2026: the main money it lends and invests.
Capital
CET1 capital of $47.3 billion at Dec 31, 2025, 10.6% of risk-weighted assets; regulators set minimum capital levels.
Branches and digital channels
2,224 branches at Dec 31, 2025, plus ATMs, apps and phone contact centers.
People
55,333 employees at Dec 31, 2025, of whom 27,595 worked in Retail Banking.
Bank charters
PNC is a bank and financial holding company supervised by the Federal Reserve; PNC Bank is a national bank supervised by the OCC.
15Competitors and what protects it
15Competitors and what protects it
Who does PNC compete with?
Bank of America
NYSE: BAC
In PNC's performance peer group of 11 banks, which the 2026 proxy says was chosen for size and for mix and scope of businesses, products and services.
JPMorgan Chase
NYSE: JPM
In PNC's 11-bank performance peer group in the 2026 proxy.
U.S. Bancorp
NYSE: USB
In PNC's 11-bank performance peer group in the 2026 proxy.
Truist Financial
NYSE: TFC
In PNC's 11-bank performance peer group in the 2026 proxy.
Huntington Bancshares
The 2026 proxy calls Huntington a meaningful competitor for middle-market and commercial clients and notes its expanding retail presence in markets where PNC competes.
What protects the business
Each strength is scored 1 (weak) to 5 (strong) for the business, with the reason. It is not a rating of the share.
- Deposit base4 of 5
$440.9 billion of deposits at Dec 31, 2025, of which $91.7 billion paid no interest; loans were 75% of deposits.
- Branch network3 of 5
2,224 branches at Dec 31, 2025; PNC said in 2025 it would raise branch investment to about $2.0 billion by 2030 and open more than 300 branches.
- Fee income3 of 5
Noninterest income was $8.7 billion, 37.6% of FY2025 revenue (Cityfort calculation from the FY2025 10-K), from cards, treasury management, advice and asset management.
- Credit ratings3 of 5
PNC's senior debt was rated A3 by Moody's, A- by S&P and A by Fitch at Sep 30, 2026; the 10-K says a downgrade could affect its liquidity and funding costs.
Weak spot
Fewer interest-free deposits
Noninterest-bearing deposits fell from $155.2 billion at Dec 31, 2021 to $91.7 billion at Dec 31, 2025, from 33.9% to 20.8% of deposits (Cityfort calculation from the FY2021 and FY2025 10-Ks). Interest paid rose from $487 million in FY2021 to $10.9 billion in FY2025.
16Where growth could come from
16Where growth could come from
Where could PNC's growth come from?
PNC said in its Oct 15, 2026 earnings release that it expects share repurchases in the fourth quarter of 2026 to approximate third-quarter 2026 levels. Its Q3 FY2026 10-Q (Nov 3, 2026) repeats the guidance it gave on Oct 15, 2026: for Q4 2026 against Q3 2026, it expects average loans up about 2.5%, net interest income up about 4.0%, fee income up about 3.5%, noninterest expense up about 5.0% and net loan charge-offs of about $250 million. For FY2026 against FY2025, it expects average loans up about 13.5%, net interest income up about 15.5%, total revenue up about 14.5% and noninterest expense up about 12.3%.
FirstBank acquisition
WorkingLoans $331.5B to $378.8B, Dec 2025 to Sep 2026
PNC bought FirstBank, a Colorado bank with $16.0 billion of loans and $23.1 billion of deposits, on Jan 5, 2026. It moved about 780,000 customers and 95 branches in Colorado and Arizona to PNC Bank in June 2026. Part of the loan increase is the acquisition.
Status: Working, on track against what the company said.
More branches
EarlyAbout $2.0B by 2030, 300+ new branches
PNC said in 2025 it would raise its total branch investment to about $2.0 billion by 2030, focused on Nashville, Chicago, Sarasota and Winston-Salem. It had 2,224 branches at Dec 31, 2025.
Status: Early, too early to judge.
Corporate & Institutional Banking
WorkingRevenue $9.3B (FY2023) to $11.2B (FY2025)
Segment revenue rose each year on the restated basis in the FY2025 10-K, and segment net income rose from $4.1 billion to $5.5 billion.
Status: Working, on track against what the company said.
Retail Banking
Working9M FY2026 net income +$636M
PNC said Retail Banking earnings for the first nine months of 2026 rose $636 million from the same period of 2025, on higher revenue partly offset by higher expenses. The 2026 figures include FirstBank.
Status: Working, on track against what the company said.
Status compares progress with what the company itself said it would do: Working = on track against what the company said; Mixed = partly on track; Behind = behind the company's own plan; New = recently announced; Early = too early to judge.
17The company's own measures (non-GAAP)
17The company's own measures · Q3 FY2026 and FY2025
What do PNC's own measures show?
Official (GAAP): Return on average common shareholders' equity, Q3 FY2026
13.9%
Company's own measure: Return on average tangible common equity (ROTCE), Q3 FY2026
18.3%
Annualized net income to common shareholders divided by tangible common equity, as PNC defines it.
Official (GAAP): Book value per share, Sep 30, 2026
$142.17
Company's own measure: Tangible book value per share, Sep 30, 2026
$107.64
Tangible common shareholders' equity divided by period-end common shares, as PNC defines it.
Official (GAAP): Book value per share, Dec 31, 2025
$140.44
Company's own measure: Tangible book value per share, Dec 31, 2025
$112.51
Tangible common shareholders' equity divided by period-end common shares, as PNC defines it.
These are the company's own measures, defined by the company. They are not comparable across companies, and they are not added together. Each sits beside the nearest official (GAAP) figure.
Learn: Non-GAAP measures: what a company's "adjusted" numbers leave out
18Financial strength: capital, loan losses, deposits
18Financial strength · FY2025
How strong is PNC's balance sheet?
- Loans made$331.5B
- Deposits taken$440.9B
- of which pay no interest$91.7B
Loans were 75.2% of deposits at the end of FY2025 (Cityfort calculation from the reported totals: loans ÷ deposits).
Noninterest-bearing deposits, such as many checking accounts, were 20.8% of deposits (Cityfort calculation: noninterest-bearing deposits ÷ total deposits).
- CET1 capital ratio
- 10.6%
- common equity capital as a share of risk-weighted assets (Basel III standardized approach); regulators set a minimum
- Allowance for credit losses
- $5.2B
- money set aside for expected loan losses: 1.58% of loans
- Net charge-offs
- $744M
- loans written off, minus recoveries: 0.23% of average loans
- Efficiency ratio
- 59.9%
- $ of noninterest expense per $100 of revenue (net interest income + noninterest income)
- Return on assets
- 1.24%
- net income as % of average total assets
- Return on equity
- 12.9%
- net income as % of average common equity
Figures at the end of FY2025, consolidated, as reported by the company in its 10-K and earnings release; see the dates on each source.
Learn: What are net charge-offs? Loans written off, with real US companies · What is the allowance for credit losses? Loss reserves at US banks · What is the CET1 ratio? A bank's core capital, with real US companies · What is a bank efficiency ratio? Costs vs revenue, with real US banks · How to read a 10-K in 10 minutes
Sources (1)
19Who owns it
19Who owns it · ownership as of Jan 30, 2026
Who owns PNC?
- Officers and directors (as a group), shares
- 0.4%
Share classes
Holders of 5% or more
From the company's proxy statement (DEF 14A), later Schedule 13G filings and the share counts on its latest annual or quarterly report. Each holder row shows the date of its own filing.
Learn: How to read a proxy statement (DEF 14A): Nvidia's 2026 proxy · Form 4 insider filings: who files, the codes and the footnotes
20What it does with profit
20What it does with profit
What does PNC do with its profit?
Buyback · Dec 31, 2025
FY2025: 6.8 million common shares repurchased for $1.2 billion; about 35% of the 100 million-share authorization remained at Dec 31, 2025.
$1.2B
Buyback · Sep 30, 2026
Q3 FY2026: $0.6 billion of common shares repurchased; about 27% of the 100 million-share authorization remained at Sep 30, 2026.
$600M
21Governance signals
21Governance signals
What do PNC's governance filings show?
- Auditor
- PricewaterhouseCoopers LLP, since 2007
- Auditor changes
- None in the period covered
- Audit qualifications
- None reported
- Related-party dealings
- The 2026 proxy says PNC does ordinary-course business with some directors, executive officers and their families, and with BlackRock and Vanguard, which each own more than 5% of its shares. It extends credit to some directors under Regulation O, a federal rule against preferential loans to insiders.
- Credit rating
- Moody's, S&P, Fitch and DBRS Morningstar (as stated in the Q3 FY2026 10-Q, at Sep 30, 2026) A3 (Moody's) / A- (S&P) / A (Fitch) / AA (low) (DBRS Morningstar) for PNC senior debt (outlook Stable (all four, as stated in the FY2025 10-K)), Sep 30, 2026
A credit rating describes the company's ability to repay debt. It is not a rating of the share.
Flags to know about
other · Nov 3, 2026
Lawsuits described in the 10-K
The FY2025 10-K's legal proceedings note describes interchange fee lawsuits by merchants that name Visa, Mastercard and several banks, including National City (since merged into PNC), and patent infringement lawsuits filed by USAA, including one filed in August 2021 against BBVA USA. PNC says it cannot estimate reasonably possible losses for some of the matters it discloses.
22How it got here
22How it got here
How did PNC get here?
1983
Milestone
PNC formed
Incorporated in Pennsylvania through the consolidation of Pittsburgh National Corporation and Provident National Corporation.
2021
Business-model change
BBVA USA bought
PNC paid $11.5 billion in cash for BBVA USA on Jun 1, 2021, and in October moved about 2.6 million customers, 9,000 employees and over 600 branches in seven states to PNC.
2024
Milestone
Visa gain and securities sale
In Q2 2024 PNC booked a $754 million gain on exchanging Visa shares and a $497 million loss on repositioning its securities.
2025
Milestone
Branch plan raised
PNC said it would raise its total branch investment to about $2.0 billion by 2030 and open more than 300 new branches.
2026
Business-model change
FirstBank bought
PNC completed its acquisition of FirstBank on Jan 5, 2026 for $4.2 billion in cash and stock to common and Series A preferred holders, plus $0.1 billion of new preferred stock.
2026
Milestone
FirstBank merged into PNC Bank
In June 2026 PNC moved about 780,000 customers and 95 branches in Colorado and Arizona to PNC Bank.
2026
Milestone
Dividend raised to $2.00
On Oct 2, 2026 PNC declared a quarterly dividend of $2.00 per common share, up from $1.70.
23Sources and changes
Where every number on this page comes from
Sources (18 documents)
- S1Form 10-K for FY2025 · SEC EDGAR · Tier 1: company or exchange filing · Feb 20, 2026
- S2Form 10-K for FY2024 · SEC EDGAR · Tier 1: company or exchange filing · Feb 21, 2025
- S3Form 10-K for FY2023 · SEC EDGAR · Tier 1: company or exchange filing · Feb 21, 2024
- S4Form 10-K for FY2022 · SEC EDGAR · Tier 1: company or exchange filing · Feb 22, 2023
- S5Form 10-K for FY2021 · SEC EDGAR · Tier 1: company or exchange filing · Feb 25, 2022
- S7Form 10-Q for Q3 FY2026 · SEC EDGAR · Tier 1: company or exchange filing · Nov 3, 2026
- S8Form 10-Q for Q2 FY2026 · SEC EDGAR · Tier 1: company or exchange filing · Aug 5, 2026
- S9Form 10-Q for Q1 FY2026 · SEC EDGAR · Tier 1: company or exchange filing · May 5, 2026
- S10Form 10-Q for Q3 FY2025 · SEC EDGAR · Tier 1: company or exchange filing · Nov 3, 2025
- S11Form 10-Q for Q2 FY2025 · SEC EDGAR · Tier 1: company or exchange filing · Aug 1, 2025
- S12Form 10-Q for Q1 FY2025 · SEC EDGAR · Tier 1: company or exchange filing · May 2, 2025
- S132026 Proxy Statement (DEF 14A) · SEC EDGAR · Tier 1: company or exchange filing · Mar 11, 2026
- S14Q3 2026 earnings release (8-K Ex. 99.1, financial highlights) · SEC EDGAR · Tier 1: company or exchange filing · Oct 15, 2026
- S15Q3 2026 financial supplement (8-K Ex. 99.2) · SEC EDGAR · Tier 1: company or exchange filing · Oct 15, 2026
- S21Q4 2025 financial supplement (8-K Ex. 99.2) · SEC EDGAR · Tier 1: company or exchange filing · Jan 16, 2026
- S25Q2 2025 financial supplement (8-K Ex. 99.2) · SEC EDGAR · Tier 1: company or exchange filing · Jul 16, 2025
- S27Form 10-Q for Q3 FY2024 · SEC EDGAR · Tier 1: company or exchange filing · Nov 1, 2024
- S28Form 10-Q for Q2 FY2024 · SEC EDGAR · Tier 1: company or exchange filing · Aug 2, 2024
Changes to this page (v1 · Nov 20, 2026)
- v1 · Nov 20, 2026First version. (first version)
Numbers come only from tier 1 and tier 2 sources. Read how we research.
Disclaimer
For learning only. Cityfort is not a registered investment adviser or broker-dealer and does not recommend buying or selling any security. Prices shown are dated and may be out of date.
Investing in securities involves risk, including loss of capital. Before making any investment decision, do your own research and consider consulting a registered investment adviser or other qualified professional.
Cityfort, its owners and contributors may or may not hold securities of companies covered. Cityfort is not paid by any company it covers. Content is not an offer or solicitation to buy or sell any security, including in any initial public offering.
Read the positions policyRead the full disclaimerHide the full disclaimer
Cityfort publishes general educational content that explains how listed companies work. Cityfort is not registered with the US Securities and Exchange Commission or any state securities regulator as an investment adviser, and is not a broker-dealer or a member of FINRA. Cityfort does not provide investment, tax or legal advice, recommendations, ratings, price targets or any opinion on whether to buy, sell or hold any security. Nothing on the site is tailored to any person's circumstances.
All information is taken from publicly available sources, mainly company filings with the SEC, which are listed on each page with dates. We work to keep it accurate and correct errors publicly, but we do not guarantee that it is complete, accurate or up to date. Any market price or price-based ratio shown is dated, may be out of date by the time you read it, and is included only to explain concepts.
Statements by company management, including forward-looking statements and guidance, are reported as the company's statements, with their date and source; they are not our forecasts. Adjusted (non-GAAP) figures are the company's own measures and are shown next to the official (GAAP) figures.