Financials · NYSE: PRU
Prudential Financial: how the business works
Prudential Financial sells life insurance, annuities and company pension takeovers in the US and Japan, with total revenues of $60.8 billion in FY2025.
By Hardik Bhandare · Checked against filings: . Editorial policy. Corrections
Follow Prudential Financial
Email me when Prudential Financial's page is updated after earnings.
We'll send a confirmation email first. See our privacy policy.
Prudential Financial, Inc. · Newark, New Jersey · Founded 1875
Updated for Q3 FY2026 · checked
- Total revenues, FY2025
- $60.8B
- Net income, FY2025
- $3.58B
- Assets under management, Sep 30, 2026
- $1.616 trillion
- Investments it holds, Dec 31, 2025
- $470.5B
- Founded
- 1875, Newark, New Jersey
The short version
Prudential Financial in 5 points
1 · What it sells
Prudential Financial sells life insurance, annuities and company pension takeovers in the US and Japan, and runs PGIM, which managed $1.465 trillion at Sep 30, 2026.
2 · Who pays it
In FY2025, Retirement Strategies (pension takeovers and annuities) brought in 38.5% of segment revenue, International Businesses (Japan and Latin America) 31.5%, Group Insurance 11.7%, Individual Life 10.6%, PGIM 7.3% and Corporate and Other 0.3%.
3 · What it keeps from $100
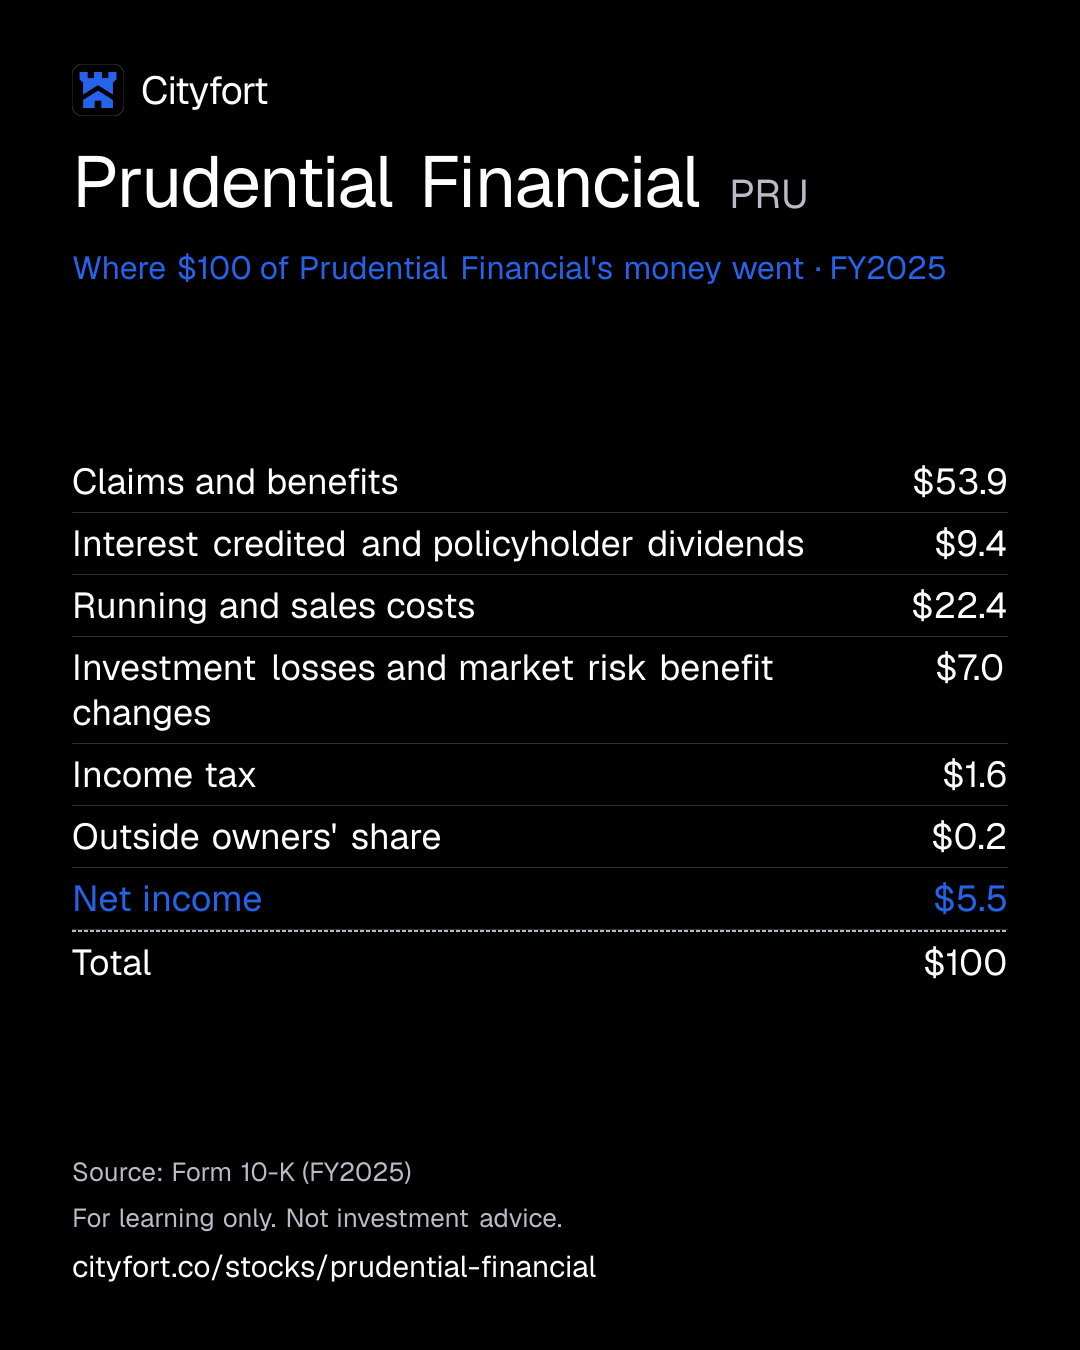
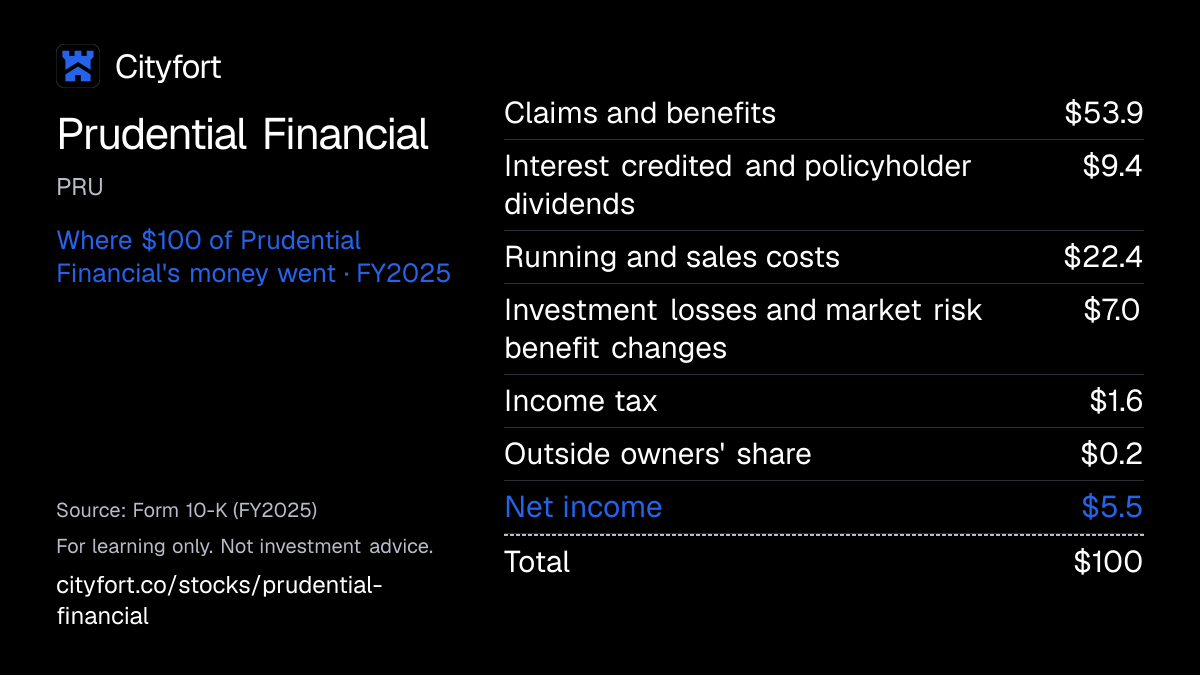
Of every $100 that came in during FY2025, Prudential Financial spent $53.9 on claims and benefits and kept $5.5 as net income, after $4,132 million of net realized investment losses (after-tax adjusted operating income: $5,161 million).
4 · Where the operating profit comes from
In FY2025, adjusted operating income before tax was $3,445 million in Retirement Strategies, $3,247 million in International Businesses and $878 million at PGIM, while Corporate and Other lost $1,574 million.
5 · The one thing to watch
Japan annualized new business premiums were $287 million in Q3 FY2026, against $453 million a year earlier, and the sales suspension order on Prudential of Japan runs through Jan 31, 2027.
Sources: From Prudential Financial's FY2025 10-K, its Q4 2025 and Q3 2026 financial supplements, its Q3 2026 earnings release and its Q3 FY2026 10-Q · checked
Sources (5)
01Where $100 of an insurer's money goes · FY2025
Where does $100 of Prudential Financial's money go?
Prudential Financial · FY2025
Receipt for every $100
| Claims and benefits | $53.9 |
|---|---|
| Interest credited and policyholder dividends | $9.4 |
| Running and sales costs | $22.4 |
| Investment losses and market risk benefit changes | $7.0 |
| Income tax | $1.6 |
| Outside owners' share | $0.2 |
| Net income | $5.5 |
| Total | $100 |
Each line = amount ÷ total money in × 100. Lines may not add to exactly $100 because of rounding.
How this is worked out
Cityfort calculation from the FY2025 10-K. Of every $100 that came in (total money in of $65,510 million: premiums, investment income, fees, other income and joint-venture earnings), each line = line ÷ $65,510 million × 100. Claims and benefits = $35,224 million + $103 million; running costs = $13,012 million general and administrative + $1,635 million of sales costs written off (DAC amortization); investment losses = $4,132 million + $475 million.
Save this receipt as an image
Embed this receipt or the key numbers
Paste this code into a blog or website to show the card you choose, with a link back to this page.
Each week: the next company due to report earnings, explained in 5 points.
No tips. Unsubscribe anytime.
We'll send a confirmation email. See our privacy policy.
02The business in one line
What does Prudential Financial do?
Companies, savers and families pay Prudential Financial premiums and deposits now. It invests the money, pays most of it back as claims, benefits and interest, and keeps what is left.
- In FY2025, premiums brought in $30,797 million and the money it had invested earned $21,473 million.
- Of every $100 that came in during FY2025, $53.9 went on claims and benefits and $5.5 was left as net income.
03Who pays it
Who pays Prudential Financial?
Prudential Financial does not disclose how much each type of customer pays.
Companies with pension plans
US and UK plan sponsors pay a premium for Prudential to take over pension payments; institutions also buy funding agreements and stable value products. Institutional Retirement Strategies revenue was $16,657 million in FY2025.
People saving for retirement
Buy annuities, such as the FlexGuard indexed annuity. Individual Retirement Strategies revenue was $5,541 million in FY2025.
Employers
Buy group life and disability cover for staff. Group Insurance revenue was $6,774 million in FY2025.
Families in Japan and Latin America
Buy life insurance from Prudential of Japan, Gibraltar Life and the Brazil and Mexico units. International Businesses revenue was $18,148 million in FY2025.
Investors using PGIM
Pension funds, institutions and retail investors pay fees to have money managed. PGIM revenue was $4,231 million in FY2025.
How spread out the customers are
The FY2025 10-K names no customer that provides 10% or more of revenue. Segment revenue above is on the company's adjusted operating income basis.
Sources (1)
04How it makes money
How does Prudential Financial make money?
It collects money now, invests it, and pays it back years later.
Customers pay premiums today for payments that may come decades later. Prudential earns the gap between what its investments return and what it credits and pays policyholders. Large pension deals swing revenue from year to year, so net income per $100 of revenue moves a lot: $12.4 in FY2021, $5.9 in FY2025.
Net income per $100 of revenue
$12.4$5.9
FY2021 to FY2025
- Customers and companies pay premiums and deposits
- Prudential invests the money, mostly in bonds and loans
- Investment income builds up
- It pays claims, pensions and interest credited
- What is left after costs and tax is profit
↺ Step 5 feeds back into step 1.
05Business segments · FY2025
Which businesses make up Prudential Financial?
Retirement Strategies
38.5%Pension takeovers and annuities in the US. Ebit here is the company's adjusted operating income before tax.
Revenue $22.2B ($22,198M) · Operating profit $3.4B ($3,445M)
International Businesses
31.5%Life insurance in Japan, Brazil and Mexico. From Q3 FY2026 the company reports Japan Businesses instead, with Brazil and Mexico moved to Corporate and Other.
Revenue $18.1B ($18,148M) · Operating profit $3.2B ($3,247M)
Group Insurance
11.7%Life and disability cover bought by employers.
Revenue $6.8B ($6,774M) · Operating profit $381M
Individual Life
10.6%Life policies sold to US families.
Revenue $6.1B ($6,130M) · Operating profit $260M
PGIM
7.3%Investment management for outside clients and Prudential's insurers.
Revenue $4.2B ($4,231M) · Operating profit $878M
Corporate and Other
0.3%Head-office items that sit outside the business segments.
Revenue $196M · Operating profit −$1.6B (−$1,574M)
How the mix changed
- Retirement Strategies
- International Businesses
- Group Insurance
- Individual Life
- PGIM
- Corporate and Other
Revenue by segment, FY2023 to FY2025.
US$
See the numbers
06The numbers · Consolidated · US$
How has Prudential Financial done?
Premiums
$30.8BFY2025
Premiums were $30,797 million in FY2025, down from $42,897 million in FY2024, the year with more pension risk transfer sales.
US$ · premiums from policyholders and plan members, as reported
See the yearly numbers
See the quarterly numbers
Net income
$3.6BFY2025
Net income of $3,576 million in FY2025 came with $21,473 million of net investment income and $4,132 million of net realized investment losses.
US$ · after claims, costs, investment results and tax; the table shows where it came from
See the numbers
See all yearly numbers
Net investment income is interest and dividends on the money the company holds before paying claims; realized and unrealized gains are shown apart because they move with markets. Net income is the amount for common stockholders. Fiscal years are the company's own (Fiscal year is the calendar year, ending Dec 31).
- "Claims" is the 10-K line policyholders' benefits; "underwriting expenses" is general and administrative expenses plus amortization of deferred policy acquisition costs.
- "Fees and other" adds policy charges and fee income, asset management and service fees and other income. The "unrealized gains" column holds the 10-K line "change in value of market risk benefits, net of related hedging gains (losses)", a fair-value change recognized in income.
- Other lines in the total = total investments minus the listed lines (Cityfort calculation from the FY2025 10-K). FY2021 and FY2022 are as restated in the FY2023 10-K for the new long-duration insurance accounting rules (LDTI).
Learn: How to read a US earnings release: Nvidia's Q2 fiscal 2027 · What is return on equity? Profit on equity, with real US companies · Fiscal years that don't end in December: Nvidia's FY2027 explained
Sources (7)
07Who runs it
Who runs Prudential Financial, and did they deliver?
Andrew F. Sullivan
Chairman, President and CEO · since 2025
CEO since March 2025 and Chairman since March 10, 2026; earlier ran International Businesses and Global Investment Management.
Yanela C. Frias
Executive Vice President and CFO · since 2024
Jacques P. Chappuis
President and CEO, PGIM · since 2025
Joined from Morgan Stanley Investment Management.
Phil Waldeck
Executive Vice President, Head of U.S. Businesses · since 2026
Ann M. Kappler
Executive Vice President and General Counsel
What they said, and what happened
2 too early to tell
Said on Dec 10, 2025
The board authorized buying back up to $1.0 billion of shares from Jan 1 to Dec 31, 2026.
Too early to tellWhat happened
7.0 million shares were bought for $750 million by Sep 30, 2026.
Said on May 5, 2026
The Q1 FY2026 earnings release said PGIM "is on track to achieve its margin expansion target."
Too early to tellWhat happened
The target figure is not stated in the filings used for this page.
08What could go wrong
What could go wrong for Prudential Financial?
- Regulation
Japan sales suspension
Prudential of Japan may not solicit new business through Jan 31, 2027. The company estimates the cost at about $500 million of Japan pre-tax adjusted operating income in 2026 and $500 million to $550 million in 2027, and says it would be greater if the suspension runs past January 2027.
Watch Whether the order ends on Jan 31, 2027, and Japan new business premiums in the next quarterly supplements.
- Debt
Rating outlooks turned negative
Moody's, Fitch and S&P (holding company) moved their outlooks to Negative in October 2026. The 10-K says an AM Best downgrade of the US life companies to "A-" would require about $0.8 billion of collateral.
Watch Rating agency actions on Prudential and its insurers.
- Demand
Lumpy pension deals
Premiums were $42,897 million in FY2024 and $30,797 million in FY2025. The 10-K says premiums were $12,100 million lower, primarily reflecting lower pension risk transfer premiums due to lower sales.
Watch Retirement sales and additions each quarter.
- Other
Bond values and book value
Accumulated other comprehensive incomePaper gains and losses, such as on some investments or currency moves, not yet counted in profit. (AOCI) was -$6,854 million at Sep 30, 2026, against -$3,077 million at Dec 31, 2025. GAAP book value per share fell to $84.88 from $92.05 over the same period.
Watch AOCI and book value per share in each quarterly supplement.
- Competition
PGIM flows
PGIM net flows over the 12 months to Sep 30, 2026 were -$0.7 billion, against $21.5 billion a year earlier. The 10-K describes intense competition from insurers, asset managers and private equity firms.
Watch PGIM third-party net flows and assets under management.
- Execution
Sales of foreign units still to close
The sale of the Brazil and Mexico units to CNP Assurances Group needs regulatory approvals; the company said in an 8-K filed Oct 20, 2026 that it expects closing in the second half of 2027. A sale of the 33% stake in Alexander Forbes (South Africa) also awaits approvals.
Watch Closing announcements in 8-K filings.
Sources (5)
09Supporters vs. critics
What do supporters and critics point to?
What supporters point to
- Net income rose from $2,488 million in FY2023 to $2,727 million in FY2024 and $3,576 million in FY2025.
- After-tax adjusted operating income, the company's own measure that leaves out investment gains and losses, was $5,161 million in FY2025, and its operating return on average equity was 14.9%.
- The Q3 FY2026 release says PGIM's third-party net flows reached their highest level in 10 quarters, at $9.0 billion of net inflows.
- The FY2025 dividend of $5.40 a share was up from $5.20 in FY2024, and the company bought back $1,000 million of shares in each of FY2024 and FY2025.
- On Oct 20, 2026 Prudential agreed to sell its Brazil and Mexico units to CNP Assurances Group for about $4.025 billion in cash.
What critics point to
- Prudential of Japan may not solicit new business through Jan 31, 2027, under a Financial Services Agency order that followed findings of misconduct by certain employees. The company estimates the cost at about $500 million of Japan pre-tax adjusted operating income in 2026.
- Moody's, Fitch and S&P (for the holding company) moved their outlooks to Negative in October 2026, as the Q3 FY2026 10-Q reports.
- Net income per $100 of revenue fell from $12.4 in FY2021 to $5.9 in FY2025, with a net loss of $1,647 million in FY2022.
- GAAP book value per share fell from $92.05 at Dec 31, 2025 to $84.88 at Sep 30, 2026, as accumulated other comprehensive income went from -$3,077 million to -$6,854 million.
- PGIM net flows over the 12 months to Sep 30, 2026 were -$0.7 billion, against $21.5 billion a year earlier.
10What to watch next
What should you watch next at Prudential Financial?
Next event
Q4 and full-year FY2026 results
Date not announced yet.
The Japan sales suspension
The order on Prudential of Japan runs through Jan 31, 2027. Japan annualized new business premiums were $287 million in Q3 FY2026, against $453 million in Q3 FY2025.
Credit ratings
Three agencies moved their outlooks to Negative in October 2026. The FY2025 10-K says an AM Best downgrade of the US life companies to "A-" would require about $0.8 billion of collateral.
Closing the Brazil and Mexico sale
The sale to CNP Assurances Group needs regulatory approvals; in an 8-K filed Oct 20, 2026 the company said it expects closing in the second half of 2027.
Book value per share
GAAP book value per share was $84.88 at Sep 30, 2026, against $92.05 at Dec 31, 2025, as bond values moved accumulated other comprehensive income lower.
11Key facts
Key facts about Prudential Financial
- What does Prudential Financial do?
- Prudential Financial, Inc. sells life insurance, annuities and retirement products in the US and Japan, and takes over company pension plans. Its PGIM arm invests money for outside clients and for Prudential itself. Prudential Financial had total revenues of $60,774 million in FY2025 and about $1.616 trillion of assets under management at Sep 30, 2026.
- How does Prudential Financial make money?
- Prudential Financial collects premiums and deposits, invests the money and pays it back later as claims, benefits and interest. In FY2025 it earned $30,797 million of premiums and $21,473 million of net investment income. Claims and benefits took $53.9 of every $100 that came in, and $5.5 was left as net income.
- Who are Prudential Financial's customers?
- Prudential Financial's customers are companies handing over pension plans, people buying annuities, employers buying group cover, families in Japan and Latin America, and investors using PGIM. In FY2025 Retirement Strategies had $22,198 million of segment revenue and International Businesses $18,148 million. The FY2025 10-K names no customer providing 10% or more of revenue.
- Is Prudential Financial profitable?
- Yes. Prudential Financial reported net income of $3,576 million in FY2025 (diluted EPS of $9.99), up from $2,727 million in FY2024. It had a net loss of $1,647 million in FY2022. Net income was $1,388 million in Q3 FY2026, against $1,431 million in Q3 FY2025.
- What is PGIM?
- PGIM is Prudential Financial's investment management business, serving pension funds, institutions, retail investors and Prudential's own insurers. PGIM had revenue of $4,231 million and adjusted operating income before tax of $878 million in FY2025, and managed $1.465 trillion at Sep 30, 2026.
- Who owns Prudential Financial?
- Prudential Financial has one class of common stock with one vote per share and 343 million shares outstanding at Oct 30, 2026. The 2026 proxy lists The Vanguard Group with 11.71% and BlackRock with 9%. Directors and executive officers as a group owned less than 1% at Mar 13, 2026.
- Does Prudential Financial pay a dividend?
- Yes. Prudential Financial paid four quarterly dividends of $1.35 a share in FY2025, $5.40 in all (Cityfort calculation from the Q4 FY2025 financial supplement). It declared $1.40 a share in each of the first three quarters of 2026. It bought back $1,000 million of its shares in each of FY2024 and FY2025.
- Is Prudential Financial the same company as Prudential plc?
- No. Prudential Financial, Inc. of the US states in its 2026 proxy that it is not affiliated with Prudential plc of the UK. The FY2025 10-K says the two have had an agreement since 2004 on their rights to use the names "Prudential" and "Pru".
- When did Prudential stop being a policyholder-owned mutual?
- On Dec 18, 2001, The Prudential Insurance Company of America, founded in 1875 in Newark, New Jersey, converted from a mutual owned by its policyholders to a stock company and became a wholly-owned subsidiary of Prudential Financial. Prudential Financial shares trade on the NYSE under the symbol PRU.
Sources (7)
Terms on this page
Each explains the term in plain English, with the same number from other companies on Cityfort.
Go deeper
More detail from the same filings. Open any section.
12What it sells
12What it sells
What does Prudential Financial sell?
Retirement products (US)
Takes over pension payments from companies (pension risk transfer) and sells annuities, which pay people an income in retirement.
Group insurance
Life and disability cover that employers buy for their workers.
Individual life insurance
Term, universal and variable life policies sold to US families.
Life insurance in Japan
Sold by Prudential of Japan through its Life Planner sales force and by Gibraltar Life through Life Consultants, banks and agencies.
PGIM (investment management)
Manages bonds, shares, property and private loans for pension funds, retail investors and Prudential's own insurers: $1,465.0 billion at Sep 30, 2026.
Think of it like this
A little like a bank for long promises: customers pay in now, and Prudential invests the money until it must pay a pension or a death benefit.
What it does
- Does: Pays pensions that companies hand over to it
- Does: Sells life insurance and annuities in the US and Japan
- Does: Manages money for outside clients through PGIM
What it does not do
- Does not: It is not part of Prudential plc of the UK; the 10-K says the two have no affiliation
- Does not: Its sale of Prudential of Brazil and Prudential of Mexico had not closed by Nov 4, 2026
13How the money flows
13How the money flows · FY2025
How does money flow through Prudential Financial?
Money in
- Premiums$30.8B
- Net investment income$21.5B
- Policy charges and asset management fees$8.7B
- Other income$4.4B
- Earnings from joint ventures, after tax$129M
The company
Prudential Financial
$65.5B came in
Money out
- Claims and benefits paid to policyholders$35.3B
- Interest credited and policyholder dividends$6.1B
- Running costs and sales costs written off$14.6B
- Realized investment losses and market risk benefit changes$4.6B
- Income tax$1.1B
- Share of outside (noncontrolling) owners$156M
- Net income for Prudential shareholders$3.6B
- Customers pay premiums and fees: $39,482 million in FY2025.
- Prudential invests the money it holds, and those investments earned $21,473 million.
- Most of the money goes back out as claims, benefits and interest credited to policyholders.
- Running costs, investment losses and tax take most of the rest.
- $3,576 million was left as net income for shareholders.
Sources (1)
14What it needs to run
14What it needs to run
What does Prudential Financial need to run?
An investment portfolio
$470,519 million of investments at Dec 31, 2025, mostly bonds and commercial mortgages, earn the income that pays future claims.
High credit ratings
Pension plans and policyholders buy long promises. Prudential Insurance Company of America is rated AA- by S&P and Aa3 by Moody's (as of Nov 3, 2026).
Sales forces
At Sep 30, 2026: 3,197 Prudential Advisors in the US, and 3,943 Life Planners and 6,987 Life Consultants in Japan.
Insurance licenses
Its insurers are regulated in each market; in Japan, the Financial Services Agency ordered Prudential of Japan to stop soliciting new business through Jan 31, 2027.
15Competitors and what protects it
15Competitors and what protects it
Who does Prudential Financial compete with?
MetLife, Inc.
NYSE: MET
Named in Prudential's 2026 proxy as a competitor whose return on equity it compares with its own for executive pay.
Lincoln National
Named in Prudential's 2026 proxy as a competitor whose return on equity it compares with its own for executive pay.
Principal Financial Group
Named in Prudential's 2026 proxy as a competitor whose return on equity it compares with its own for executive pay.
Aflac Incorporated
Named in Prudential's 2026 proxy as a competitor whose return on equity it compares with its own for executive pay.
Voya Financial
Named in Prudential's 2026 proxy as a competitor whose return on equity it compares with its own for executive pay.
What protects the business
Each strength is scored 1 (weak) to 5 (strong) for the business, with the reason. It is not a rating of the share.
- Scale in asset management4 of 5
PGIM managed $1,465.0 billion and Prudential $1,616.2 billion in total at Sep 30, 2026.
- Financial strength ratings4 of 5
Prudential Insurance Company of America is rated A+ (AM Best), AA- (S&P), Aa3 (Moody's) and AA- (Fitch) as of Nov 3, 2026.
- Brand3 of 5
The 10-K calls its names and marks significant competitive assets; it shares rights to the "Prudential" name with the unrelated UK company Prudential plc under a 2004 agreement.
- Sales forces in Japan2 of 5
Japan had 3,943 Life Planners and 6,987 Life Consultants at Sep 30, 2026. Life Planner sales were suspended from Feb 9, 2026, and the FSA suspended new Life Consultant sales at Gibraltar Life from Oct 13, 2026 through Jan 31, 2027.
Weak spot
Japan sales suspension
Japan sales through Life Planners fell to $9 million of annualized new business premiums in Q3 FY2026, from $173 million a year earlier.
16Where growth could come from
16Where growth could come from
Where could Prudential Financial's growth come from?
In its Q3 FY2026 10-Q, filed Nov 4, 2026, Prudential said it estimates the Prudential of Japan sales suspension will cut Japan Businesses pre-tax adjusted operating income by about $500 million in 2026 and $500 million to $550 million in 2027.
PGIM outside money
Mixed$9.0B third-party net inflows, Q3 FY2026
Over the 12 months to Sep 30, 2026, PGIM net flows were -$0.7 billion, against $21.5 billion a year earlier. CEO Andy Sullivan said third-party net flows were the highest in 10 quarters.
Status: Mixed, partly on track.
Retirement sales
Mixed$8,194M sales and additions, Q3 FY2026
Down from $9,730 million in Q3 FY2025; retail annuity sales rose to $3,882 million from $3,377 million.
Status: Mixed, partly on track.
Japan sales
Behind$287M new business premiums, Q3 FY2026
Annualized new business premiums in Japan fell from $453 million in Q3 FY2025 during the sales suspensions.
Status: Behind, behind the company's own plan.
Group Insurance
Working$682M sales, first nine months of 2026
Sales were up 23% on the same period of 2025, as the Q3 FY2026 release reports.
Status: Working, on track against what the company said.
Selling Brazil and Mexico
NewAbout $4.025B in cash, agreed Oct 20, 2026
The buyer is CNP Assurances Group. The company said in an 8-K filed Oct 20, 2026 that it expects closing in the second half of 2027, subject to regulatory approvals.
Status: New, recently announced.
Status compares progress with what the company itself said it would do: Working = on track against what the company said; Mixed = partly on track; Behind = behind the company's own plan; New = recently announced; Early = too early to judge.
17The company's own measures (non-GAAP)
17The company's own measures · FY2025
What do Prudential Financial's own measures show?
Official (GAAP): Net income attributable to Prudential Financial
$3.6B
Company's own measure: After-tax adjusted operating income
$5.2B
Leaves out realized investment gains and losses, market risk benefit changes and other items the company lists in its reconciliation.
Official (GAAP): Return on average equity (net income)
11.7%
Company's own measure: Operating return on average equity
14.9%
Uses adjusted operating income instead of net income, as the company defines it.
Official (GAAP): Shareholders' equity (GAAP)
$32.4B
Company's own measure: Adjusted book value, Dec 31, 2025
$35.3B
Equity excluding accumulated other comprehensive income (AOCI) and two other fair-value items the company names.
These are the company's own measures, defined by the company. They are not comparable across companies, and they are not added together. Each sits beside the nearest official (GAAP) figure.
Learn: Non-GAAP measures: what a company's "adjusted" numbers leave out
18Financial strength: investments, debt, capital
18Financial strength · Dec 31, 2025
How strong is Prudential Financial's balance sheet?
What the premiums are invested in
- Bonds available for sale$331.5B
70.4% of the investments listed
- Commercial mortgage and other loans$64.7B
13.8% of the investments listed
- Other invested assets$27.3B
5.8% of the investments listed
- Bonds held for trading$14.9B
3.2% of the investments listed
- Shares (equity securities)$11.0B
2.3% of the investments listed
- Policy loans$10.0B
2.1% of the investments listed
- Short-term investments$6.4B
1.4% of the investments listed
- Other lines in the total$4.8B
1.0% of the investments listed
Shares of the portfolio: Cityfort calculation from the FY2025 10-K, each type ÷ the total listed.
- Book value per share
- $92.05
- shareholders' equity per share at the end of FY2025, as reported
- Return on equity
- 11.7%
- net income as % of average shareholders' equity, as reported
- Investments
- $470.5B
- money held in bonds, stocks and cash until claims are paid
- Debt
- $20.3B
- borrowings on the balance sheet
- Shareholders' equity
- $32.4B
- what the company owns minus what it owes
- Debt to capital
- 38.5%
- Cityfort calculation from the FY2025 10-K: debt ÷ (debt + shareholders' equity)
The Q3 FY2026 10-Q states a risk-based capital (RBC) ratio of 415% for Prudential Insurance Company of America at Dec 31, 2025, its latest statutory year end.
Figures at Dec 31, 2025, consolidated, as reported by the company in its 10-K and earnings release; see the dates on each source.
19Who owns it
19Who owns it · ownership as of Mar 13, 2026
Who owns Prudential Financial?
Share classes
Holders of 5% or more
From the company's proxy statement (DEF 14A), later Schedule 13G filings and the share counts on its latest annual or quarterly report. Each holder row shows the date of its own filing.
Learn: How to read a proxy statement (DEF 14A): Nvidia's 2026 proxy · Form 4 insider filings: who files, the codes and the footnotes
20What it does with profit
20What it does with profit
What does Prudential Financial do with its profit?
Dividend per share
$5.40FY2025
Dividend paid for each share, by financial year.
$ per share
See the numbers
No buybacks or fund raises in the period covered.
21Governance signals
21Governance signals
What do Prudential Financial's governance filings show?
- Auditor
- PricewaterhouseCoopers LLP, since 1996
- Auditor changes
- None in the period covered
- Audit qualifications
- None reported
- Related-party dealings
- The 10-Q's related-party note covers Prismic: in September 2023 Prudential invested about $200 million in Prismic, a Bermuda life and annuity reinsurer it formed with Warburg Pincus and other investors, and it has reinsured (passed on) blocks of policies to it.
- Credit rating
- AM Best, S&P, Moody's and Fitch (as listed in the Q3 FY2026 financial supplement) Prudential Financial, Inc. senior debt: a- / A / A3 / A-; Prudential Insurance Company of America financial strength: A+ / AA- / Aa3 / AA- (outlook Negative at Moody's (Oct 16, 2026), Fitch (Oct 22, 2026) and S&P for the holding company (Oct 15, 2026), per the Q3 FY2026 10-Q), Nov 3, 2026
A credit rating describes the company's ability to repay debt. It is not a rating of the share.
Flags to know about
regulatory
Japan sales suspension
In January 2026, Prudential of Japan reported the findings of an internal investigation into misconduct involving certain employees. It suspended new sales from Feb 9, 2026; in October 2026 Japan's Financial Services Agency issued a business suspension order through Jan 31, 2027, with a partial order on Gibraltar Life's Life Consultant sales.
disclosure
No call transcripts used
Earnings-call transcripts and investor presentations were not among the documents used for this page, so management's call remarks are not shown.
22What the market paid
22What the market paid · price as of Sep 30, 2026
What did the market pay for Prudential Financial on Sep 30, 2026?
Price as of Sep 30, 2026 (shown for education; prices change daily).
Price as of Sep 30, 2026: Prudential's closing price was $113.58, as reported in its Q3 FY2026 financial supplement; the shares trade on the NYSE. The supplement states a market value of $39,026 million on that date. P/E is price ÷ earnings per share: 10.3 on diluted EPS of $10.99 for the four quarters to Sep 30, 2026 (Cityfort calculation from the Q4 FY2025 financial supplement and the Q1 to Q3 FY2026 10-Qs). P/B is price ÷ book value per share: 1.34 on GAAP book value of $84.88 a share at Sep 30, 2026 (Cityfort calculation from the Q3 FY2026 financial supplement).
- Share price
- $113.58
- Market value (market cap)
- $39.0B
- P/E
- 10.3×
- P/B
- 1.3×
More price-based ratios · as of Sep 30, 2026
Each ratio divides a number from the company's filings by the market value or share price on Sep 30, 2026. Prices change daily, so these ratios do too.
Price to sales (P/S)
0.6×
$39.0B market value ÷ $61.3B revenue (four quarters to Sep 30, 2026) = 0.6×
Cityfort calculation from the Sep 30, 2026 closing price and the Q4 FY2025 to Q3 FY2026 10-Qs and 8-Ks. Source: Prudential Financial, Inc. Q3 2026 quarterly financial supplement (8-K Ex. 99.2); Prudential Financial, Inc. Q4 2025 quarterly financial supplement (8-K Ex. 99.2); Form 10-Q for Q1 FY2026 and 2 more
How price ratios workDividend yield
4.75%
$5.40 dividends per share (FY2025) ÷ $113.58 share price = 4.75%
Cityfort calculation from the FY2025 8-K and the Sep 30, 2026 closing price. Source: Prudential Financial, Inc. Q3 2026 quarterly financial supplement (8-K Ex. 99.2); Prudential Financial, Inc. Q4 2025 quarterly financial supplement (8-K Ex. 99.2); Form 10-Q for Q1 FY2026 and 2 more
What dividend yield means
Shares used for the market value: 343 million ($113.58 × 343 million shares ≈ $39.0B). Source: Form 10-Q for Q3 FY2026; Prudential Financial, Inc. 2026 proxy statement (DEF 14A)
Source: Prudential Financial, Inc. Q3 2026 quarterly financial supplement (8-K Ex. 99.2); Prudential Financial, Inc. Q4 2025 quarterly financial supplement (8-K Ex. 99.2); Form 10-Q for Q1 FY2026 and 2 more
23How it got here
23How it got here
How did Prudential Financial get here?
1875
Milestone
Founded in Newark, New Jersey
The 2026 proxy gives 1875 as its founding year and Newark, New Jersey as its home.
2001
Business-model change
Converted from a mutual
On Dec 18, 2001 The Prudential Insurance Company of America converted from a mutual owned by its policyholders to a stock company and became a wholly-owned subsidiary of Prudential Financial; a closed block kept old participating policies apart. Prudential Financial shares trade on the NYSE as PRU.
2022
Business-model change
Sold two US businesses
In April 2022 it sold its Full Service Retirement business, reinsured to Empower, and the annuity company now called Fortitude Life Insurance and Annuity Company.
2023
Milestone
Launched Prismic
In September 2023 it invested about $200 million in Prismic, a Bermuda reinsurer formed with Warburg Pincus and other investors.
2025
Milestone
New CEO
Andrew F. Sullivan became CEO in March 2025 and also Chairman in March 2026.
2026
Crisis
Japan misconduct and sales suspension
Prudential of Japan reported findings of employee misconduct in January 2026 and stopped new sales from February; a regulator's order extended this to Jan 31, 2027.
2026
Business-model change
Agreed to sell Brazil and Mexico
On Oct 20, 2026 it agreed to sell both units to CNP Assurances Group for about $4.025 billion in cash; from Q3 FY2026 they sit in Divested and Run-off Businesses.
24Sources and changes
Where every number on this page comes from
Sources (24 documents)
- S1Form 10-Q for Q3 FY2026 · SEC EDGAR · Tier 1: company or exchange filing · Nov 4, 2026
- S2Form 10-Q for Q2 FY2026 · SEC EDGAR · Tier 1: company or exchange filing · Aug 5, 2026
- S3Form 10-Q for Q1 FY2026 · SEC EDGAR · Tier 1: company or exchange filing · May 6, 2026
- S4Form 10-K for FY2025 · SEC EDGAR · Tier 1: company or exchange filing · Feb 12, 2026
- S5Form 10-Q for Q3 FY2025 · SEC EDGAR · Tier 1: company or exchange filing · Oct 30, 2025
- S6Form 10-Q for Q2 FY2025 · SEC EDGAR · Tier 1: company or exchange filing · Jul 31, 2025
- S7Form 10-Q for Q1 FY2025 · SEC EDGAR · Tier 1: company or exchange filing · May 1, 2025
- S8Form 10-K for FY2024 · SEC EDGAR · Tier 1: company or exchange filing · Feb 13, 2025
- S9Form 10-Q for Q3 FY2024 · SEC EDGAR · Tier 1: company or exchange filing · Oct 31, 2024
- S10Form 10-Q for Q2 FY2024 · SEC EDGAR · Tier 1: company or exchange filing · Aug 2, 2024
- S11Form 10-Q for Q1 FY2024 · SEC EDGAR · Tier 1: company or exchange filing · May 2, 2024
- S12Form 10-K for FY2023 · SEC EDGAR · Tier 1: company or exchange filing · Feb 21, 2024
- S13Form 10-K for FY2022 · SEC EDGAR · Tier 1: company or exchange filing · Feb 16, 2023
- S14Form 10-K for FY2021 · SEC EDGAR · Tier 1: company or exchange filing · Feb 17, 2022
- S15Prudential Financial, Inc. 2026 proxy statement (DEF 14A) · SEC EDGAR · Tier 1: company or exchange filing · Mar 26, 2026
- S16Prudential Financial, Inc. Q3 2026 earnings release (8-K Ex. 99.1) · SEC EDGAR · Tier 1: company or exchange filing · Nov 3, 2026
- S17Prudential Financial, Inc. Q3 2026 quarterly financial supplement (8-K Ex. 99.2) · SEC EDGAR · Tier 1: company or exchange filing · Nov 3, 2026
- S18Prudential Financial, Inc. Q1 2026 earnings release (8-K Ex. 99.1) · SEC EDGAR · Tier 1: company or exchange filing · May 5, 2026
- S19Prudential Financial, Inc. Q4 2025 earnings release (8-K Ex. 99.1) · SEC EDGAR · Tier 1: company or exchange filing · Feb 3, 2026
- S20Prudential Financial, Inc. Q4 2025 quarterly financial supplement (8-K Ex. 99.2) · SEC EDGAR · Tier 1: company or exchange filing · Feb 3, 2026
- S22Prudential Financial, Inc. Q4 2024 quarterly financial supplement (8-K Ex. 99.2) · SEC EDGAR · Tier 1: company or exchange filing · Feb 4, 2025
- S23Prudential Financial, Inc. 8-K: agreements to sell Prudential of Brazil and Prudential of Mexico · SEC EDGAR · Tier 1: company or exchange filing · Oct 20, 2026
- S26Prudential Financial, Inc. 8-K: leadership change · SEC EDGAR · Tier 1: company or exchange filing · Mar 10, 2026
- S27Prudential Financial, Inc. 8-K: $1.0B 2026 share repurchase authorization · SEC EDGAR · Tier 1: company or exchange filing · Dec 10, 2025
Changes to this page (v1 · Nov 20, 2026)
- v1 · Nov 20, 2026First version. (first version)
Numbers come only from tier 1 and tier 2 sources. Read how we research.
Disclaimer
For learning only. Cityfort is not a registered investment adviser or broker-dealer and does not recommend buying or selling any security. Prices shown are dated and may be out of date.
Investing in securities involves risk, including loss of capital. Before making any investment decision, do your own research and consider consulting a registered investment adviser or other qualified professional.
Cityfort, its owners and contributors may or may not hold securities of companies covered. Cityfort is not paid by any company it covers. Content is not an offer or solicitation to buy or sell any security, including in any initial public offering.
Read the positions policyRead the full disclaimerHide the full disclaimer
Cityfort publishes general educational content that explains how listed companies work. Cityfort is not registered with the US Securities and Exchange Commission or any state securities regulator as an investment adviser, and is not a broker-dealer or a member of FINRA. Cityfort does not provide investment, tax or legal advice, recommendations, ratings, price targets or any opinion on whether to buy, sell or hold any security. Nothing on the site is tailored to any person's circumstances.
All information is taken from publicly available sources, mainly company filings with the SEC, which are listed on each page with dates. We work to keep it accurate and correct errors publicly, but we do not guarantee that it is complete, accurate or up to date. Any market price or price-based ratio shown is dated, may be out of date by the time you read it, and is included only to explain concepts.
Statements by company management, including forward-looking statements and guidance, are reported as the company's statements, with their date and source; they are not our forecasts. Adjusted (non-GAAP) figures are the company's own measures and are shown next to the official (GAAP) figures.