Financials · NYSE: BAC
Bank of America: how the business works
Bank of America takes deposits, makes loans, manages money through Merrill and trades for big investors, with revenue of $113.1 billion in FY2025.
By Hardik Bhandare · Checked against filings: . Editorial policy. Corrections
Follow Bank of America
Email me when Bank of America's page is updated after earnings.
We'll send a confirmation email first. See our privacy policy.
Bank of America Corporation · Charlotte, North Carolina
Updated for Q3 FY2026 · checked
- Revenue, FY2025
- $113.1B
- Net income to common stockholders, FY2025
- $29.1B
- Deposits, Sep 30, 2026
- $2.04 trillion
- Consumer and small business clients, Dec 31, 2025
- About 69 million
- Employees, Sep 30, 2026
- 209,911
The short version
Bank of America in 5 points
1 · What it sells
Bank of America takes deposits, makes loans, runs the Merrill wealth business and trades for institutional investors, with revenue of $113.1 billion in FY2025.
2 · Who pays it
Bank of America does not split revenue by customer; in FY2025, 53% of revenue was net interest income from borrowers and securities and 47% was fees, trading and other income.
3 · What it keeps from $100
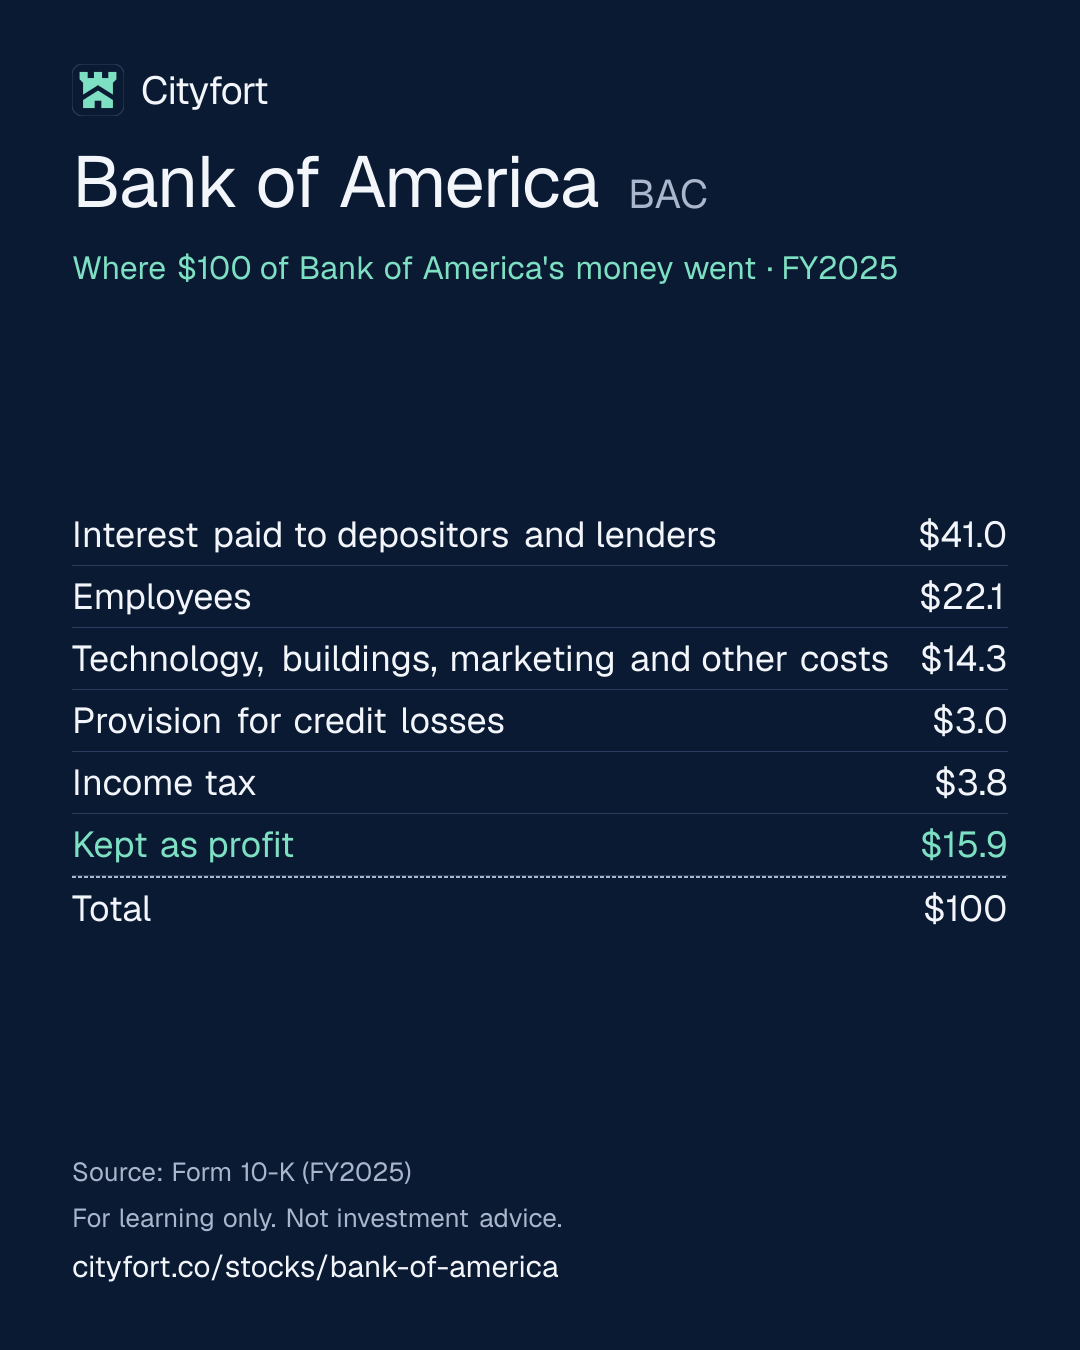
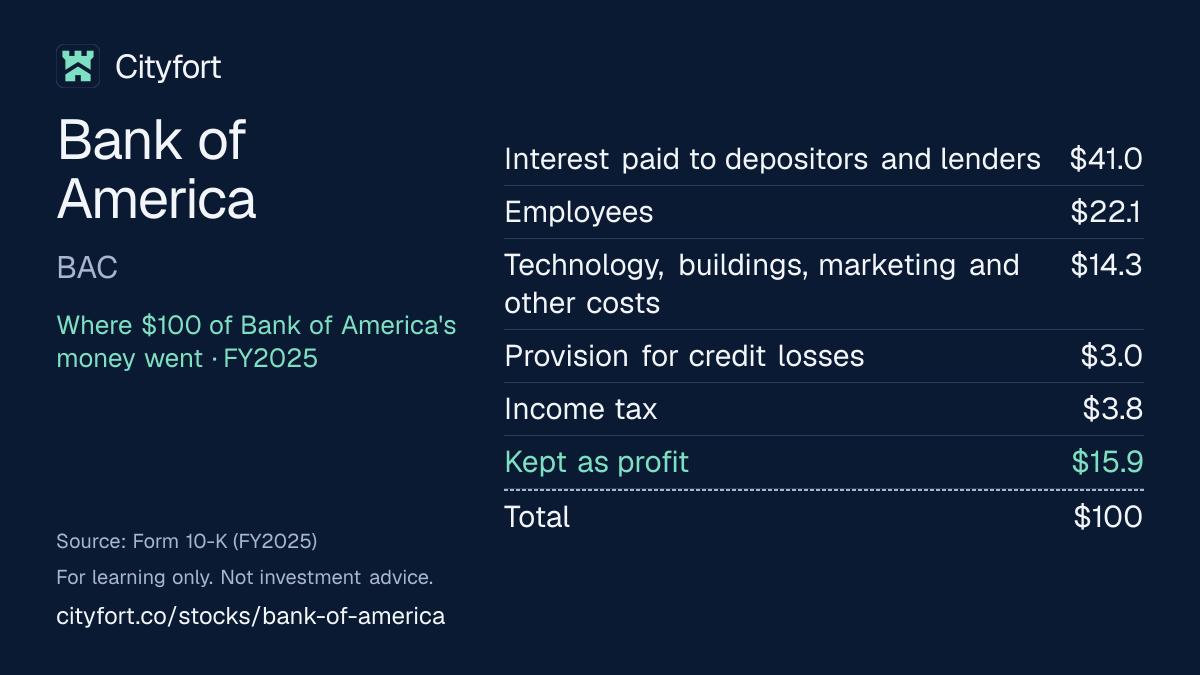
Of every $100 that came in during FY2025, Bank of America paid $41.0 in interest to depositors and lenders and kept $15.9 as profit, $15.2 of it for common stockholders.
4 · Where the operating profit comes from
Of FY2025 segment net income, Consumer Banking earned $12.2 billion, Global Banking $7.8 billion, Global Markets $6.1 billion and Global Wealth & Investment Management $4.7 billion, with a $0.3 billion loss in All Other.
5 · The one thing to watch
Bank of America's CET1 capital ratio was 10.9% at Sep 30, 2026, down from 11.9% at the end of FY2024, against a 10.0% regulatory minimum.
Sources: From Bank of America's FY2025 10-K and Q3 FY2026 10-Q · checked
See the full receipt and the management scorecard below
01Where $100 of a bank's money goes · FY2025
Where does $100 of Bank of America's money go?
Bank of America · FY2025
Receipt for every $100
| Interest paid to depositors and lenders | $41.0 |
|---|---|
| Employees | $22.1 |
| Technology, buildings, marketing and other costs | $14.3 |
| Provision for credit losses | $3.0 |
| Income tax | $3.8 |
| Kept as profit | $15.9 |
| Total | $100 |
Each line = amount ÷ total money in × 100. Lines may not add to exactly $100 because of rounding.
How this is worked out
Cityfort calculation from the FY2025 10-K. Of every $100 that came in (interest income $138,566 million plus noninterest income $53,001 million = $191,567 million): each line = line ÷ $191,567 million × 100. Of the $15.9 kept, $15.2 was for common stockholders after preferred dividends.
Save this receipt as an image:
1080 × 1350 PNG for Instagram, LinkedIn1200 × 675 PNG for X
Embed this receipt
Paste this code into a blog or website to show the receipt, with a link back to this page:
Each week: one company explained in 5 points, picked by earnings date.
Free, no tips, unsubscribe anytime.
We'll send a confirmation email. See our privacy policy.
02The business in one line
What does Bank of America do?
Savers, borrowers and investment clients pay Bank of America; the biggest cost is the interest it pays depositors and lenders, then staff pay, and what's left is profit.
- It held $2.04 trillion of deposits and $1.25 trillion of loans at Sep 30, 2026.
- Of every $100 that came in during FY2025, $41.0 went to depositors and lenders as interest and $22.1 to employees.
03Who pays it
Who pays Bank of America?
Borrowers and the issuers of securities it holds
53%
of revenue
Interest on loans, bonds and other assets, minus the interest Bank of America pays depositors and lenders (net interest income)
Clients paying fees and trading spreads
47%
of revenue
Wealth and brokerage fees, investment banking fees, market making, card fees and account service charges (noninterest income)
- Borrowers and the issuers of securities it holds53%
- Clients paying fees and trading spreads47%
How spread out the customers are
The 10-K does not report revenue by customer. Bank of America serves about 69 million consumer and small business clients, plus companies, governments and institutional investors.
04Why it makes money
Why does Bank of America make money?
It earns the gap between what borrowers pay and what depositors get, plus fees from wealth, deal and trading clients
Deposits are its main source of money: $2.02 trillion at the end of FY2025, with 26.4% paying no interest. The wider the gap between what it earns on loans and securities and what it pays for that money, the more net interest income it makes. Fees from Merrill, investment banking and trading are a second stream that does not depend on lending.
Net interest yield
1.7%2.0%
FY2021 to FY2025
- Collect deposits
- Lend and invest them
- Earn interest
- Pay depositors and lenders
- Add fees from wealth, deals and trading
- Keep what is left after costs and credit losses
↺ Step 6 feeds back into step 1.
05Business segments · FY2025
Which businesses make up Bank of America?
Consumer Banking
38%Accounts, cards, mortgages and loans for people and small businesses in the US. Net income: $12.2 billion in FY2025.
Revenue $43.7B
Global Wealth & Investment Management
22%Merrill financial advisors and the Private Bank manage money for clients with over $250,000 to invest. Net income: $4.7 billion in FY2025.
Revenue $24.9B
Global Banking
21%Loans, cash management and investment banking for companies, from mid-sized firms to global corporations. Net income: $7.8 billion in FY2025.
Revenue $24.1B
Global Markets
21%Sales, trading and market making in bonds, stocks, currencies and commodities for institutional investors. Net income: $6.1 billion in FY2025.
Revenue $24.1B
How the mix changed
- Consumer Banking
- Global Wealth & Investment Management
- Global Banking
- Global Markets
Revenue by segment, FY2023 to FY2025.
US$
See the numbers
06The numbers · Consolidated · US$
How has Bank of America done?
Net interest income
$60.1BFY2025
Net interest income rose from $42.9 billion in FY2021 to $60.1 billion in FY2025, and was $16.4 billion in Q3 FY2026.
* FY2021: as first reported; FY2022: as first reported; Q3 FY2026: after a $1.2B settlement charge.
US$ · interest earned minus interest paid
See the yearly numbers
See the quarterly numbers
Net income
$29.1BFY2025
Net income to common stockholders was $6.5 billion in Q3 FY2026, after a $1.2 billion regulatory settlement charge, against $7.9 billion a year earlier.
* FY2021: as first reported; FY2022: as first reported.
US$ · after the provision for credit losses and tax
See the yearly numbers
See the quarterly numbers
Net interest margin
2.01%FY2025
Net interest yield rose from 1.66% in FY2021 to 2.01% in FY2025 and was 2.16% in Q3 FY2026.
% · net interest income as a share of the assets that earn interest, as reported by the company
See the numbers
Loans written off (net charge-offs)
0.5%FY2025
Net charge-offs were 0.50% of average loans in FY2025, against 0.25% in FY2021 and 0.57% in FY2024; the allowance was 1.12% of loans at the end of FY2025.
* FY2021: as first reported; FY2022: as first reported; Q3 FY2026: after a $1.2B settlement charge.
% of average loans · loans written off as unlikely to be repaid, minus amounts later recovered, as reported
See the yearly numbers
See the quarterly numbers
See all yearly numbers
† Restated by the company. Diluted EPS for common stockholders; FY2023 and FY2024 are as restated in the FY2025 10-K ($3.05 and $3.19, against $3.08 and $3.21 first reported).
Net interest income = interest earned on loans and securities minus interest paid to depositors and lenders. Revenue (net of interest expense) = net interest income + noninterest income (fees and other income). Provision for credit losses = money set aside for loans that may not be repaid. Net income is the amount for common stockholders. Fiscal years are the company's own (December 31).
- Revenue is total revenue, net of interest expense: net interest income plus noninterest income, US GAAP, consolidated.
- FY2023 and FY2024 are restated in the FY2025 10-K for a 2025 change in accounting for tax-credit investments, which raised noninterest income and income tax by about $4 billion a year (FY2023: $45,838 million against $41,650 million first reported). FY2021 and FY2022 are as first reported and were not restated.
- Net interest margin is Bank of America's net interest yield on a fully taxable-equivalent basis, as the company reports it.
- Loans here exclude loans carried at fair value ($3,498 million at the end of FY2025), as in the company's allowance ratio; total loans and leases were $1,185,700 million. The allowance is the allowance for loan and lease losses; with the reserve for unfunded commitments it was $14,380 million.
- CET1 is under the standardized approach, the lower of the two ratios the company reports in every year shown (advanced approaches: 12.8% at the end of FY2025, 12.0% at Sep 30, 2026). FY2021–FY2022 efficiency ratios as reported in the FY2022 10-K; FY2023 (64.07%, restated basis) is a Cityfort calculation from the FY2025 10-K.
- Net income here is net income applicable to common stockholders; total net income, before preferred dividends, was $30,509 million in FY2025. Segment revenue is on a fully taxable-equivalent basis; All Other, not shown, was −$3,054 million in FY2025.
Learn: What is net interest income and margin? NII and NIM at real US banks · How to read a US earnings release: Nvidia's Q2 fiscal 2027 · What a margin means: dollars kept per $100
Sources (6)
- Form 10-K, fiscal year 2023 (ended Dec 31, 2023)
- Form 10-K, fiscal year 2022 (ended Dec 31, 2022)
- Form 10-K, fiscal year 2025 (ended Dec 31, 2025)
- Q4 2025 Supplemental Information (8-K Exhibit 99.3, Jan 14, 2026)
- Q3 2026 Supplemental Information (8-K Exhibit 99.3, Oct 14, 2026)
- Form 10-Q, third quarter 2026 (ended Sep 30, 2026)
07Who runs it
Who runs Bank of America, and did they deliver?
Brian T. Moynihan
Chair and Chief Executive Officer · since 2010
CEO since January 2010 and Chair since October 2014; he was also President until September 2025. The board set his 2025 total compensation at $41 million, against $35 million for 2024.
Dean C. Athanasia
Co-President · since 2025
Appointment as Co-President announced Sep 12, 2025; shares responsibility for the lines of business.
James P. DeMare
Co-President · since 2025
Appointment as Co-President announced Sep 12, 2025; shares responsibility for the lines of business.
Alastair M. Borthwick
Executive Vice President and Chief Financial Officer
What they said, and what happened
3 too early to tell
Said on Apr 15, 2026
Grow 2026 net interest income by 6% to 8% over 2025, raised from the 5% to 7% given in January 2026; on Oct 14, 2026 management said it still expects approximately 8%.
Too early to tellWhat happened
Net interest income was $48,191 million in 9M FY2026, up 8.7% from 9M FY2025. The full year is reported with Q4 FY2026.
Said on Jul 14, 2026
Deliver full-year 2026 operating leverage (revenue growing faster than expenses) "in the range of 300 to 400 basis points".
Too early to tellWhat happened
In 9M FY2026 revenue rose 8.3% and noninterest expense 8.8%, including the $1.2 billion Q3 settlement charge (Cityfort calculation from the Q3 FY2026 10-Q). On Oct 14, 2026 management said it expects to return to operating leverage in Q4.
Said on Apr 15, 2026
Reach a return on average tangible common equity of 16% to 18% over the medium term, a target from the November 2025 Investor Day referred to on the Q1 FY2026 call.
Too early to tellWhat happened
It was 16.00% in Q1, 17.03% in Q2 and 12.60% in Q3 FY2026; the company's adjusted figure for Q3, leaving out the settlement charge, was 14.9%.
Sources (9)
- 2026 proxy statement (DEF 14A)
- Form 8-K, Item 8.01: CEO 2025 total compensation of $41 million (filed Feb 13, 2026)
- Form 8-K, Item 5.02: executive officer designations, Co-Presidents Athanasia and DeMare (filed Nov 26, 2025)
- Q1 2026 earnings call transcript (Apr 15, 2026)
- Q2 2026 earnings call transcript (Jul 14, 2026)
- Q3 2026 earnings call transcript (Oct 14, 2026)
- Form 10-Q, third quarter 2026 (ended Sep 30, 2026)
- Q3 2026 Supplemental Information (8-K Exhibit 99.3, Oct 14, 2026)
- Q3 2026 earnings press release (8-K Exhibit 99.1, Oct 14, 2026)
08What could go wrong
What could go wrong for Bank of America?
- Pricing
Paying more for deposits
Interest expense rose from $4.7 billion in FY2021 to $90.5 billion in FY2024 and was $78.5 billion in FY2025. The share of deposits paying no interest fell from 39.3% to 26.4% over FY2021 to FY2025.
Watch Net interest yield and noninterest-bearing deposits in each quarter's release.
- Other
Loan losses
Net charge-offs (loans written off, minus recoveries) rose from $2.2 billion in FY2021 to $6.0 billion in FY2024, then were $5.6 billion in FY2025. Credit card net charge-offs were 3.22% of card loans in Q3 FY2026.
Watch The net charge-off ratio and the provision for credit losses each quarter.
- Regulation
Capital rules
The CET1 ratio fell from 11.9% at the end of FY2024 to 10.9% at Sep 30, 2026, against a 10.0% minimum, while the bank bought back $21.4 billion of stock in FY2025. The 10-K says its G-SIB surcharge rises 0.5 point on Jan 1, 2027.
Watch CET1 ratio each quarter and the capital requirement for 2027.
- Legal
Compliance remediation
FinCEN's October 2026 consent order and the December 2024 OCC consent order require remedial work on anti-money-laundering and sanctions programs. The company said it does not expect the ongoing costs to significantly affect noninterest expense.
Watch Updates on the consent orders in each 10-Q.
- Demand
Market swings
Global Markets and wealth fees depend on trading activity and asset prices, which the 10-K lists as risk factors. Sales and trading revenue fell 5% to $5.1 billion in Q3 FY2026.
Watch Sales and trading revenue and wealth client balances each quarter.
- Technology
Cyberattacks
The 10-K lists cybersecurity incidents at the bank and at third parties as a risk; about 49 million clients used its digital channels at the end of 2025.
Watch Any cybersecurity incident disclosed in an 8-K.
Sources (6)
- Form 10-K, fiscal year 2025 (ended Dec 31, 2025)
- Form 10-K, fiscal year 2023 (ended Dec 31, 2023)
- Form 10-K, fiscal year 2022 (ended Dec 31, 2022)
- Q3 2026 Supplemental Information (8-K Exhibit 99.3, Oct 14, 2026)
- Form 10-Q, third quarter 2026 (ended Sep 30, 2026)
- Q3 2026 earnings press release (8-K Exhibit 99.1, Oct 14, 2026)
09Both sides
What do supporters and critics point to?
What supporters point to
- Net income to common stockholders rose from $25.3 billion in FY2024 to $29.1 billion in FY2025.
- Net interest income grew 8.7% in 9M FY2026 from a year earlier.
- The efficiency ratio fell from 64.07% in FY2023 to 61.65% in FY2025, both on the restated basis.
- Net charge-offs fell from 0.57% of average loans in FY2024 to 0.50% in FY2025 and 0.44% in Q3 FY2026.
- Wealth client balances grew from $4.8 trillion at the end of 2025 to about $5.1 trillion at Sep 30, 2026.
What critics point to
- The CET1 ratio fell from 11.9% at the end of FY2024 to 10.9% at Sep 30, 2026, against a 10.0% minimum.
- The bank recorded a $1.2 billion charge for anti-money-laundering and sanctions penalties in Q3 FY2026.
- Noninterest-bearing deposits fell from $811.6 billion at the end of FY2021 to $532.1 billion at the end of FY2025.
- In Q3 FY2026 noninterest expense rose 13.8%, or 6.8% without the charge, while revenue rose 3.2%.
- Return on average common equity was 10.59% in FY2025, against 12.23% in FY2021.
10What to watch next
What should you watch next at Bank of America?
Next event
Q4 FY2026 results
Date not announced yet.
Full-year net interest income
Management said on Oct 14, 2026 that it expects about 8% growth for 2026; growth was 8.7% in the first nine months.
CET1 capital
It was 10.9% at Sep 30, 2026; the G-SIB surcharge rises 0.5 point on Jan 1, 2027, according to the 10-K.
Consent order work
The 10-Qs report progress on the remedial work the OCC and FinCEN orders require.
11Key dates
What are the key dates for Bank of America?
| Event | Date | Source |
|---|---|---|
| Quarterly dividend of $0.32 a share payableDeclared Oct 21, 2026. | Form 10-Q, third quarter 2026 (ended Sep 30, 2026) | |
| G-SIB capital surcharge rises by 0.5 percentage pointG-SIB means global systemically important bank; the surcharge adds to the minimum capital ratios. | Form 10-K, fiscal year 2025 (ended Dec 31, 2025) |
12Key facts
Key facts about Bank of America
- What does Bank of America do?
- Bank of America is a US bank holding company that takes deposits, lends to people and companies, manages investments through Merrill and the Private Bank, and trades for institutional investors; it had $3.4 trillion of assets at the end of FY2025.
- How does Bank of America make money?
- Bank of America earned $60,096 million of net interest income (interest earned minus interest paid) and $53,001 million of fees, trading and other noninterest income in FY2025, so 53.1% of its $113,097 million revenue came from net interest income.
- Is Bank of America profitable?
- Bank of America reported net income of $30.5 billion in FY2025, up from $27.0 billion in FY2024; net income for common stockholders was $29.1 billion, or $3.81 a diluted share.
- What is Bank of America's revenue by segment?
- In FY2025 Bank of America's Consumer Banking segment had revenue of $43,673 million, Global Wealth & Investment Management $24,883 million, Global Banking $24,108 million and Global Markets $24,096 million, on a fully taxable-equivalent basis; All Other was −$3,054 million.
- Which part of Bank of America earns the most profit?
- Of Bank of America's FY2025 segment net income, Consumer Banking earned $12.2 billion, Global Banking $7.8 billion, Global Markets $6.1 billion and Global Wealth & Investment Management $4.7 billion, with a $0.3 billion loss in All Other.
- What is Bank of America's consumer bank?
- Bank of America's Consumer Banking segment offers checking and savings accounts, cards, mortgages and loans to about 69 million consumer and small business clients through about 3,600 financial centers and 15,000 ATMs (Dec 31, 2025); it earned $12,245 million of net income in FY2025.
- What is Merrill at Bank of America?
- Merrill Wealth Management and Bank of America Private Bank form Bank of America's Global Wealth & Investment Management segment, which had $4.8 trillion of client balances at the end of 2025 and revenue of $24,883 million in FY2025.
- What do Bank of America's Global Banking and Global Markets segments do?
- Bank of America's Global Banking segment lends to companies and runs investment banking ($24,108 million revenue in FY2025); Global Markets trades bonds, stocks, currencies and commodities for institutional investors ($24,096 million revenue in FY2025).
- Who owns Bank of America?
- Berkshire Hathaway reported owning 7.8% of Bank of America's common stock as of Sep 30, 2025; Vanguard Capital Management reported 6.59% as of Mar 31, 2026, and BlackRock 6.9% in a January 2024 filing. Directors and executive officers owned about 0.13% at Mar 13, 2026.
- What is Bank of America's CET1 capital ratio?
- Bank of America's CET1 capital ratio (standardized approach) was 11.4% at the end of FY2025 and 10.9% at Sep 30, 2026; the regulatory minimum was 10.0% at both dates.
Sources (5)
- Form 10-K, fiscal year 2025 (ended Dec 31, 2025)
- Schedule 13G/A on Bank of America common stock filed by Warren E. Buffett and Berkshire Hathaway Inc. (event date Sep 30, 2025)
- Schedule 13G on Bank of America common stock filed by Vanguard Capital Management (event date Mar 31, 2026)
- 2026 proxy statement (DEF 14A)
- Form 10-Q, third quarter 2026 (ended Sep 30, 2026)
Terms on this page
- Allowance for credit losses
- CET1 ratio
- Earnings per share (EPS)
- Efficiency ratio
- Market cap
- Net charge-offs
- Net interest income and margin
- P/E ratio
- Stock buyback
Each explains the term in plain English, with the same number from other companies on Cityfort.
Go deeper
More detail from the same filings. Open any section.
13What it sells
13What it sells
What does Bank of America sell?
Consumer banking
Checking and savings accounts, credit and debit cards, mortgages, home equity and car loans for people and small businesses in the US.
Wealth management (Merrill and the Private Bank)
Financial advisors who manage investments, brokerage and retirement accounts for clients with over $250,000 to invest, paid mostly through fees.
Banking for companies
Loans, cash management and trade finance for businesses, plus investment banking: advising on deals and selling companies' new stocks and bonds.
Markets
Buying and selling bonds, stocks, currencies and commodities for pension funds, asset managers and other institutional investors.
Think of it like this
Like a shop that buys money from savers and rents it out to borrowers at a higher price.
What it does
- Does: Takes deposits from people and businesses
- Does: Lends through mortgages, cards, car loans and business loans
- Does: Manages investments for wealthier clients through Merrill
- Does: Advises companies on deals and sells their new stocks and bonds
- Does: Trades securities for institutional investors
What it does not do
- Does not: Lend out all its deposits: loans were $1.19 trillion and deposits $2.02 trillion at the end of FY2025
- Does not: Pay interest on every deposit: 26.4% of deposits paid none at the end of FY2025
- Does not: Own the $4.8 trillion of wealth client balances: that money belongs to clients
14How the money flows
14How the money flows · FY2025
How does money flow through Bank of America?
Money in
- Interest earned on loans, securities and other assets$138.6B
- Fees, trading and other noninterest income$53.0B
The company
Bank of America
$191.6B came in
Money out
- Interest paid to depositors and lenders$78.5B
- Employees$42.3B
- Technology, buildings, marketing and other costs$27.4B
- Provision for credit losses$5.7B
- Income tax$7.2B
- Net income (including $1,454 million of preferred dividends)$30.5B
- People and businesses kept $2.02 trillion of deposits with the bank at the end of FY2025.
- It lends and invests that money, earning $138.6 billion of interest in FY2025.
- It paid $78.5 billion of interest to depositors and lenders, leaving $60.1 billion of net interest income.
- Fees from wealth management, deals, trading, cards and accounts added $53.0 billion.
- After staff, other costs, credit losses and tax, $30.5 billion was net income, $29.1 billion of it for common stockholders.
15Where growth could come from
15Where growth could come from
Where could Bank of America's growth come from?
Management said on the Q3 FY2026 earnings call (Oct 14, 2026) that it still expects 2026 net interest income growth of approximately 8%, and 2027 net interest income "8% or more higher than 2026".
Net interest income
Working+8.7% in 9M FY2026
Net interest income was $48,191 million in 9M FY2026, against $44,346 million in 9M FY2025.
Status: Working, on track against what the company said.
Wealth management
Working$21.1B → $24.9B revenue, FY2023 to FY2025
Client balances reached about $5.1 trillion at Sep 30, 2026; Q3 FY2026 segment revenue was $7,118 million, up from $6,312 million.
Status: Working, on track against what the company said.
Loan growth
Working$1,185.7B → $1,251.3B, Dec 2025 to Sep 2026
Total loans and leases rose 5.5% in the first nine months of 2026.
Status: Working, on track against what the company said.
Trading and investment banking
MixedQ3 FY2026 sales and trading $5.1B, −5%
Global Markets revenue rose from $19.5 billion in FY2023 to $24.1 billion in FY2025, but investment banking fees, excluding self-led deals, fell 11% to $1.8 billion in Q3 FY2026.
Status: Mixed, partly on track.
Status compares progress with what the company itself said it would do: Working = on track against what the company said; Mixed = partly on track; Behind = behind the company's own plan; New = recently announced; Early = too early to judge.
16The company's own measures (non-GAAP)
16The company's own measures · FY2025 and Q3 FY2026
What do Bank of America's own measures show?
Official (GAAP): Return on average common equity, FY2025
10.6%
Company's own measure: Return on average tangible common equity, FY2025
14.2%
Leaves goodwill and other intangible assets out of common equity, as Bank of America defines it.
Official (GAAP): Net interest income, FY2025
$60.1B
Company's own measure: Net interest income, fully taxable-equivalent basis, FY2025
$60.7B
Adds back the tax benefit on tax-exempt interest so it compares with taxable income; Bank of America's net interest yield and segment figures use this basis.
Official (GAAP): Noninterest expense, Q3 FY2026
$19.7B
Company's own measure: Adjusted noninterest expense, Q3 FY2026
$18.5B
Leaves out the $1.2 billion regulatory settlement charge.
Official (GAAP): Net income, Q3 FY2026
$6.9B
Company's own measure: Adjusted net income, Q3 FY2026
$8.1B
Leaves out the $1.2 billion regulatory settlement charge, which was not tax-deductible.
Official (GAAP): Diluted EPS, Q3 FY2026
$0.91
Company's own measure: Adjusted diluted EPS, Q3 FY2026
$1.08
The same exclusion as adjusted net income.
Official (GAAP): Book value per share, Sep 30, 2026
$39.26
Company's own measure: Tangible book value per share, Sep 30, 2026
$29.14
Common equity minus goodwill and other intangible assets, divided by shares outstanding.
These are the company's own measures, defined by the company. They are not comparable across companies, and they are not added together. Each sits beside the nearest official (GAAP) figure.
Learn: Non-GAAP measures: what a company's "adjusted" numbers leave out
17Financial strength: capital, loan losses, deposits
17Financial strength · FY2025
How strong is Bank of America's balance sheet?
- Loans made$1.18T
- Deposits taken$2.02T
- of which pay no interest$532.1B
Loans were 58.6% of deposits at the end of FY2025 (Cityfort calculation from the reported totals: loans ÷ deposits).
Noninterest-bearing deposits, such as many checking accounts, were 26.4% of deposits (Cityfort calculation: noninterest-bearing deposits ÷ total deposits).
- CET1 capital ratio
- 11.4%
- common equity capital as a share of risk-weighted assets (standardized approach); regulators set a minimum
- Allowance for credit losses
- $13.2B
- money set aside for expected loan losses: 1.12% of loans
- Net charge-offs
- $5.6B
- loans written off, minus recoveries: 0.5% of average loans
- Efficiency ratio
- 61.65%
- $ of noninterest expense per $100 of revenue (net interest income + noninterest income)
- Return on assets
- 0.89%
- net income as % of average total assets
- Return on equity
- 10.59%
- net income as % of average common equity
- Return on tangible common equity
- 14.22%
- the company's own measure (non-GAAP): equity without goodwill and other intangibles
Figures at the end of FY2025, consolidated, as reported by the company in its 10-K and earnings release; see the dates on each source.
Learn: What are net charge-offs? Loans written off, with real US companies · What is the allowance for credit losses? Loss reserves at US banks · What is the CET1 ratio? A bank's core capital, with real US companies · What is a bank efficiency ratio? Costs vs revenue, with real US banks · How to read a 10-K in 10 minutes
18Who owns it
18Who owns it · ownership as of Mar 13, 2026
Who owns Bank of America?
- Officers and directors (as a group), shares
- 0.1%
Share classes
Holders of 5% or more
From the company's proxy statement (DEF 14A), later Schedule 13G filings and the share counts on its latest annual or quarterly report. Each holder row shows the date of its own filing.
Insider trades · Form 4 data as of Nov 6, 2026
What did Bank of America's insiders report trading?
Bank of America's insiders made 81 Form 4A filing an insider must make within two business days of buying or selling the company's shares. Learn more filings in the 12 months to Nov 6, 2026.
They reported no purchases and 7 sales (619,146 shares) in the open market or privately (codes P and S).
None of the sales were on forms with the Rule 10b5-1 plan box checked.
The same filings report 258 other share transactions (M: 115, F: 86, D: 32, G: 16, A: 6, J: 2, W: 1).
They also report 186 transactions in options, stock units or other derivatives.
Insiders are a company's officers, directors and owners of more than 10% of a class of its shares. Most changes in their holdings must be reported to the SEC on a Form 4 within two business days. Source: SEC Form 4 filings on EDGAR.
- P
- a purchase in the open market or privately
- S
- a sale in the open market or privately
- A
- a grant, award or other acquisition from the company under Rule 16b-3
- D
- shares handed back to the company under Rule 16b-3
- F
- shares withheld or handed over to pay an exercise price or tax when an award is received, exercised or vests
- M
- exercise or conversion of an option or other derivative, exempt under Rule 16b-3
- G
- a bona fide gift
- W
- an acquisition or disposition by will or the laws of descent and distribution
- J
- another acquisition or disposition, described in a footnote
Code meanings: General Instruction 8 of Form 4 (SEC).
The latest 25 of 265 transactions
Shares: A = acquired, D = disposed of. A price the filing gives only in a footnote shows as “See filing”. The 10b5-1 box is checked when at least one trade on the form was made under a Rule 10b5-1 plan. A Form 4/A replaces the form it amends. See all of Bank of America's Form 4 filings on EDGAR.
Learn: How to read a proxy statement (DEF 14A): Nvidia's 2026 proxy · Form 4 insider filings: who files, the codes and the footnotes · Rule 10b5-1 trading plans: how insiders pre-schedule their trades
Sources (6)
- Form 10-Q, third quarter 2026 (ended Sep 30, 2026)
- 2026 proxy statement (DEF 14A)
- Schedule 13G/A on Bank of America common stock filed by Warren E. Buffett and Berkshire Hathaway Inc. (event date Sep 30, 2025)
- Schedule 13G on Bank of America common stock filed by Vanguard Capital Management (event date Mar 31, 2026)
- Schedule 13G/A on Bank of America common stock filed by The Vanguard Group, reporting 0 shares (event date Mar 13, 2026)
- Schedule 13G/A on Bank of America common stock filed by The Vanguard Group (Jan 30, 2026)
19What it does with profit
19What it does with profit
What does Bank of America do with its profit?
Dividend per share
$1.08FY2025
Dividend paid for each share, by financial year.
$ per share
See the numbers
Buyback · Sep 30, 2026
Q3 FY2026: about 97 million shares, under the $40 billion program that took effect on Aug 1, 2025.
$6.0B
Buyback · Dec 31, 2025
FY2025 common stock repurchased.
$21.4B
Buyback · Dec 31, 2024
FY2024 common stock repurchased.
$13.1B
Buyback · Dec 31, 2023
FY2023 common stock repurchased.
$4.6B
Buyback · Dec 31, 2022
FY2022 common stock repurchased.
$5.1B
Buyback · Dec 31, 2021
FY2021 common stock repurchased.
$25.1B
Money raised · Oct 23, 2026
Issued 80,000 shares of Series WW preferred stock.
20Governance signals
20Governance signals
What do Bank of America's governance filings show?
- Auditor
- PricewaterhouseCoopers LLP, since 1958
- Auditor changes
- None in the period covered
- Audit qualifications
- None reported
- Related-party dealings
- The 2026 proxy says loans to directors and executive officers were made on the same terms as for other customers. A director's brother and a former executive officer's son work at the bank, paid about $560,000 and $230,000 in 2025. Its subsidiaries also serve Berkshire Hathaway, BlackRock and Vanguard on arm's-length terms, the proxy states.
- Credit rating
- Moody's, S&P and Fitch (as stated in the FY2025 10-K and the Q3 FY2026 10-Q) A1 (Moody's) / A- (S&P) / AA- (Fitch), holding company senior debt (Stable (all three)), Oct 30, 2026
A credit rating describes the company's ability to repay debt. It is not a rating of the share.
Flags to know about
regulatory · Oct 13, 2026
Anti-money-laundering and sanctions consent orders
On Oct 13, 2026, the OCC, FinCEN and OFAC announced resolutions on certain aspects of the bank's Bank Secrecy Act, anti-money-laundering and economic sanctions compliance programs: consent orders with the OCC and FinCEN and a settlement agreement with OFAC. Bank of America recorded a $1.2 billion non-tax-deductible charge in Q3 FY2026 for the civil money penalties. FinCEN's order and a December 2024 OCC consent order require remedial work, including independent consultants.
regulatory
Earlier government orders
The FY2025 10-K says Bank of America has entered into orders or settlements with government agencies in recent years over rates paid on uninvested brokerage cash, credit card sales practices, representment fees and its role in COVID-19 relief programs, including unemployment benefit processing.
other · Oct 30, 2026
Possible legal losses above accruals
The Q3 FY2026 10-Q estimates the range of reasonably possible loss on disclosed legal matters at $0 to $200 million above amounts already accrued, as of Sep 30, 2026.
other · Oct 21, 2026
Board enlarged to 14
On Oct 21, 2026, the board grew from 12 to 14 directors, adding James Fitterling, Executive Chairman of Dow, and William Thomas, former Global Chairman and CEO of KPMG International.
Sources (5)
21What the market paid
21What the market paid · price as of Nov 5, 2026
What did the market pay for Bank of America on Nov 5, 2026?
Price as of Nov 5, 2026 (shown for education; prices change daily).
Price as of Nov 5, 2026: Bank of America's common stock closed at $49.76, from Nasdaq's historical price table for BAC; the shares are listed on the NYSE. Market value of about $343.4 billion (Cityfort calculation from the Nov 5, 2026 closing price and the Q3 FY2026 10-Q) = $49.76 × 6,900.2 million shares on Oct 29, 2026. P/E is price ÷ earnings per share: 11.8 on diluted EPS of $4.21 for the four quarters to Sep 30, 2026 (Cityfort calculation from the Q4 FY2025 and Q3 FY2026 earnings release supplements). P/B is price ÷ book value per share: 1.27 on $39.26 at Sep 30, 2026 (Cityfort calculation from the Q3 FY2026 earnings release supplement). Dividend yield is 2.57%: $0.32 × 4 = $1.28 a year ÷ the price.
- Share price
- $49.76
- Market value (market cap)
- $343.4B
- P/E
- 11.8×
- P/B
- 1.3×
More price-based ratios · as of Nov 5, 2026
Each ratio divides a number from the company's filings by the market value or share price on Nov 5, 2026. Prices change daily, so these ratios do too.
Price to sales (P/S)
2.9×
$343.4B market value ÷ $120.2B revenue (four quarters to Sep 30, 2026) = 2.9×
Cityfort calculation from the Nov 5, 2026 closing price and the Q4 FY2025 to Q3 FY2026 10-Ks and 10-Qs and earnings releases. Source: BAC historical closing prices, Oct 20 to Nov 5, 2026 (Nasdaq.com historical table; BAC is listed on the NYSE); Form 10-Q, third quarter 2026 (ended Sep 30, 2026); Q4 2025 Supplemental Information (8-K Exhibit 99.3, Jan 14, 2026) and 3 more
How price ratios work
Shares used for the market value: 6,900.21 million ($49.76 × 6,900.21 million shares ≈ $343.4B). Source: Form 10-Q, third quarter 2026 (ended Sep 30, 2026); 2026 proxy statement (DEF 14A)
Source: BAC historical closing prices, Oct 20 to Nov 5, 2026 (Nasdaq.com historical table; BAC is listed on the NYSE); Form 10-Q, third quarter 2026 (ended Sep 30, 2026); Q4 2025 Supplemental Information (8-K Exhibit 99.3, Jan 14, 2026) and 2 more
Sources (7)
- BAC historical closing prices, Oct 20 to Nov 5, 2026 (Nasdaq.com historical table; BAC is listed on the NYSE)
- Form 10-Q, third quarter 2026 (ended Sep 30, 2026)
- Q4 2025 Supplemental Information (8-K Exhibit 99.3, Jan 14, 2026)
- Q3 2026 Supplemental Information (8-K Exhibit 99.3, Oct 14, 2026)
- Form 8-K, Item 8.01: quarterly common dividend raised to $0.32 (filed Jul 24, 2026)
- Form 10-K, fiscal year 2025 (ended Dec 31, 2025)
- 2026 proxy statement (DEF 14A)
22How it got here
22How it got here
How did Bank of America get here?
2010
Milestone
Moynihan becomes CEO
Brian Moynihan became CEO in January 2010 and Chair in October 2014.
2021
Milestone
Reserves released
The provision for credit losses was a $4.6 billion release in FY2021, adding to profit; net income to common reached $30.6 billion.
2024
Milestone
Interest costs peak
Interest expense reached $90.5 billion in FY2024, up from $4.7 billion in FY2021, while noninterest-bearing deposits fell from $811.6 billion to $523.9 billion.
2024
Crisis
OCC consent order
Bank of America, N.A. agreed to a consent order that the OCC announced on Dec 23, 2024, relating to certain aspects of its anti-money-laundering and sanctions compliance programs.
2025
Milestone
Bank subsidiary rating cut
Moody's lowered Bank of America, N.A.'s senior debt rating to Aa2 from Aa1 on May 19, 2025, after downgrading the US government.
2025
Milestone
Two Co-Presidents and a $40 billion buyback
A $40 billion repurchase program took effect on Aug 1, 2025; Dean Athanasia and James DeMare were announced as Co-Presidents on Sep 12, 2025.
2025
Milestone
Accounting change
In Q4 2025 the bank changed how it accounts for tax-credit investments such as affordable housing and wind and solar projects, restating FY2023 and FY2024.
2026
Crisis
$1.2 billion in penalties
The OCC, FinCEN and OFAC announced resolutions on Oct 13, 2026; the bank recorded a $1.2 billion charge for civil money penalties in Q3 FY2026.
23Sources and changes
Where every number on this page comes from
Sources (23 documents)
- S1Form 10-K, fiscal year 2025 (ended Dec 31, 2025) · Bank of America Corporation (SEC EDGAR) · Tier 1: company or exchange filing · Feb 25, 2026
- S2Form 10-K, fiscal year 2024 (ended Dec 31, 2024), as originally reported · Bank of America Corporation (SEC EDGAR) · Tier 1: company or exchange filing · Feb 25, 2025
- S3Form 10-K, fiscal year 2023 (ended Dec 31, 2023) · Bank of America Corporation (SEC EDGAR) · Tier 1: company or exchange filing · Feb 20, 2024
- S4Form 10-K, fiscal year 2022 (ended Dec 31, 2022) · Bank of America Corporation (SEC EDGAR) · Tier 1: company or exchange filing · Feb 22, 2023
- S5Form 10-Q, third quarter 2026 (ended Sep 30, 2026) · Bank of America Corporation (SEC EDGAR) · Tier 1: company or exchange filing · Oct 30, 2026
- S7Q3 2026 earnings press release (8-K Exhibit 99.1, Oct 14, 2026) · Bank of America Corporation (SEC EDGAR) · Tier 1: company or exchange filing · Oct 14, 2026
- S8Q3 2026 Supplemental Information (8-K Exhibit 99.3, Oct 14, 2026) · Bank of America Corporation (SEC EDGAR) · Tier 1: company or exchange filing · Oct 14, 2026
- S10Q4 2025 Supplemental Information (8-K Exhibit 99.3, Jan 14, 2026) · Bank of America Corporation (SEC EDGAR) · Tier 1: company or exchange filing · Jan 14, 2026
- S112026 proxy statement (DEF 14A) · Bank of America Corporation (SEC EDGAR) · Tier 1: company or exchange filing · Mar 23, 2026
- S12Schedule 13G/A on Bank of America common stock filed by Warren E. Buffett and Berkshire Hathaway Inc. (event date Sep 30, 2025) · Berkshire Hathaway Inc. (SEC EDGAR) · Tier 1: company or exchange filing · Nov 14, 2025
- S13Schedule 13G/A on Bank of America common stock filed by The Vanguard Group (Jan 30, 2026) · The Vanguard Group (SEC EDGAR) · Tier 1: company or exchange filing · Jan 30, 2026
- S14Schedule 13G/A on Bank of America common stock filed by The Vanguard Group, reporting 0 shares (event date Mar 13, 2026) · The Vanguard Group (SEC EDGAR) · Tier 1: company or exchange filing · Mar 26, 2026
- S15Schedule 13G on Bank of America common stock filed by Vanguard Capital Management (event date Mar 31, 2026) · Vanguard Capital Management (SEC EDGAR) · Tier 1: company or exchange filing · Apr 29, 2026
- S16Form 8-K, Item 8.01: quarterly common dividend raised to $0.32 (filed Jul 24, 2026) · Bank of America Corporation (SEC EDGAR) · Tier 1: company or exchange filing · Jul 24, 2026
- S17Form 8-K, Item 5.02: board enlarged to 14, James Fitterling and William Thomas appointed (filed Oct 21, 2026) · Bank of America Corporation (SEC EDGAR) · Tier 1: company or exchange filing · Oct 21, 2026
- S18Form 8-K, Item 5.02: executive officer designations, Co-Presidents Athanasia and DeMare (filed Nov 26, 2025) · Bank of America Corporation (SEC EDGAR) · Tier 1: company or exchange filing · Nov 26, 2025
- S19Form 8-K, Item 8.01: CEO 2025 total compensation of $41 million (filed Feb 13, 2026) · Bank of America Corporation (SEC EDGAR) · Tier 1: company or exchange filing · Feb 13, 2026
- S20Form 8-K, Items 3.03/5.03/8.01: Series WW preferred stock issued (filed Oct 23, 2026) · Bank of America Corporation (SEC EDGAR) · Tier 1: company or exchange filing · Oct 23, 2026
- S21Q3 2026 earnings call transcript (Oct 14, 2026) · Bank of America Corporation (investor relations) · Tier 1: company or exchange filing · Oct 14, 2026
- S22Q2 2026 earnings call transcript (Jul 14, 2026) · Bank of America Corporation (investor relations) · Tier 1: company or exchange filing · Jul 14, 2026
- S23Q1 2026 earnings call transcript (Apr 15, 2026) · Bank of America Corporation (investor relations) · Tier 1: company or exchange filing · Apr 15, 2026
- S24BAC historical closing prices, Oct 20 to Nov 5, 2026 (Nasdaq.com historical table; BAC is listed on the NYSE) · Nasdaq, Inc. · Tier 1: company or exchange filing · Nov 5, 2026
- S25EDGAR filing list for Bank of America Corp (CIK 0000070858) · U.S. Securities and Exchange Commission · Tier 1: company or exchange filing · Nov 6, 2026
Changes to this page (v1 · Nov 6, 2026)
- v1 · Nov 6, 2026First version, through Q3 FY2026 (quarter ended Sep 30, 2026). (first version)
Numbers come only from tier 1 and tier 2 sources. Read how we research.
Disclaimer
For learning only. Cityfort is not a registered investment adviser or broker-dealer and does not recommend buying or selling any security. Prices shown are dated and may be out of date.
Investing in securities involves risk, including loss of capital. Before making any investment decision, do your own research and consider consulting a registered investment adviser or other qualified professional.
Cityfort, its owners and contributors may or may not hold securities of companies covered. Cityfort is not paid by any company it covers. Content is not an offer or solicitation to buy or sell any security, including in any initial public offering.
Read the positions policyRead the full disclaimerHide the full disclaimer
Cityfort publishes general educational content that explains how listed companies work. Cityfort is not registered with the US Securities and Exchange Commission or any state securities regulator as an investment adviser, and is not a broker-dealer or a member of FINRA. Cityfort does not provide investment, tax or legal advice, recommendations, ratings, price targets or any opinion on whether to buy, sell or hold any security. Nothing on the site is tailored to any person's circumstances.
All information is taken from publicly available sources, mainly company filings with the SEC, which are listed on each page with dates. We work to keep it accurate and correct errors publicly, but we do not guarantee that it is complete, accurate or up to date. Any market price or price-based ratio shown is dated, may be out of date by the time you read it, and is included only to explain concepts.
Statements by company management, including forward-looking statements and guidance, are reported as the company's statements, with their date and source; they are not our forecasts. Adjusted (non-GAAP) figures are the company's own measures and are shown next to the official (GAAP) figures.