Financials · NYSE: MCO
Moody's: how the business works
Moody's grades how likely borrowers are to repay their debts and sells risk data and software, with $7.72 billion of revenue in FY2025.
By Hardik Bhandare · Checked against filings: . Editorial policy. Corrections
Follow Moody's
Email me when Moody's's page is updated after earnings.
We'll send a confirmation email first. See our privacy policy.
Moody's Corporation · New York, New York
Updated for Q3 FY2026 · checked
- Revenue, FY2025
- $7,718M
- Net income, FY2025
- $2,459M
- MA recurring revenue (ARR), Sep 30, 2026
- $3.69B
- Employees
- About 16,000
The short version
Moody's in 5 points
1 · What it sells
Moody's rates the debt of companies, banks and governments through Moody's Investors Service and sells data, research and risk software through Moody's Analytics, with FY2025 revenue of $7,718 million.
2 · Who pays it
Borrowers paying for ratings brought in 53.4% of Moody's FY2025 revenue from outside customers, and customers of Moody's Analytics data, research and software 46.6% (Cityfort calculation from the FY2025 10-K).
3 · What it keeps from $100
Of every $100 of FY2025 revenue, Moody's kept $31.9 as net income, including a $23 million gain on selling a business, and $43.4 as operating income (Cityfort calculation from the FY2025 10-K).
4 · Where the operating profit comes from
Moody's Investors Service made $2.75 billion of FY2025 adjusted operating income (a company measure), at a 63.6% margin, and Moody's Analytics made $1.20 billion, at 33.1%.
5 · The one thing to watch
MIS revenue from outside customers fell from $1.26 billion in Q2 FY2026 to $1.09 billion in Q3 FY2026, while MA's annualized recurring revenue reached $3.69 billion at Sep 30, 2026, up 8% on the company's organic constant-currency basis.
Sources: From Moody's FY2025 10-K and its Q2 and Q3 FY2026 earnings releases · checked
01Where the money goes · FY2025
Where does $100 of Moody's' money go?
Moody's · FY2025
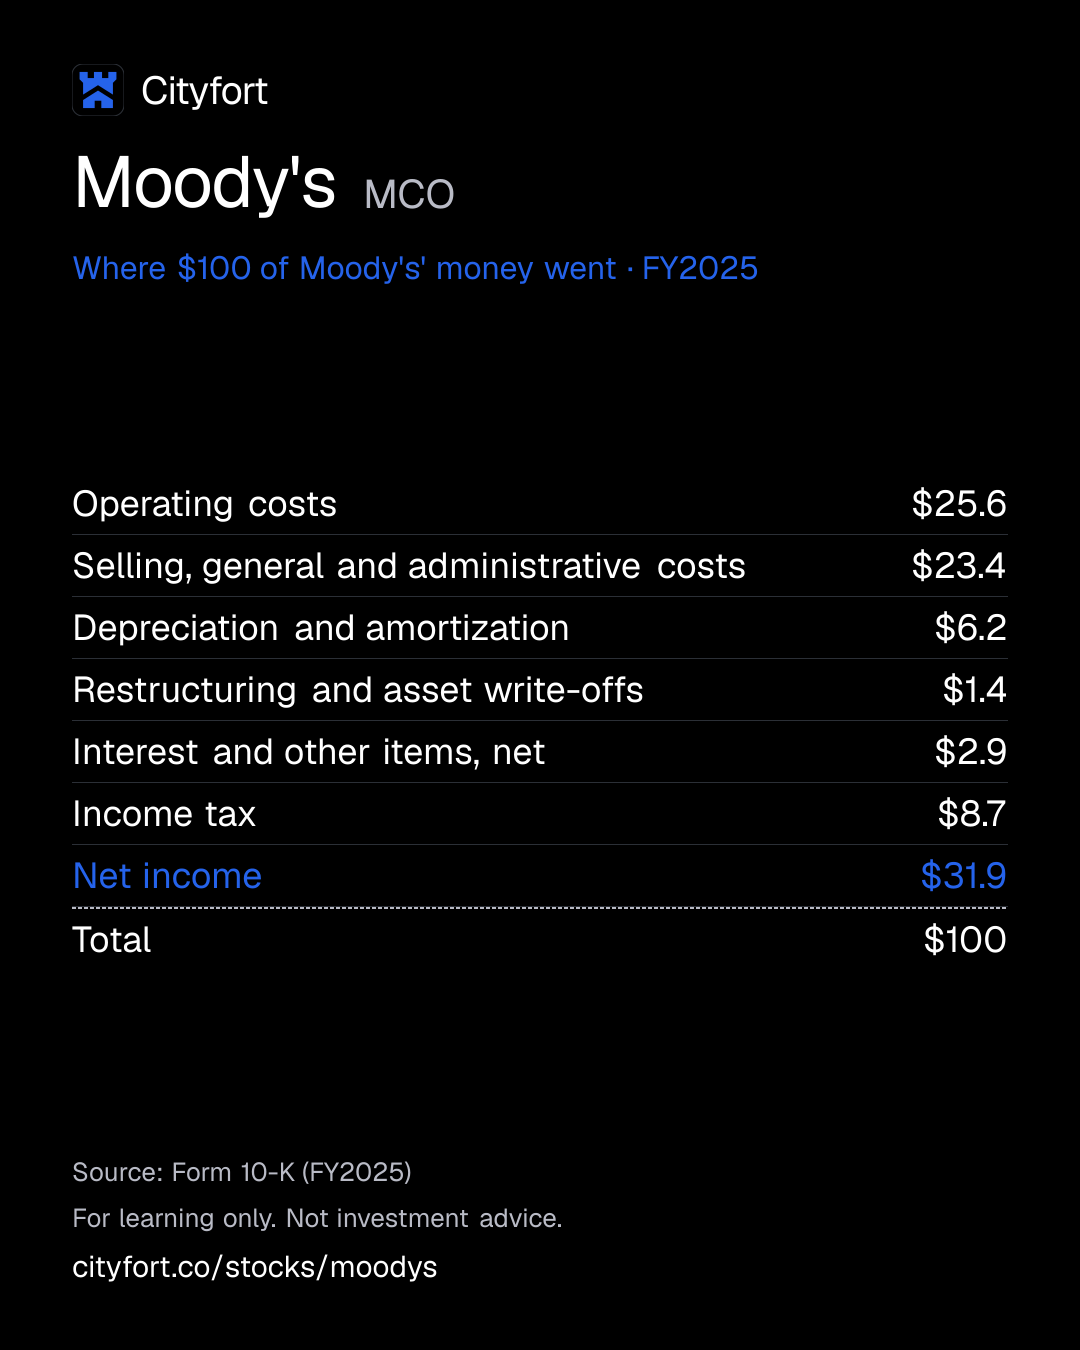
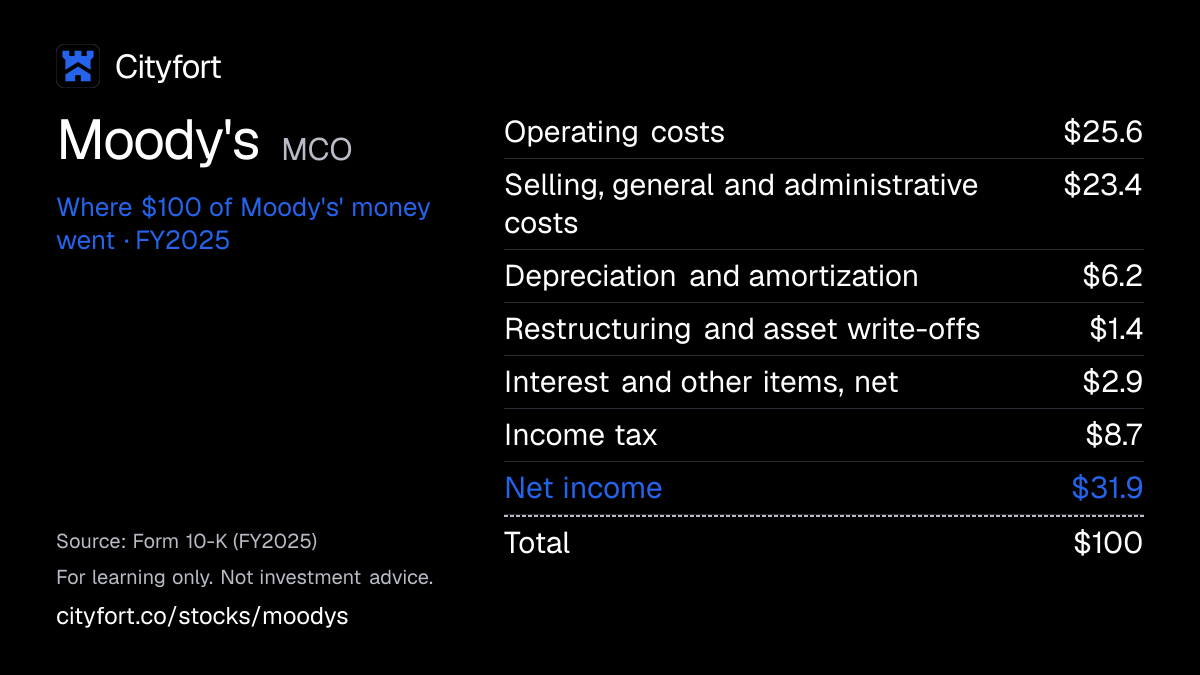
Receipt for every $100
| Operating costs | $25.6 |
|---|---|
| Selling, general and administrative costs | $23.4 |
| Depreciation and amortization | $6.2 |
| Restructuring and asset write-offs | $1.4 |
| Interest and other items, net | $2.9 |
| Income tax | $8.7 |
| Net income | $31.9 |
| Total | $100 |
Each line = amount ÷ total money in × 100. Lines may not add to exactly $100 because of rounding.
How this is worked out
Cityfort calculation from the FY2025 10-K: each line ÷ $7.72 billion of revenue × 100. Interest and other items are net of a $23 million gain on selling a business; net income includes $3 million for minority holders.
Save this receipt as an image
Embed this receipt or the key numbers
Paste this code into a blog or website to show the card you choose, with a link back to this page.
Each week: the next company due to report earnings, explained in 5 points.
No tips. Unsubscribe anytime.
We'll send a confirmation email. See our privacy policy.
02The business in one line
What does Moody's do?
Borrowers pay Moody's to rate their debt, and businesses pay it for data and software. Most of the money goes to running costs, overheads and tax; the rest is profit.
- Ratings (MIS) brought in 53.4% of FY2025 revenue from outside customers and Moody's Analytics 46.6% (Cityfort calculation from the FY2025 10-K).
- Operating costs took $25.56 and selling, general and administrative costs $23.36 of every $100 in FY2025, and Moody's kept $31.9 as net income (Cityfort calculation from the FY2025 10-K).
03Who pays it
Who pays Moody's?
Companies that borrow (Corporate Finance)
27.6%
of revenue
Pay MIS to rate bonds, loans and commercial paper: $2.13 billion in FY2025, 73% of it from one-off ratings of new deals.
Banks, insurers and firms using MA software
21.9%
of revenue
Pay yearly for Decision Solutions tools for lending, underwriting and KYC checks: $1.69 billion in FY2025.
Subscribers to research and data
24.7%
of revenue
Investors, banks and companies paying for Research & Insights ($995 million) and Data & Information ($912 million) in FY2025.
Banks, insurers and fund managers (Financial Institutions)
9.8%
of revenue
Pay MIS to rate their own debt: $759 million in FY2025.
Governments and infrastructure projects
8.2%
of revenue
Public, Project and Infrastructure Finance ratings: $635 million in FY2025.
Structured finance
7.2%
of revenue
Ratings of bonds backed by pools of loans, such as mortgages: $558 million in FY2025.
- Companies that borrow (Corporate Finance)27.6%
- Banks, insurers and firms using MA software21.9%
- Subscribers to research and data24.7%
- Banks, insurers and fund managers (Financial Institutions)9.8%
- Governments and infrastructure projects8.2%
- Structured finance7.2%
How spread out the customers are
The FY2025 10-K gives no revenue share for any single customer. It says no customer made up 10% or more of accounts receivable at Dec 31, 2025 or 2024.
Sources (1)
04How it makes money
How does Moody's make money?
Ratings earn nearly twice the margin of analytics, so the mix of new debt deals and subscriptions moves profit.
In FY2025 MIS had an adjusted operating margin of 63.6%, against 33.1% for MA, as the company reports them. MIS margins move with deal volume: 68.3% in Q2 FY2026 on $1.31 billion of revenue, 51.3% in Q4 FY2024 on $858 million. MA adds steadier income, 96% of it recurring in FY2025.
Operating income per $100 of revenue
$36.1$43.4
FY2023 to FY2025
- Companies, banks and governments borrow by issuing bonds and loans
- They pay MIS to rate the new debt, then yearly fees to monitor it
- Investors and lenders use the ratings and buy MA research and data
- Banks and insurers pay MA subscriptions for risk and KYC software
- Cash left over pays dividends and buys back shares
↺ Step 5 feeds back into step 1.
05Business segments · FY2025
Which businesses make up Moody's?
Moody's Investors Service
53.4%Credit ratings and rating-related research. Adjusted operating income, a company measure, was $2.75 billion in FY2025.
Revenue $4.1B ($4,119M)
Moody's Analytics
46.6%Data, research and risk software sold mostly by subscription. Adjusted operating income was $1.20 billion in FY2025. Segment figures here are revenue from outside customers.
Revenue $3.6B ($3,599M)
How the mix changed
- Moody's Investors Service
- Moody's Analytics
Revenue by segment, FY2023 to FY2025.
US$
See the numbers
Sources (1)
06The numbers · Consolidated · US$
How has Moody's done?
Revenue
$7.7BFY2025
Moody's revenue fell to $5.47 billion in FY2022, then grew each year to $7.72 billion in FY2025.
US$
See the numbers
Net income
$2.5BFY2025
Net income fell from $2.21 billion in FY2021 to $1.37 billion in FY2022, then rose to $2.46 billion in FY2025.
US$
See the numbers
Net income for every $100 of revenue
$31.9FY2025
Moody's kept $31.9 of every $100 of revenue as net income in FY2025, up from $25.1 in FY2022.
Net margin: $ of net income per $100 of revenue
See the numbers
Free cash flow
$2.6BFY2025
Free cash flow rose from $1.19 billion in FY2022 to $2.58 billion in FY2025.
US$ · cash from operations minus spending on plants and equipment
See the numbers
See all yearly numbers
EBITDA here = operating income plus depreciation and amortization (from the cash flow statement). Fiscal years are the company's own: Fiscal year ends Dec 31 (the calendar year). Net income is the share belonging to the company's owners.
Learn: Fiscal years that don't end in December: Nvidia's FY2027 explained · Stock-based compensation and dilution: pay that becomes shares
Sources (16)
- Form 10-K for FY2021
- Form 10-K for FY2022
- Form 10-K for FY2023
- Form 10-K for FY2024
- Form 10-K for FY2025
- Q4 FY2024 earnings release (8-K Ex. 99.1)
- Form 10-Q for Q1 FY2024
- Form 10-Q for Q2 FY2024
- Form 10-Q for Q3 FY2024
- Form 10-Q for Q1 FY2025
- Form 10-Q for Q2 FY2025
- Form 10-Q for Q3 FY2025
- Q4 FY2025 earnings release (8-K Ex. 99.1)
- Form 10-Q for Q1 FY2026
- Form 10-Q for Q2 FY2026
- Form 10-Q for Q3 FY2026
07Who runs it
Who runs Moody's, and did they deliver?
Robert Fauber
President and Chief Executive Officer · since 2021
CEO since Jan 2021 and a director since Oct 2020; earlier COO and President of MIS. His 2025 total pay was $18.08 million, 146 times the median employee, per the 2026 proxy.
Noémie Heuland
Chief Financial Officer · since 2024
CFO since April 2024; previously CFO of Ceridian (Dayforce) from Sep 2020 to Dec 2023.
Michael West
President, Moody's Investors Service · since 2019
Has led the ratings business since Nov 2019.
Richard Steele
General Counsel · since 2023
General Counsel since Sep 2023; at Moody's since 2006.
Vincent A. Forlenza
Independent Chairman of the Board · since 2023
Chairman since April 2023, earlier Lead Independent Director. Nine of the ten board nominees are independent.
What they said, and what happened
2 too early to tell
Said on Oct 21, 2026
The company said the cost program approved on Dec 19, 2024 would bring annualized savings of $300 million to $350 million once complete.
Too early to tellWhat happened
The program is still running; nine-month restructuring charges were $86 million in 2026.
Said on Apr 22, 2026
In its Q1 FY2026 earnings release, Moody's guided FY2026 adjusted diluted EPS of $16.40 to $17.00.
Too early to tellWhat happened
The range was narrowed to $16.50 to $17.00 in July 2026 and kept in October; nine-month adjusted EPS was $13.14.
08What could go wrong
What could go wrong for Moody's?
- Demand
Fewer new bond deals
In FY2025, 73% of Corporate Finance revenue came from rating new deals. MIS revenue from outside customers fell to $1.09 billion in Q3 FY2026 from $1.26 billion in Q2.
Watch MIS transaction revenue each quarter ($714 million in Q3 FY2026)
- Regulation
Rules for rating agencies
MIS is registered with the SEC and supervised by ESMA and the FCA. The FY2025 10-K says the EU ESG Ratings Regulation applies from July 2026 and the FCA will regulate ESG ratings.
Watch New rules, reviews or fines from the SEC, ESMA or FCA
- Legal
Lawsuits over ratings
The FY2025 10-K says Moody's faces claims and litigation based on ratings MIS assigned. It records a liability only when a loss is probable and can be estimated.
Watch New matters in the contingencies note of each 10-Q and 10-K
- Debt
Debt and buybacks
Debt was $6.91 billion at Sep 30, 2026, against $3.27 billion of Moody's shareholders' equity. Buybacks took about $2.6 billion in the first nine months of 2026.
Watch The $587 million of notes due 2027 and net interest expense ($178 million in nine months)
- Currency
Currency swings
46% of FY2025 revenue, $3.55 billion, came from outside the US. Moody's reports in dollars, so exchange rates move reported revenue.
Watch The currency effect the company reports in each earnings release
- Other
An international tax reserve
In 2026 Moody's booked a $36 million MA reserve for an international non-income tax obligation, plus accrued interest.
Watch Further charges for this reserve in later 10-Qs
09Supporters vs. critics
What do supporters and critics point to?
What supporters point to
- Moody's net income rose from $1,607 million in FY2023 to $2,459 million in FY2025, and its operating margin from 36.1% to 43.4%.
- 96% of Moody's Analytics revenue was recurring in FY2025, and its annualized recurring revenue was $3.69 billion at Sep 30, 2026, up 8% on the company's organic constant-currency basis.
- KYC revenue grew from $312 million in FY2023 to $438 million in FY2025.
- Free cash flow was $2,575 million in FY2025; that year Moody's paid $3.76 a share in dividends and spent $1.61 billion on buybacks.
What critics point to
- In FY2025, 73% of Corporate Finance revenue came from rating new deals. MIS revenue from outside customers fell from $1.26 billion in Q2 FY2026 to $1.09 billion in Q3.
- Debt was $6.91 billion at Sep 30, 2026, against $3.27 billion of Moody's shareholders' equity, after about $2.6 billion of buybacks in the first nine months of 2026.
- The FY2025 10-K says Moody's faces claims and litigation based on ratings MIS assigned; MIS is registered with the SEC and supervised by ESMA and the FCA.
- 46% of FY2025 revenue, $3.55 billion, came from outside the US, and Moody's reports in dollars.
10What to watch next
What should you watch next at Moody's?
Next event
Q4 FY2026 results
Date not announced yet.
Bond deals and ratings revenue
MIS revenue from outside customers was $1.09 billion in Q3 FY2026, down from $1.26 billion in Q2 FY2026. In FY2025, 73% of Corporate Finance revenue came from rating new deals.
Results against the company's range
In its Q3 FY2026 earnings release of Oct 21, 2026, Moody's kept its FY2026 adjusted diluted EPS guidance of $16.50 to $17.00. Adjusted EPS for the first nine months was $13.14.
The cost program
The Q3 FY2026 10-Q says the program should save $300 million to $350 million a year once complete. Restructuring charges were $86 million in the first nine months of 2026.
Debt and buybacks
Debt was $6.91 billion at Sep 30, 2026. About $1.4 billion of the $4.0 billion buyback authority approved on Oct 21, 2025 was left at that date.
11Key facts
Key facts about Moody's
- What does Moody's do?
- Moody's Corporation runs two businesses. Moody's Investors Service (MIS) rates the debt of companies, banks and governments, and Moody's Analytics (MA) sells data, research and risk software. Its FY2025 revenue was $7,718 million.
- How does Moody's make money?
- Moody's Corporation earns fees for rating new bonds and loans, yearly fees to monitor ratings, and subscriptions for data and software. In FY2025, 73% of its Corporate Finance ratings revenue came from rating new deals, and 96% of Moody's Analytics revenue was recurring.
- Who are Moody's customers?
- Moody's Corporation's largest payer group in FY2025 was companies that borrow, whose Corporate Finance ratings brought in $2.13 billion, 27.6% of revenue. Banks, insurers, investors and governments pay for the rest; the FY2025 10-K gives no revenue share for any single customer.
- How big is Moody's?
- Moody's Corporation had FY2025 revenue of $7,718 million and net income of $2,459 million, up from $7,088 million and $2,058 million in FY2024. It had about 16,000 employees.
- Where does Moody's earn its revenue?
- Moody's Corporation earned 54% of its FY2025 revenue in the United States, 30.8% in Europe, the Middle East and Africa, 9.1% in Asia-Pacific and 6.1% in the rest of the Americas.
- Who owns Moody's?
- Moody's Corporation has one class of common stock with one vote per share. Its 2026 proxy statementThe yearly filing about shareholder votes, the board and executive pay. Learn more lists Berkshire Hathaway at 13.9%, based on a Schedule 13GA filing by anyone who owns more than 5% of a company's shares and does not seek control. Learn more/A filed Feb 14, 2014, and directors and executive officers at about 0.06% (Cityfort calculation from the 2026 proxy statement and the FY2025 10-K).
- How much debt does Moody's have?
- Moody's Corporation had $6.91 billion of debt and $1,513 million of cash at Sep 30, 2026, against $3.27 billion of shareholders' equity, per its Q3 FY2026 10-Q.
- Does Moody's pay dividends?
- Moody's Corporation paid dividends of $3.76 per share for FY2025, up from $2.48 for FY2021. It also spent $1.61 billion buying back its own shares in FY2025.
Terms on this page
- Annual recurring revenue (ARR)
- Capital expenditures (capex)
- Debt-to-equity
- Earnings per share (EPS)
- EBITDA
- Free cash flow
- Net debt
- Net margin
- Operating margin
- Revenue vs net income
Each explains the term in plain English, with the same number from other companies on Cityfort.
Go deeper
More detail from the same filings. Open any section.
12What it sells
12What it sells
What does Moody's sell?
Credit ratings (MIS)
Grades on bonds, loans and the companies, banks and governments that issue them, plus fees to keep each rating up to date. Ratings brought in $4.08 billion in FY2025.
Decision Solutions (MA)
Cloud software for banking, insurance and KYC ("know your customer") checks, built on Moody's data. It earned $1.69 billion in FY2025.
Research & Insights (MA)
Bond-market and economic research sold by subscription. It earned $995 million in FY2025.
Data & Information (MA)
Databases on companies and credit, which the 10-K calls "the world's largest database on companies and credit". It earned $912 million in FY2025.
Think of it like this
An MIS rating works like a personal credit score, but for a bond or the organization that issued it.
What it does
- Does: Rates corporate, bank, government and structured-finance debt worldwide
- Does: Sells subscriptions to data, research and risk software
- Does: Owns 30% of CCXI, a domestic Chinese rating agency, and reports ICRA of India inside MIS
What it does not do
- Does not: Is not a lender: its revenue is rating fees and subscriptions, not interest on loans
- Does not: No longer sells training or regulatory reporting software: MA Learning Solutions was sold in 2025 and Regulatory Solutions in 2026
Sources (1)
13How the money flows
13How the money flows · FY2025
How does money flow through Moody's?
Money in
- Revenue$7.7B
The company
Moody's
$7.7B came in
Money out
- Operating costs (mostly staff who rate and build products)$2.0B
- Selling, general and administrative costs$1.8B
- Depreciation and amortization$480M
- Restructuring and asset write-offs$111M
- Interest and other items, net$221M
- Income tax$668M
- Net income (including $3 million for minority holders)$2.5B
- Borrowers pay MIS for ratings, and customers pay MA for subscriptions: $7.72 billion in FY2025.
- Operating and selling costs, mostly pay for staff, took $3.78 billion.
- Wear on assets, restructuring, interest and other items took $812 million more.
- Income tax was $668 million, leaving $2.46 billion of net income.
Sources (1)
14What it needs to run
14What it needs to run
What does Moody's need to run?
People
About 16,000 employees in more than 40 countries. Pay was the largest cost in both segments in FY2025: $1.44 billion in MA and $1.14 billion in MIS.
Regulatory registrations
MIS is registered with the SEC as a nationally recognized statistical rating organization (NRSRO). Its EU units are supervised by ESMA, its UK unit by the FCA, and its Australian unit holds a license.
Data and models
The 10-K describes "vast proprietary and curated data and validated analytical models" behind both ratings and MA products.
Busy debt markets
MIS earns most of its fees when borrowers issue new debt. In FY2025, 73% of Corporate Finance revenue came from such one-off deals.
Sources (1)
15Where it sells
15Where it sells · FY2025
Where does Moody's sell?
- United States54%
- Europe, Middle East and Africa30.8%
- Asia-Pacific9.1%
- Americas outside the US6.1%
Sources (1)
16Where growth could come from
16Where growth could come from
Where could Moody's' growth come from?
In its Q3 FY2026 earnings release of Oct 21, 2026, Moody's said it expects FY2026 revenue to grow in the high-single-digit percent range, diluted EPS of $16.00 to $16.50 and free cash flowCash from operations minus spending on buildings and equipment. Learn more of $2.7 to $2.9 billion. Each line was unchanged from its previous guidance.
Recurring analytics revenue
Working$3.69B ARR, +8%
MA's annualized recurring revenue (ARR), a company measure of yearly subscription value, was $3.69 billion at Sep 30, 2026. It rose 8% on the company's organic constant-currency basis.
Status: Working, on track against what the company said.
KYC checks software
WorkingKYC ARR +12%
KYC revenue grew from $312 million in FY2023 to $438 million in FY2025. KYC ARR reached $489 million at Sep 30, 2026, up 12%.
Status: Working, on track against what the company said.
Corporate bond issuance
MixedQ3 FY2026 revenue: IG +18%, HY −40%
The Q3 FY2026 release credits large technology financings, including AI-related issuance, for investment-grade growth. It says leveraged finance issuance was lower against a record prior-year quarter.
Status: Mixed, partly on track.
Cost program
Early$300M–$350M yearly savings
The Q3 FY2026 10-Q says the program approved on Dec 19, 2024 and widened in July 2026 should save $300 million to $350 million a year once complete.
Status: Early, too early to judge.
Status compares progress with what the company itself said it would do: Working = on track against what the company said; Mixed = partly on track; Behind = behind the company's own plan; New = recently announced; Early = too early to judge.
17The company's own measures (non-GAAP)
17The company's own measures · FY2025 and Q3 FY2026 (quarter ended Sep 30, 2026)
What do Moody's' own measures show?
Official (GAAP): Operating income, FY2025
$3.4B
Company's own measure: Adjusted operating income, FY2025
$3.9B
Adds back depreciation and amortization ($480 million), restructuring ($108 million) and asset write-offs ($3 million).
Official (GAAP): Operating margin, FY2025
43.4%
Company's own measure: Adjusted operating margin, FY2025
51.1%
Adjusted operating income as a share of revenue, as the 10-K reports it.
Official (GAAP): Diluted EPS, FY2025
$13.67
Company's own measure: Adjusted diluted EPS, FY2025
$14.94
Leaves out amortization of acquired intangible assets and restructuring, among other items. FY2024: adjusted $12.47, GAAP $11.26.
Official (GAAP): Diluted EPS, Q3 FY2026
$4.24
Company's own measure: Adjusted diluted EPS, Q3 FY2026
$4.14
GAAP EPS includes a $115 million pre-tax gain on selling MA Regulatory Solutions, which the adjusted figure leaves out.
Official (GAAP): MA revenue from outside customers, FY2025
$3.6B
Company's own measure: MA annualized recurring revenue (ARR), Dec 31, 2025
$3.5B
Yearly value of active renewable MA contracts at constant currency. It excludes one-off sales and contracts from deals of the last 12 months.
These are the company's own measures, defined by the company. They are not comparable across companies, and they are not added together. Each sits beside the nearest official (GAAP) figure.
Learn: Non-GAAP measures: what a company's "adjusted" numbers leave out
18Financial strength and debt
18Financial strength · Sep 30, 2026
How much debt does Moody's have?
- Total debt$6.9B
- Cash and investments$1.5B
- Net debt (debt minus cash)$5.4B
- Net worth (shareholders' money)$3.3B
- Debt to equity
- 2.11×
- $ of debt for every $1 of shareholders' money
- Net debt = long-term debt $6,343 million + current portion $568 million − cash $1,513 million (Cityfort calculation from the Q3 FY2026 10-Q). It leaves out $108 million of short-term investments.
- Moody's shareholders' equity was $3.27 billion at Sep 30, 2026, down from $4.05 billion at Dec 31, 2025. Shares bought back over the years had cost $14.98 billion by Dec 31, 2025.
- Senior notes had $7.17 billion of principal at Dec 31, 2025. None was due in 2026; $587 million is due in 2027 and $500 million in 2028.
- A $1.25 billion revolving credit line runs to May 2029 and backs a commercial paper program of up to $1.0 billion.
Sources (2)
19Who owns it
19Who owns it · ownership as of Feb 18, 2026
Who owns Moody's?
- Officers and directors (as a group), shares
- 0.1%
Share classes
Holders of 5% or more
From the company's proxy statement (DEF 14A), later Schedule 13G filings and the share counts on its latest annual or quarterly report. Each holder row shows the date of its own filing.
Learn: How to read a proxy statement (DEF 14A): Nvidia's 2026 proxy · Form 4 insider filings: who files, the codes and the footnotes
20What it does with profit
20What it does with profit
What does Moody's do with its profit?
Dividend per share
$3.76FY2025
Dividend paid for each share, by financial year.
$ per share
See the numbers
Buyback · Dec 31, 2023
FY2023: paid $490 million for its own shares.
$490M
Buyback · Dec 31, 2024
FY2024: paid $1.29 billion for its own shares.
$1.3B
Buyback · Dec 31, 2025
FY2025: paid $1.61 billion for its own shares.
$1.6B
Buyback · Sep 30, 2026
First nine months of 2026: about $2.6 billion of buybacks, per the Q3 FY2026 earnings release.
$2.6B
21Governance signals
21Governance signals
What do Moody's' governance filings show?
- Auditor
- KPMG LLP, since 2008
- Auditor changes
- None in the period covered
- Audit qualifications
- None reported
- Related-party dealings
- The 2026 proxy says the Audit Committee must review and approve deals over $120,000 in which a director, executive officer, 5% holder or their family has an interest, unless pre-approved by category.
- Credit rating
- No public credit rating found in a search of rating agency sites on Nov 20, 2026
Flags to know about
regulatory
Ratings bring legal and regulatory claims
The FY2025 10-K says Moody's and MIS face legal and tax proceedings, regulatory investigations and claims by governments and private parties based on ratings MIS assigned. It names no amounts.
disclosure
Largest-holder data is old
The 2026 proxy shows Berkshire Hathaway at 13.90%, based on a Schedule 13G/A filed in Feb 2014. Newer holder filings were not collected for this page.
22How it got here
22How it got here
How did Moody's get here?
2006
Milestone
Stake in China's CCXI
Bought 49% of CCXI, a domestic Chinese rating agency; it owned 30% at Sep 30, 2026.
2019
Business-model change
Sold Knowledge Services
Sold Moody's Analytics Knowledge Services (formerly Copal Amba), an offshore research unit, in Q4 2019.
2021
Milestone
Robert Fauber becomes CEO
Took over as President and CEO in Jan 2021 after running MIS and serving as COO.
2021
Milestone
Minority stake in BitSight
Invested in BitSight, which rates companies' cyber risk.
2024
Business-model change
Efficiency program starts
Approved on Dec 19, 2024 to cut staff, offices, old software and some businesses; widened in July 2026.
2025
Milestone
CAPE Analytics and ICR Chile bought
Bought CAPE Analytics (property risk data) in Jan 2025 and the Chilean rating agency ICR Chile in Q3 2025; sold MA Learning Solutions.
2025
Milestone
Head of Moody's Analytics leaves
Stephen Tulenko resigned as President of Moody's Analytics effective Sep 2, 2025.
2026
Business-model change
MERIS bought, Regulatory Solutions sold
Bought Egypt's MERIS rating agency in Q1 2026. Sold MA Regulatory Solutions in Q2, with pre-tax gains of $179 million in Q2 and $115 million in Q3.
23Sources and changes
Where every number on this page comes from
Sources (20 documents)
- S1Form 10-Q for Q3 FY2026 · SEC EDGAR · Tier 1: company or exchange filing · Oct 21, 2026
- S2Form 10-Q for Q2 FY2026 · SEC EDGAR · Tier 1: company or exchange filing · Jul 23, 2026
- S3Form 10-Q for Q1 FY2026 · SEC EDGAR · Tier 1: company or exchange filing · Apr 23, 2026
- S4Form 10-K for FY2025 · SEC EDGAR · Tier 1: company or exchange filing · Feb 18, 2026
- S5Form 10-Q for Q3 FY2025 · SEC EDGAR · Tier 1: company or exchange filing · Oct 23, 2025
- S6Form 10-Q for Q2 FY2025 · SEC EDGAR · Tier 1: company or exchange filing · Jul 24, 2025
- S7Form 10-Q for Q1 FY2025 · SEC EDGAR · Tier 1: company or exchange filing · Apr 23, 2025
- S8Form 10-K for FY2024 · SEC EDGAR · Tier 1: company or exchange filing · Feb 14, 2025
- S9Form 10-Q for Q3 FY2024 · SEC EDGAR · Tier 1: company or exchange filing · Oct 23, 2024
- S10Form 10-Q for Q2 FY2024 · SEC EDGAR · Tier 1: company or exchange filing · Jul 24, 2024
- S11Form 10-Q for Q1 FY2024 · SEC EDGAR · Tier 1: company or exchange filing · May 2, 2024
- S12Form 10-K for FY2023 · SEC EDGAR · Tier 1: company or exchange filing · Feb 14, 2024
- S13Form 10-K for FY2022 · SEC EDGAR · Tier 1: company or exchange filing · Feb 15, 2023
- S14Form 10-K for FY2021 · SEC EDGAR · Tier 1: company or exchange filing · Feb 22, 2022
- S152026 proxy statement (DEF 14A) · SEC EDGAR · Tier 1: company or exchange filing · Mar 4, 2026
- S16Q3 FY2026 earnings release (8-K Ex. 99.1) · SEC EDGAR · Tier 1: company or exchange filing · Oct 21, 2026
- S17Q2 FY2026 earnings release (8-K Ex. 99.1) · SEC EDGAR · Tier 1: company or exchange filing · Jul 22, 2026
- S18Q1 FY2026 earnings release (8-K Ex. 99.1) · SEC EDGAR · Tier 1: company or exchange filing · Apr 22, 2026
- S19Q4 FY2025 earnings release (8-K Ex. 99.1) · SEC EDGAR · Tier 1: company or exchange filing · Feb 18, 2026
- S20Q4 FY2024 earnings release (8-K Ex. 99.1) · SEC EDGAR · Tier 1: company or exchange filing · Feb 13, 2025
Changes to this page (v1 · Nov 20, 2026)
- v1 · Nov 20, 2026First version. (first version)
Numbers come only from tier 1 and tier 2 sources. Read how we research.
Disclaimer
For learning only. Cityfort is not a registered investment adviser or broker-dealer and does not recommend buying or selling any security. Prices shown are dated and may be out of date.
Investing in securities involves risk, including loss of capital. Before making any investment decision, do your own research and consider consulting a registered investment adviser or other qualified professional.
Cityfort, its owners and contributors may or may not hold securities of companies covered. Cityfort is not paid by any company it covers. Content is not an offer or solicitation to buy or sell any security, including in any initial public offering.
Read the positions policyRead the full disclaimerHide the full disclaimer
Cityfort publishes general educational content that explains how listed companies work. Cityfort is not registered with the US Securities and Exchange Commission or any state securities regulator as an investment adviser, and is not a broker-dealer or a member of FINRA. Cityfort does not provide investment, tax or legal advice, recommendations, ratings, price targets or any opinion on whether to buy, sell or hold any security. Nothing on the site is tailored to any person's circumstances.
All information is taken from publicly available sources, mainly company filings with the SEC, which are listed on each page with dates. We work to keep it accurate and correct errors publicly, but we do not guarantee that it is complete, accurate or up to date. Any market price or price-based ratio shown is dated, may be out of date by the time you read it, and is included only to explain concepts.
Statements by company management, including forward-looking statements and guidance, are reported as the company's statements, with their date and source; they are not our forecasts. Adjusted (non-GAAP) figures are the company's own measures and are shown next to the official (GAAP) figures.