Financials · NASDAQ: NDAQ
Nasdaq: how the business works
Nasdaq runs The Nasdaq Stock Market and sells market data, index licenses and anti-fraud software to banks and fund managers, with $5,249 million of net revenue in FY2025.
By Hardik Bhandare · Checked against filings: . Editorial policy. Corrections
Follow Nasdaq
Email me when Nasdaq's page is updated after earnings.
We'll send a confirmation email first. See our privacy policy.
Nasdaq, Inc. · New York, New York · Founded 1971
Updated for Q3 FY2026 · checked
- Net revenue, FY2025
- $5.25B
- Net income, FY2025
- $1.79B
- Companies listed on Nasdaq, Dec 31, 2025
- 4,480
- Employees, Dec 31, 2025
- 9,525
- Founded
- 1971
The short version
Nasdaq in 5 points
1 · What it sells
Nasdaq runs The Nasdaq Stock Market, with 4,480 listed companies at Dec 31, 2025, and sells market data, index licenses and anti-fraud and regulatory software, with net revenue of $5,249 million in FY2025.
2 · Who pays it
In FY2025, listed companies, data users and fund companies paid 40.7% of Nasdaq's net revenue, banks and exchanges buying software 35.2%, traders 22.9% and businesses being sold or wound down 1.2%.
3 · What it keeps from $100
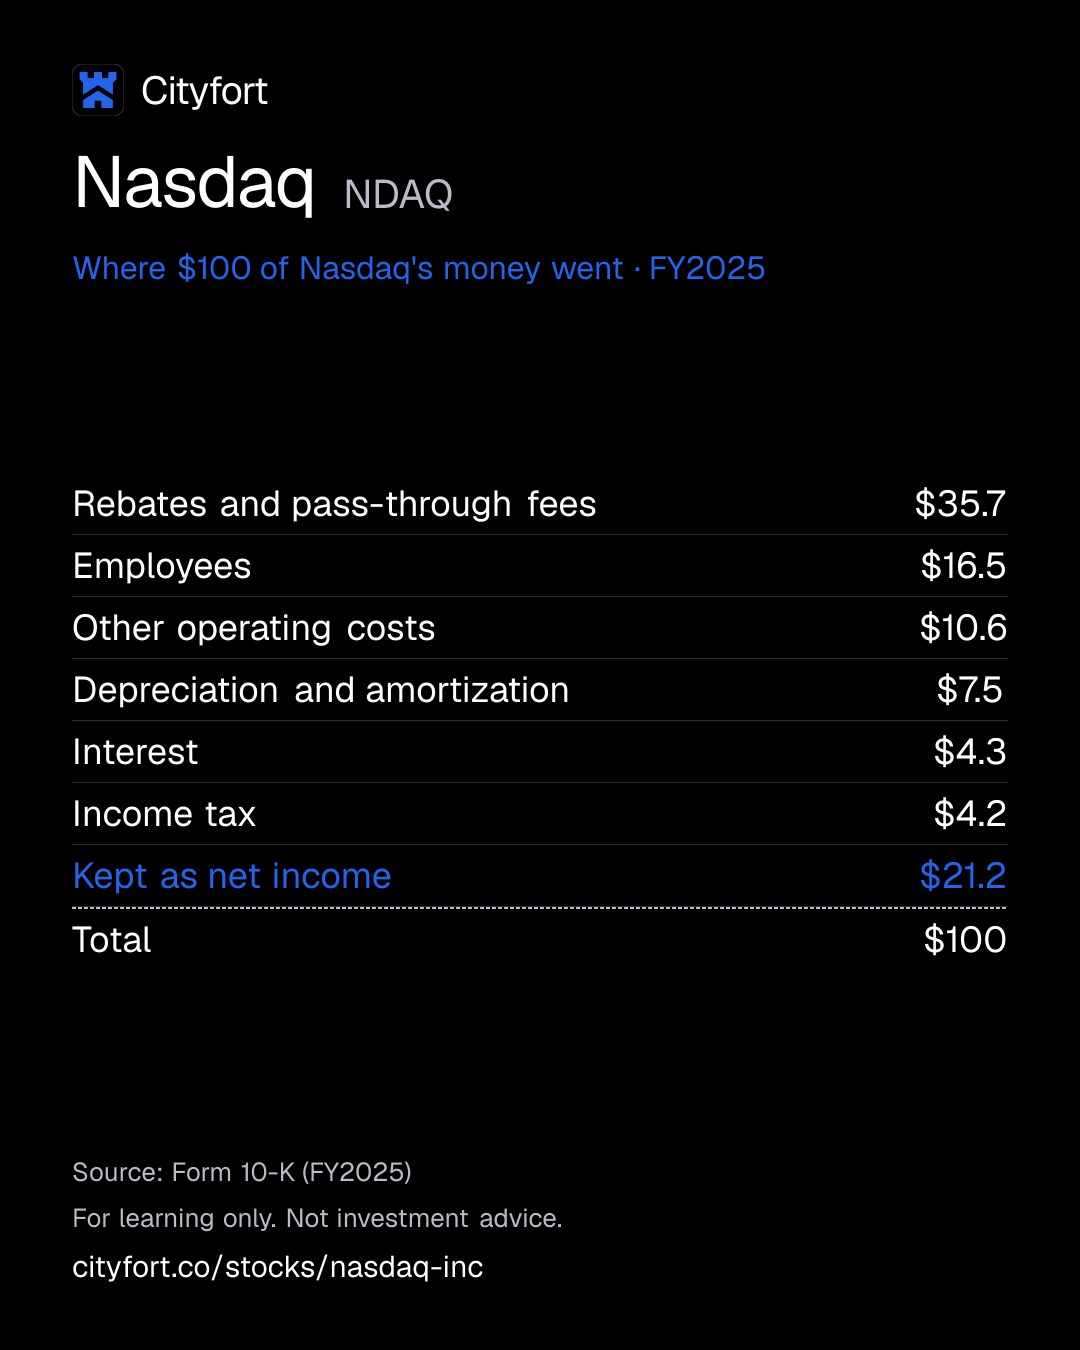
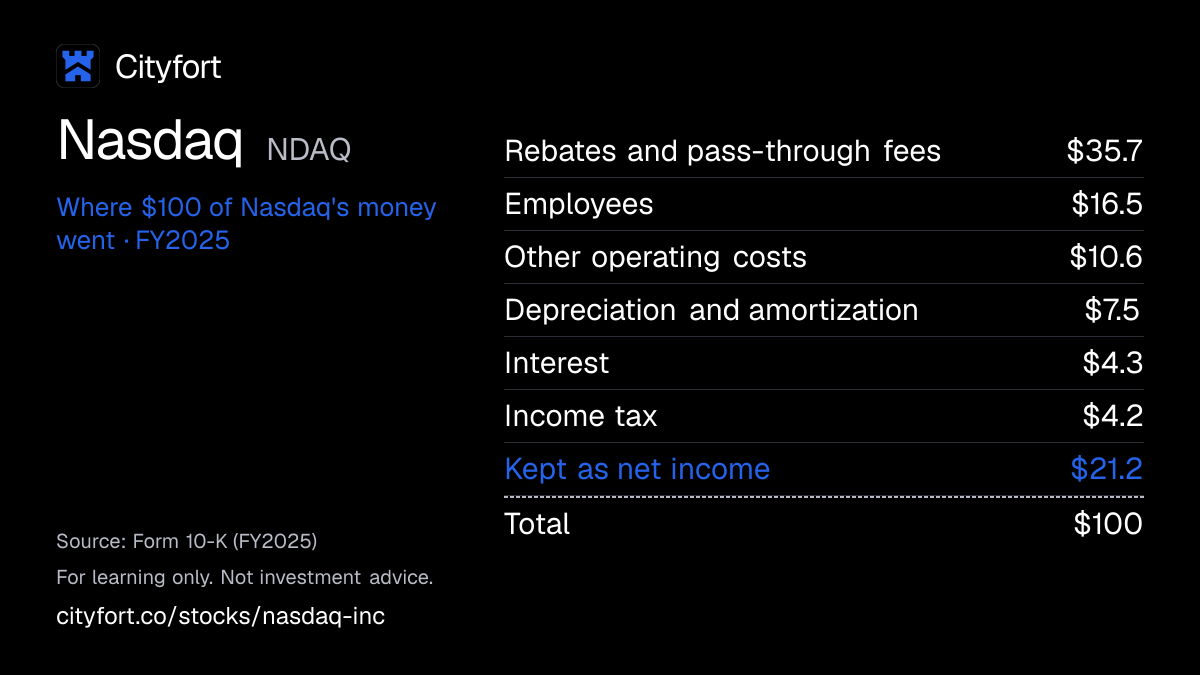
Of every $100 that came in during FY2025, Nasdaq kept $21.2 as net income after $35.7 of rebates and pass-through fees; net income includes an $86 million gain on businesses sold, and operating income was $2,331 million.
4 · Where the operating profit comes from
Capital Access Platforms earned $1,274 million of FY2025 segment operating income, Financial Technology $860 million and Market Services $764 million, before corporate items such as amortization of acquired intangibles.
5 · The one thing to watch
Nasdaq said in its Q3 FY2026 release that 23/5 trading was on track to go live on Dec 6, 2026; Market Services, its trading segment, earned $309 million of net revenue in Q3 FY2026.
Sources: From Nasdaq's FY2025 10-K, the Q3 FY2026 10-Q and the Q3 FY2026 earnings release · checked
01Where the money goes · FY2025
Where does $100 of Nasdaq's money go?
Nasdaq · FY2025
Receipt for every $100
| Rebates and pass-through fees | $35.7 |
|---|---|
| Employees | $16.5 |
| Other operating costs | $10.6 |
| Depreciation and amortization | $7.5 |
| Interest | $4.3 |
| Income tax | $4.2 |
| Kept as net income | $21.2 |
| Total | $100 |
Each line = amount ÷ total money in × 100. Lines may not add to exactly $100 because of rounding.
How this is worked out
Cityfort calculation from the FY2025 10-K. Of every $100 that came in during FY2025 (total revenue plus $181 million of other income): each line = line ÷ $8,443 million × 100.
Save this receipt as an image
Embed this receipt or the key numbers
Paste this code into a blog or website to show the card you choose, with a link back to this page.
Each week: the next company due to report earnings, explained in 5 points.
No tips. Unsubscribe anytime.
We'll send a confirmation email. See our privacy policy.
02The business in one line
What does Nasdaq do?
Listed companies, fund managers, banks and traders pay Nasdaq for listings, data, index licenses, software and trades. It hands most trading fees back as rebates, and staff are its biggest remaining cost.
- In FY2025, Capital Access Platforms (listings, data, indexes) earned 40.7% of net revenue, Financial Technology (software) 35.2% and Market Services (trading) 22.9%.
- Of $8,262 million of total revenue in FY2025, $3,013 million went back to traders and other exchanges as rebates and pass-through fees, and staff cost $1,392 million.
03Who pays it
Who pays Nasdaq?
Nasdaq does not disclose how much each type of customer pays.
Listed companies and data users
Pay listing fees, market data fees and subscriptions in Capital Access Platforms: $2,137 million of FY2025 revenue.
Fund companies
Pay to license Nasdaq indexes for exchange-traded products. Index revenue was $827 million in FY2025, part of Capital Access Platforms.
Banks, brokers and other exchanges
Buy Financial Technology software for fraud checks, regulatory reporting and trading: $1,850 million in FY2025.
Traders and brokers
Pay trading and clearing fees in Market Services: $1,201 million in FY2025 after rebates and pass-through fees.
Where its revenue came from · FY2025
- United States72%
- All other countries28%
How spread out the customers are
The FY2025 10-K says no single customer was 10.0% or more of revenue in 2025, 2024 or 2023. It also says Market Services revenue comes from "a relatively small number of customers concentrated in the financial industry".
Sources (1)
04How it makes money
How does Nasdaq make money?
Most net revenue (after rebates) now comes from subscriptions and licenses that renew each year.
Capital Access Platforms and Financial Technology revenue is mostly earned over the life of contracts. Annualized recurring revenue (ARR, the yearly value of subscription contracts) was $3,365 million at Sep 30, 2026. Trading revenue moves with market activity, but most of it is paid back to traders.
Operating income per $100 of net revenue
$42.1$44.4
FY2021 to FY2025
- Banks, fund managers and companies sign multi-year contracts.
- Contracts renew each year, which builds recurring revenue.
- In FY2025 operating costs rose 2.4% while net revenue rose 12.9%.
- Operating income per $100 of net revenue rose from $42.1 in FY2021 to $44.4 in FY2025.
- Cash pays down debt, funds dividends and buys back shares.
↺ Step 5 feeds back into step 1.
05Business segments · FY2025
Which businesses make up Nasdaq?
Capital Access Platforms
40.7%Listings, market data, index licenses and workflow tools.
Revenue $2.1B ($2,137M) · Operating profit $1.3B ($1,274M)
Financial Technology
35.2%Anti-fraud, regulatory reporting and trading software for banks and exchanges.
Revenue $1.9B ($1,850M) · Operating profit $860M
Market Services
22.9%Trading and clearing fees, after rebates and pass-through fees.
Revenue $1.2B ($1,201M) · Operating profit $764M
Other
1.2%Revenue from businesses sold or being wound down.
Revenue $61M
How the mix changed
- Capital Access Platforms
- Financial Technology
- Market Services
- Other
Revenue by segment, FY2023 to FY2025.
US$
See the numbers
Sources (1)
06The numbers · Consolidated · US$
How has Nasdaq done?
Revenue
$8.3BFY2025
Total revenue rose from $5,886 million in FY2021 to $8,262 million in FY2025; after rebates and pass-through fees, net revenue was $5,249 million.
US$
See the numbers
Net income
$1.8BFY2025
Net income fell from $1,187 million in FY2021 to $1,059 million in FY2023, was $1,117 million in FY2024 and reached $1,788 million in FY2025.
US$
See the numbers
Net income for every $100 of revenue
$21.6FY2025
Net income per $100 of total revenue was $21.6 in FY2025, up from $15.1 in FY2024; per $100 of net revenue it was $34.1.
Net margin: $ of net income per $100 of revenue
See the numbers
Free cash flow
$2.0BFY2025
Cash from operations minus capital spending rose from $920 million in FY2021 to $1,989 million in FY2025.
US$ · cash from operations minus spending on plants and equipment
See the numbers
See all yearly numbers
EBITDA here = operating income plus depreciation and amortization (from the cash flow statement). Fiscal years are the company's own: Fiscal year ends Dec 31 (the calendar year); Q4 is October to December. Net income is the share belonging to the company's owners.
Learn: Stock-based compensation and dilution: pay that becomes shares
Sources (16)
- Form 10-K for FY2021
- Form 10-K for FY2023
- Form 10-K for FY2022
- Form 10-K for FY2024
- Form 10-K for FY2025
- Form 10-Q for Q1 FY2024
- Form 10-Q for Q2 FY2024
- Form 10-Q for Q3 FY2024
- Q4 FY2025 earnings release (8-K Exhibit 99.1)
- Q4 FY2024 earnings release (8-K Exhibit 99.1)
- Form 10-Q for Q1 FY2026
- Form 10-Q for Q1 FY2025
- Form 10-Q for Q2 FY2026
- Form 10-Q for Q2 FY2025
- Form 10-Q for Q3 FY2026
- Form 10-Q for Q3 FY2025
07Who runs it
Who runs Nasdaq, and did they deliver?
Adena T. Friedman
Chair and Chief Executive Officer · since 2017
CEO since Jan 1, 2017 and Chair since Jan 1, 2023. Total 2025 pay in the summary compensation table: $25,014,550, mostly stock awards.
Sarah Youngwood
Executive Vice President and Chief Financial Officer · since 2023
CFO since December 2023. Total 2025 pay: $9,945,096.
Tal Cohen
President · since 2023
Leads the Market Services and Financial Technology divisions.
P.C. Nelson Griggs
President · since 2023
Leads Capital Access Platforms, including listings, index and workflow businesses.
Bradley J. Peterson
Executive Vice President, Chief Information Officer and Chief Technology Officer
His employment agreement continues the role through Jan 1, 2028.
Michael R. Splinter
Lead Independent Director · since 2023
Lead independent director since Jan 1, 2023; 11 of the 12 director nominees in the 2026 proxy were independent.
Börje Ekholm
Director · since 2026
Elected to the board from Nov 1, 2026. Director Holden Spaht leaves the board on Dec 31, 2026.
What they said, and what happened
2 too early to tell
Said on Oct 22, 2026
Nasdaq said in its Q3 FY2026 release that 23/5 trading on The Nasdaq Stock Market was on track to go live on Dec 6, 2026.
Too early to tellWhat happened
Due after the latest filing used on this page.
Said on Jan 29, 2026
On Jan 29, 2026 Nasdaq gave 2026 non-GAAPThe company's own "adjusted" numbers, not the official (GAAP) ones. Always read them next to the official figure. Learn more operating expense guidance of $2.455 billion to $2.535 billion.
Too early to tellWhat happened
The range was raised to $2.485–2.545 billion on Apr 23, $2.530–2.570 billion on Jul 23 and $2.550–2.580 billion on Oct 22, 2026. Full-year results are not out yet.
08What could go wrong
What could go wrong for Nasdaq?
- Demand
Trading volumes drive Market Services
The FY2025 10-K says trading volumes and market conditions drive Market Services revenue. That segment was 22.9% of FY2025 net revenue.
Watch Market Services net revenue each quarter ($309 million in Q3 FY2026).
- Concentration
A few large trading customers
Market Services revenue comes from a relatively small number of customers in the financial industry, according to the 10-K.
Watch Any customer the 10-K names as 10% or more of revenue.
- Demand
Listings depend on capital raising
New listings and listing fees depend on companies choosing to go public or switch exchanges, which depends on capital-raising conditions.
Watch New US listings per year (784 in 2025).
- Debt
Debt and credit ratings
Total debt was $8,740 million at Sep 30, 2026. The 10-K says a downgrade would raise borrowing costs, and coupons step up by up to 2% below investment grade.
Watch Total debt and any change in credit ratings.
- Execution
Integrating acquired software businesses
Amortization of acquired intangibles was $487 million in FY2025, and goodwill was $14,371 million at Dec 31, 2025. The 10-K names acquisition and integration as a risk.
Watch Financial Technology revenue growth and any goodwill impairment.
- Technology
Outages and cyberattacks
The 10-K says system failures or cybersecurity breaches could disrupt its markets and software, which clients use for trading and compliance.
Watch Any reported outage or security incident in filings.
- Regulation
Rule changes for exchanges
Its US exchanges are regulated by the SEC, and the 10-K names changes in regulation as a risk to its business.
Watch SEC rule changes on trading fees, rebates and market data.
09Supporters vs. critics
What do supporters and critics point to?
What supporters point to
- Net income rose from $1,117 million in FY2024 to $1,788 million in FY2025, and diluted EPS from $1.93 to $3.09.
- Annualized recurring revenue, a company measure of subscription contracts, was $3,365 million at Sep 30, 2026, up 12% from a year earlier.
- Exchange-traded products tracking Nasdaq indexes held $1.160 trillion at Sep 30, 2026, up from $882 billion at Dec 31, 2025. Index revenue was $286 million in Q3 FY2026, against $206 million a year earlier.
- New US listings rose from 463 in 2024 to 784 in 2025.
- Cash from operations minus capital spending rose from $920 million in FY2021 to $1,989 million in FY2025.
What critics point to
- Total debt was $8,740 million at Sep 30, 2026, against $365 million of cash and cash equivalents. It rose from $5,399 million at Dec 31, 2022 to $10,454 million a year later, with the Adenza purchase.
- Of every $100 that came in during FY2025, $35.7 went back to traders and other exchanges as rebates and pass-through fees.
- The FY2025 10-K says Market Services revenue depends on trading volumes and comes from a relatively small number of customers in the financial industry.
- Goodwill was $14,371 million at Dec 31, 2025, and amortization of acquired intangibles was $487 million in FY2025.
- The FY2025 10-K names eight rival US exchange operators, plus off-exchange trading, and lists falling market share as a risk.
10What to watch next
What should you watch next at Nasdaq?
Next event
Q4 FY2026 results
Date not announced yet.
The 23/5 trading launch
Nasdaq said in its Oct 22, 2026 release that trading 23 hours a day, five days a week on The Nasdaq Stock Market was on track to go live on Dec 6, 2026.
Spending against guidance
On Oct 22, 2026 Nasdaq put its 2026 non-GAAP operating expense guidance at $2.550 billion to $2.580 billion, after raising the range three times since Jan 29, 2026. Q4 FY2026 results will show the full-year figure.
Software subscriptions
Nasdaq said Financial Technology ARR grew 18% organically in Q3 FY2026, and that Verafin signed 12 enterprise deals in the first nine months of 2026, against 9 in all of 2025.
Debt
Total debt was $8,740 million at Sep 30, 2026. The FY2025 10-K says note coupons rise by up to 2% if the notes are rated below investment grade.
11Key dates
What are the key dates for Nasdaq?
| Event | Date | Source |
|---|---|---|
| Dividend record date$0.31 per share. | Q3 FY2026 dividend release (8-K Exhibit 99.2) | |
| Planned start of 23/5 tradingThe company said in its Q3 FY2026 release that it was on track. | Q3 FY2026 earnings release (8-K Exhibit 99.1) | |
| Dividend payment date | Q3 FY2026 dividend release (8-K Exhibit 99.2) | |
| Director Holden Spaht leaves the board | 8-K filed Oct 26, 2026: director changes | |
| Laura DeLorenzo becomes Chief Controller and Principal Accounting OfficerMichelle Daly moves to finance and strategy roles in Capital Access Platforms. | 8-K filed Nov 18, 2026: officer changes |
Learn: What is an 8-K? A company's news report, with a real Adobe filing
12Key facts
Key facts about Nasdaq
- What does Nasdaq do?
- Nasdaq, Inc. runs The Nasdaq Stock Market, which had 4,480 listed companies at Dec 31, 2025, plus exchanges in the Nordic and Baltic countries. It also licenses its indexes and sells anti-fraud, regulatory reporting and trading software.
- How does Nasdaq make money?
- In FY2025, Nasdaq earned $2,137 million of net revenue from Capital Access Platforms (listings, data, index licenses), $1,850 million from Financial Technology software and $1,201 million from Market Services trading fees after rebates.
- Who are Nasdaq's customers?
- Nasdaq's customers are listed companies, fund companies that license its indexes, banks and brokers that buy its software, and trading firms. Its FY2025 10-K says no single customer was 10% or more of revenue in 2025, 2024 or 2023.
- How big is Nasdaq?
- Nasdaq had $8,262 million of total revenue in FY2025, or $5,249 million after rebates and pass-through fees, and net income of $1,788 million ($3.09 per diluted share). It had 9,525 employees at Dec 31, 2025.
- Why does Nasdaq report two revenue figures?
- Nasdaq pays much of its US trading fees back to traders as rebates. In FY2025 it reported $8,262 million of total revenue and $5,249 million of revenue less transaction-based expenses, which it uses as its headline figure.
- Who owns Nasdaq?
- In Nasdaq's 2026 proxy, Investor AB and Borse Dubai each held about 10.3% of shares, Wellington Management 7.3% and BlackRock 5.3%, each as of its own filing date. Nasdaq's charter generally caps any holder at 5% of voting power.
- How much debt does Nasdaq have?
- Nasdaq had $8,740 million of total debt and $365 million of cash and cash equivalents at Sep 30, 2026, according to its Q3 FY2026 10-Q. Debt rose in 2023, when it bought Adenza.
- Does Nasdaq pay a dividend?
- Nasdaq paid $1.05 per share of dividends in FY2025, $601 million in total. On Oct 22, 2026 it declared $0.31 per share, payable Dec 18, 2026.
Terms on this page
- Annual recurring revenue (ARR)
- Capital expenditures (capex)
- Debt-to-equity
- Earnings per share (EPS)
- EBITDA
- Free cash flow
- Interest coverage
- Net debt
- Net margin
- Revenue vs net income
Each explains the term in plain English, with the same number from other companies on Cityfort.
Go deeper
More detail from the same filings. Open any section.
13What it sells
13What it sells
What does Nasdaq sell?
Listings and market data
Companies pay to list their shares on The Nasdaq Stock Market, which had 4,480 listed companies at Dec 31, 2025, including 1,112 exchange-traded products. Investors and firms pay for its price data.
Index licenses
Fund companies pay Nasdaq license fees to base exchange-traded products on its indexes. Those products held $882 billion at Dec 31, 2025 and $1.160 trillion at Sep 30, 2026.
Workflow and insights
Subscription tools for asset managers and listed companies, such as eVestment data and investor relations software.
Financial crime software
Verafin software helps banks spot money laundering and fraud. Nasdaq bought Verafin in February 2021.
Regulatory and capital markets technology
AxiomSL helps banks file regulatory reports, and Calypso runs trading and risk systems; both came with the Adenza purchase in 2023. Nasdaq also sells trading and surveillance systems to other exchanges.
Trading
Fees from US options and stock trading, Nordic and Baltic markets and Canadian stock trading. Much of the US fee is paid back to traders as rebates.
Think of it like this
The software and data side works like a subscription: banks, fund managers and companies pay each year to keep using it.
What it does
- Does: Runs The Nasdaq Stock Market and stock exchanges in the Nordic and Baltic countries.
- Does: Licenses its indexes, such as those tracked by exchange-traded products.
- Does: Sells anti-fraud, regulatory reporting and trading software to banks and other exchanges.
What it does not do
- Does not: It does not keep most of its US trading fees: it paid $2,572 million of rebates to traders in FY2025.
- Does not: It does not own the companies listed on its market; they pay it listing fees.
- Does not: It no longer runs Nordic power futures: those positions moved to another European exchange in June 2025.
14How the money flows
14How the money flows · FY2025
How does money flow through Nasdaq?
Money in
- Total revenue (before rebates paid to traders)$8.3B
- Interest income, gains on businesses sold and investee earnings, net of other expense$181M
The company
Nasdaq
$8.4B came in
Money out
- Rebates and fees passed to traders and other exchanges$3.0B
- Employee pay and benefits$1.4B
- Technology, offices, advisers, marketing and other costs$894M
- Depreciation and amortization$632M
- Interest on debt$367M
- Income tax$358M
- Net income$1.8B
- Nasdaq took in $8,262 million of total revenue in FY2025.
- It paid $3,013 million straight back as trading rebates and pass-through fees, leaving $5,249 million of net revenue.
- Staff cost $1,392 million, other operating costs $894 million, and depreciation and amortization $632 million.
- Interest income, an $86 million gain on businesses sold and earnings from part-owned companies, less $27 million of other expense, added a net $181 million. Interest on debt took $367 million.
- After $358 million of tax, $1,787 million was left as net income; Nasdaq's share was $1,788 million.
Sources (1)
15What it needs to run
15What it needs to run
What does Nasdaq need to run?
Technology and cloud capacity
Exchanges and software must run without outages. Nasdaq expanded a multi-year AWS contract in 2025; most of its $1,506 million of purchase obligations is for AWS.
People
Nasdaq had 9,525 full and part-time employees at Dec 31, 2025. Pay and benefits were its largest operating cost, at $1,392 million in FY2025.
Exchange licenses
The Nasdaq Stock Market has been a registered national securities exchange since 2007, so the SEC regulates how it runs.
Clearing collateral
Its clearing house holds members' default funds and margin deposits: $5,842 million at Dec 31, 2025, matched by an equal liability.
Sources (1)
16Where it sells
16Where it sells · FY2025
Where does Nasdaq sell?
- United States72%
- All other countries28%
Sources (1)
17Competitors and what protects it
17Competitors and what protects it
Who does Nasdaq compete with?
Intercontinental Exchange (NYSE)
Named in the FY2025 10-K as a competitor in US options and US cash equities trading.
Cboe Global Markets
Named in the FY2025 10-K as a competitor in US options and US cash equities trading.
Miami International Holdings (MIAX)
Named in the FY2025 10-K as a competitor in US options and US cash equities trading.
Members Exchange (MEMX)
Named in the FY2025 10-K as a competitor in US options and US cash equities trading.
Euronext, Deutsche Börse and London Stock Exchange Group
Named in the FY2024 10-K as competitors for Nasdaq's European cash equities markets.
What protects the business
Each strength is scored 1 (weak) to 5 (strong) for the business, with the reason. It is not a rating of the share.
- Listings4 of 5
Nasdaq added 784 new US listings in 2025, up from 463 in 2024, and companies worth more than $1,241 billion switched their listing to Nasdaq in 2025.
- Recurring revenue4 of 5
Annualized recurring revenue, a company measure, was $3,365 million at Sep 30, 2026, up 12% from a year earlier.
- Index brand4 of 5
Exchange-traded products tracking Nasdaq indexes held $1.160 trillion at Sep 30, 2026, up from $882 billion at Dec 31, 2025.
- Trading share2 of 5
The FY2025 10-K names eight rival US exchange operators plus off-exchange trading, and names falling market share as a risk.
Weak spot
Trading volumes
Market Services revenue depends on trading volumes and market conditions, and comes from a relatively small number of financial firms, according to the FY2025 10-K.
18Where growth could come from
18Where growth could come from
Where could Nasdaq's growth come from?
In its Oct 22, 2026 earnings release, Nasdaq updated its 2026 non-GAAP operating expense guidance to $2.550 billion to $2.580 billion and kept its non-GAAP tax rate range at 22.5% to 24.5%. The release gives no revenue or EPS guidance.
Financial Technology subscriptions
Working18% organic ARR growth, Q3 FY2026
Nasdaq said Financial Technology ARR grew 18% organically in Q3 FY2026, a record for the division. Its revenue grew 16%.
Status: Working, on track against what the company said.
Index licenses
Working$286M revenue, Q3 FY2026
Index revenue was $286 million in Q3 FY2026, up from $206 million in Q3 FY2025. Net inflows over the 12 months to Sep 30, 2026 were $141 billion.
Status: Working, on track against what the company said.
New listings
Working784 new US listings in 2025
New US listings rose from 463 in 2024 to 784 in 2025, including 155 operating-company IPOs. In Q3 FY2026, 15 new operating-company listings raised $32 billion.
Status: Working, on track against what the company said.
Anti-fraud software for large banks
Working12 enterprise deals, 9M FY2026
Verafin signed 12 enterprise deals in the first nine months of 2026, against 9 in all of 2025, the company said.
Status: Working, on track against what the company said.
23/5 trading
NewPlanned start Dec 6, 2026
Nasdaq said in its Q3 FY2026 release that 23/5 trading (23 hours a day, five days a week) on The Nasdaq Stock Market was on track to go live on Dec 6, 2026.
Status: New, recently announced.
Status compares progress with what the company itself said it would do: Working = on track against what the company said; Mixed = partly on track; Behind = behind the company's own plan; New = recently announced; Early = too early to judge.
19The company's own measures (non-GAAP)
19The company's own measures · FY2025 and Q3 FY2026
What do Nasdaq's own measures show?
Official (GAAP): Net income attributable to Nasdaq, FY2025
$1.8B
Company's own measure: Non-GAAP net income, FY2025
$2.0B
Nasdaq leaves out amortization of acquired intangibles, merger and restructuring costs and some other items.
Official (GAAP): Diluted EPS, FY2025
$3.09
Company's own measure: Non-GAAP diluted EPS, FY2025
$3.48
The same exclusions as non-GAAP net income.
Official (GAAP): Operating income ÷ net revenue, FY2025
44.4%
Company's own measure: Non-GAAP operating margin, FY2025
56%
Both on revenue less transaction-based expenses; the GAAP figure is a Cityfort calculation from the FY2025 10-K.
Official (GAAP): Operating income, Q3 FY2026
$732M
Company's own measure: Non-GAAP operating income, Q3 FY2026
$843M
The same exclusions, for the July to September 2026 quarter.
Official (GAAP): Diluted EPS, Q3 FY2026
$0.96
Company's own measure: Non-GAAP diluted EPS, Q3 FY2026
$1.04
The same exclusions.
Official (GAAP): Revenue less transaction-based expenses, Q3 FY2026 (one quarter)
$1.5B
Company's own measure: Annualized recurring revenue (ARR), Sep 30, 2026
$3.4B
The yearly value of subscription contracts with a set contract value; it leaves out one-time and usage-based fees, so it does not match quarterly revenue. Up 12% from a year earlier (14% organic).
These are the company's own measures, defined by the company. They are not comparable across companies, and they are not added together. Each sits beside the nearest official (GAAP) figure.
Learn: Non-GAAP measures: what a company's "adjusted" numbers leave out
20Financial strength and debt
20Financial strength · Sep 30, 2026
How much debt does Nasdaq have?
- Total debt$8.7B
- Cash and investments$365M
- Net debt (debt minus cash)$8.4B
- Net worth (shareholders' money)$12.0B
- Debt to equity
- 0.73×
- $ of debt for every $1 of shareholders' money
- Interest cover
- 6.4×
- how many times operating profit covers interest
- Net debt is a Cityfort calculation from the Q3 FY2026 10-Q: $269 million of short-term and $8,471 million of long-term debt, minus $365 million of cash and cash equivalents.
- Total debt rose from $5,399 million at Dec 31, 2022 to $10,454 million at Dec 31, 2023, the year of the Adenza purchase; FY2023 debt issuance was $5,608 million.
- Interest coverage (Cityfort calculation from the FY2025 10-K): FY2025 operating income of $2,331 million ÷ $367 million of interest expense = 6.4 times.
- The FY2025 10-K says all of Nasdaq's notes carry fixed rates, at a weighted average of about 3.7% at Dec 31, 2025; coupons rise by up to 2% if the notes are rated below investment grade.
- Default funds and margin deposits of members ($5,842 million at Dec 31, 2025) sit on the balance sheet with an equal liability; they are not counted as Nasdaq's cash.
- On Jun 30, 2026 Nasdaq signed a new $1.5 billion five-year revolving credit facility, due Jun 30, 2031; no loans were outstanding on Jul 1, 2026.
21Who owns it
21Who owns it · ownership as of Apr 13, 2026
Who owns Nasdaq?
- Officers and directors (as a group), shares
- 0.6%
Share classes
Holders of 5% or more
From the company's proxy statement (DEF 14A), later Schedule 13G filings and the share counts on its latest annual or quarterly report. Each holder row shows the date of its own filing.
Learn: How to read a proxy statement (DEF 14A): Nvidia's 2026 proxy · Form 4 insider filings: who files, the codes and the footnotes
22What it does with profit
22What it does with profit
What does Nasdaq do with its profit?
Dividend per share
$1.05FY2025
Dividend paid for each share, by financial year.
$ per share
See the numbers
Buyback · Sep 30, 2026
9M FY2026: share repurchases of $548 million, $356 million and $323 million in the first three quarters (sum is a Cityfort calculation from the Q1 to Q3 FY2026 earnings releases). $2.2 billion of authorization was left at Sep 30, 2026.
$1.2B
Buyback · Dec 31, 2025
FY2025: repurchases of common stock, including accelerated share repurchases in October and November 2025.
$616M
Buyback · Dec 31, 2024
FY2024: repurchases of common stock.
$145M
Buyback · Dec 31, 2023
FY2023: repurchases of common stock.
$269M
Money raised · Nov 1, 2023
Adenza purchase: $5.75 billion in cash plus 85.6 million new Nasdaq shares issued to Thoma Bravo, about 15% of shares at the time; FY2023 debt issuance was $5,608 million.
$5.6B
23Governance signals
23Governance signals
What do Nasdaq's governance filings show?
- Auditor
- Ernst & Young LLP, since 1986
- Auditor changes
- None in the period covered
- Audit qualifications
- None reported
- Related-party dealings
- The Audit & Risk Committee reviews and approves related person transactions under a written policy. Stockholders' agreements require Nasdaq to nominate one director chosen by Borse Dubai and one chosen by Investor AB while each holds at least 10% of the shares.
- Credit rating
- Two of the major rating agencies (not named in the FY2025 10-K) Investment grade (grades not stated in the filing) (outlook Not stated in the filing), Feb 12, 2026
A credit rating describes the company's ability to repay debt. It is not a rating of the share.
Flags to know about
other
5% voting limit
Nasdaq's charter generally bars any shareholder from voting more than 5% of total voting power. A separate agreement limits Borse Dubai's voting power to 4.35% of outstanding shares.
related party
Director nomination rights
Borse Dubai and Investor AB each have the right to have one director nominated while they hold at least 10% of shares. Director Holden Spaht is a managing partner of Thoma Bravo, which received Nasdaq shares in the Adenza deal.
24How it got here
24How it got here
How did Nasdaq get here?
1971
Milestone
Founded
Nasdaq began as a wholly owned subsidiary of FINRA.
2006
Business-model change
Fully independent
FINRA sold its last Nasdaq shares in 2006; The Nasdaq Stock Market became a registered national securities exchange in 2007.
2008
Milestone
Bought OMX
The purchase of OMX AB brought the Nordic exchanges, including Helsinki, into Nasdaq.
2021
Milestone
Bought Verafin
Nasdaq bought Verafin, an anti-financial crime software provider, in February 2021.
2023
Business-model change
Bought Adenza
On Nov 1, 2023 Nasdaq bought Adenza, maker of AxiomSL and Calypso, for $9,984 million in cash and shares.
2025
Milestone
Sold non-core units
Nasdaq moved its Nordic power futures positions to another exchange in June 2025 and sold Solovis in October 2025.
2026
Milestone
Payward stake and LeveL purchase
In September 2026 Nasdaq invested $100 million in preferred stock of Payward, parent of Kraken. In October 2026 it bought the rest of LeveL Markets, an alternative trading system.
25Sources and changes
Where every number on this page comes from
Sources (25 documents)
- S1Form 10-Q for Q3 FY2026 · SEC EDGAR · Tier 1: company or exchange filing · Oct 22, 2026
- S2Form 10-Q for Q2 FY2026 · SEC EDGAR · Tier 1: company or exchange filing · Jul 23, 2026
- S3Form 10-Q for Q1 FY2026 · SEC EDGAR · Tier 1: company or exchange filing · Apr 24, 2026
- S4Form 10-K for FY2025 · SEC EDGAR · Tier 1: company or exchange filing · Feb 12, 2026
- S5Form 10-Q for Q3 FY2025 · SEC EDGAR · Tier 1: company or exchange filing · Oct 23, 2025
- S6Form 10-Q for Q2 FY2025 · SEC EDGAR · Tier 1: company or exchange filing · Jul 25, 2025
- S7Form 10-Q for Q1 FY2025 · SEC EDGAR · Tier 1: company or exchange filing · Apr 28, 2025
- S8Form 10-K for FY2024 · SEC EDGAR · Tier 1: company or exchange filing · Feb 21, 2025
- S9Form 10-Q for Q3 FY2024 · SEC EDGAR · Tier 1: company or exchange filing · Oct 29, 2024
- S10Form 10-Q for Q2 FY2024 · SEC EDGAR · Tier 1: company or exchange filing · Aug 6, 2024
- S11Form 10-Q for Q1 FY2024 · SEC EDGAR · Tier 1: company or exchange filing · May 2, 2024
- S12Form 10-K for FY2023 · SEC EDGAR · Tier 1: company or exchange filing · Feb 21, 2024
- S13Form 10-K for FY2022 · SEC EDGAR · Tier 1: company or exchange filing · Feb 23, 2023
- S14Form 10-K for FY2021 · SEC EDGAR · Tier 1: company or exchange filing · Feb 23, 2022
- S15Q3 FY2026 earnings release (8-K Exhibit 99.1) · SEC EDGAR · Tier 1: company or exchange filing · Oct 22, 2026
- S16Q3 FY2026 dividend release (8-K Exhibit 99.2) · SEC EDGAR · Tier 1: company or exchange filing · Oct 22, 2026
- S17Q2 FY2026 earnings release (8-K Exhibit 99.1) · SEC EDGAR · Tier 1: company or exchange filing · Jul 23, 2026
- S18Q1 FY2026 earnings release (8-K Exhibit 99.1) · SEC EDGAR · Tier 1: company or exchange filing · Apr 23, 2026
- S19Q4 FY2025 earnings release (8-K Exhibit 99.1) · SEC EDGAR · Tier 1: company or exchange filing · Jan 29, 2026
- S20Q3 FY2025 earnings release (8-K Exhibit 99.1) · SEC EDGAR · Tier 1: company or exchange filing · Oct 21, 2025
- S23Q4 FY2024 earnings release (8-K Exhibit 99.1) · SEC EDGAR · Tier 1: company or exchange filing · Jan 29, 2025
- S248-K filed Jul 1, 2026: amended and restated credit agreement · SEC EDGAR · Tier 1: company or exchange filing · Jul 1, 2026
- S258-K filed Oct 26, 2026: director changes · SEC EDGAR · Tier 1: company or exchange filing · Oct 26, 2026
- S268-K filed Nov 18, 2026: officer changes · SEC EDGAR · Tier 1: company or exchange filing · Nov 18, 2026
- S272026 proxy statement (DEF 14A) · SEC EDGAR · Tier 1: company or exchange filing · Apr 24, 2026
Changes to this page (v1 · Nov 20, 2026)
- v1 · Nov 20, 2026First version. (first version)
Numbers come only from tier 1 and tier 2 sources. Read how we research.
Disclaimer
For learning only. Cityfort is not a registered investment adviser or broker-dealer and does not recommend buying or selling any security. Prices shown are dated and may be out of date.
Investing in securities involves risk, including loss of capital. Before making any investment decision, do your own research and consider consulting a registered investment adviser or other qualified professional.
Cityfort, its owners and contributors may or may not hold securities of companies covered. Cityfort is not paid by any company it covers. Content is not an offer or solicitation to buy or sell any security, including in any initial public offering.
Read the positions policyRead the full disclaimerHide the full disclaimer
Cityfort publishes general educational content that explains how listed companies work. Cityfort is not registered with the US Securities and Exchange Commission or any state securities regulator as an investment adviser, and is not a broker-dealer or a member of FINRA. Cityfort does not provide investment, tax or legal advice, recommendations, ratings, price targets or any opinion on whether to buy, sell or hold any security. Nothing on the site is tailored to any person's circumstances.
All information is taken from publicly available sources, mainly company filings with the SEC, which are listed on each page with dates. We work to keep it accurate and correct errors publicly, but we do not guarantee that it is complete, accurate or up to date. Any market price or price-based ratio shown is dated, may be out of date by the time you read it, and is included only to explain concepts.
Statements by company management, including forward-looking statements and guidance, are reported as the company's statements, with their date and source; they are not our forecasts. Adjusted (non-GAAP) figures are the company's own measures and are shown next to the official (GAAP) figures.