Financials · NYSE: MET
MetLife: how the business works
MetLife sells workplace benefits, life insurance and pension takeovers in the U.S., Asia and Latin America, with total revenues of $77.1 billion in FY2025.
By Hardik Bhandare · Checked against filings: . Editorial policy. Corrections
Follow MetLife
Email me when MetLife's page is updated after earnings.
We'll send a confirmation email first. See our privacy policy.
MetLife, Inc. · New York, New York · Founded 1868
Updated for Q3 FY2026 · checked
- Total revenues, FY2025
- $77.1B
- Net income to common shareholders, FY2025
- $3.17B
- Investments it holds, Dec 31, 2025
- $472.2B
- Assets under management, Dec 31, 2025
- $741.7B
- Founded
- 1868
The short version
MetLife in 5 points
1 · What it sells
MetLife sells workplace benefits, life insurance, pension risk transfers and annuities in the U.S. and abroad, and its asset management arm had $741.7B of assets under management at Dec 31, 2025.
2 · Who pays it
In FY2025, Group Benefits (U.S. employers) brought in 37.2% of segment revenue, Retirement and Income Solutions 29.1%, Asia 16.5%, Latin America 11.5%, EMEA 4.4% and MetLife Investment Management 1.3%.
3 · What it keeps from $100
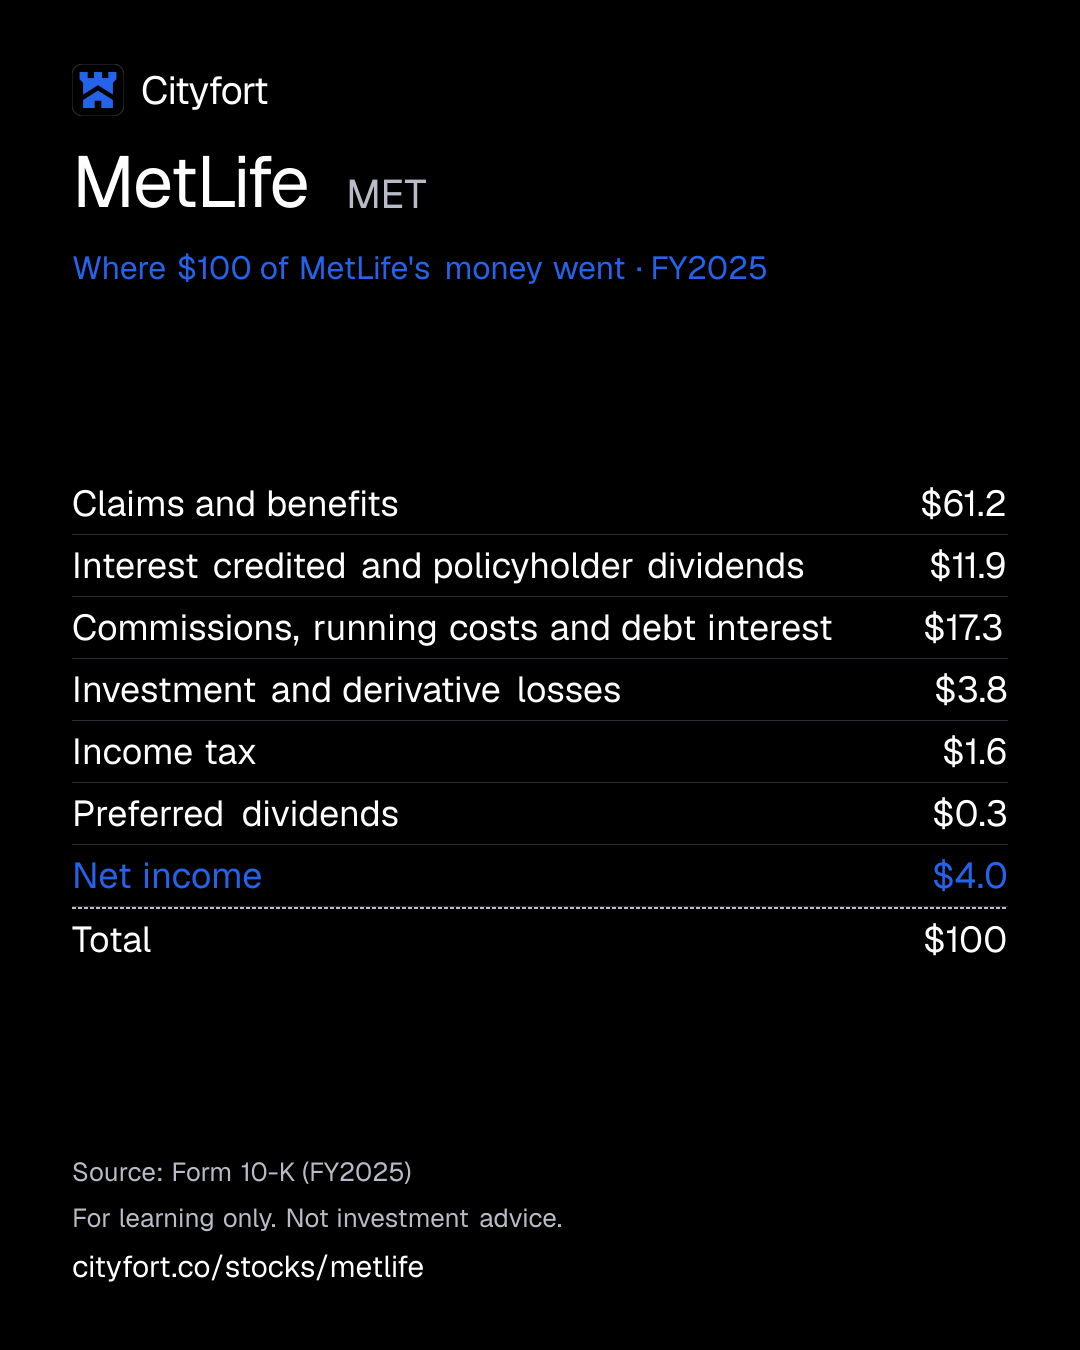
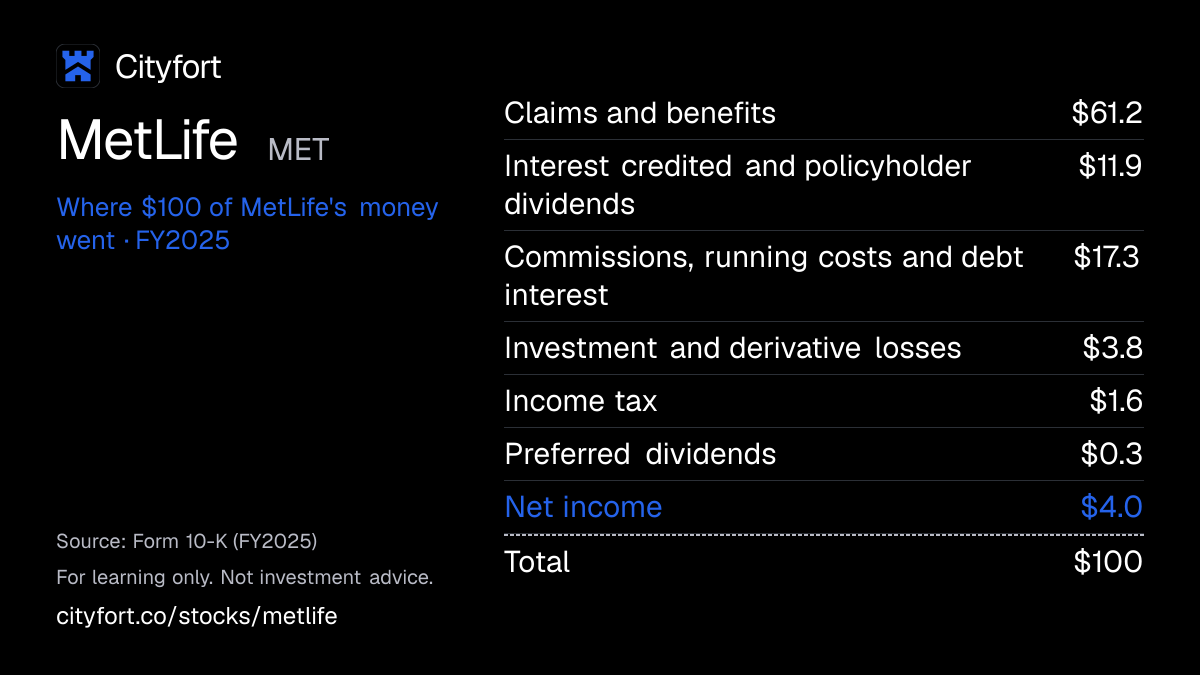
Of every $100 that came in during FY2025, MetLife spent $61.2 on claims and benefits and kept $4.0 as net income for common shareholders, after $3.8 of investment and derivative losses; its own operating measure, adjusted earnings available to common shareholders, was $5,943 million.
4 · Where the operating profit comes from
In FY2025, adjusted earnings were $1,702 million in Asia, $1,692 million in Group Benefits, $1,671 million in Retirement and Income Solutions and $798 million in Latin America, while Corporate & Other lost $293 million.
5 · The one thing to watch
Book value per share (stockholders' equity for each share) was $30.73 at Sep 30, 2026, against $39.52 a year earlier, and gross unrealized losses on its bonds were $43.9 billion.
Sources: From MetLife's FY2025 10-K, its Q3 FY2026 10-Q, its Q4 2025 earnings release and its Q4 2025 and Q3 2026 financial supplements · checked
01Where $100 of an insurer's money goes · FY2025
Where does $100 of MetLife's money go?
MetLife · FY2025
Receipt for every $100
| Claims and benefits | $61.2 |
|---|---|
| Interest credited and policyholder dividends | $11.9 |
| Commissions, running costs and debt interest | $17.3 |
| Investment and derivative losses | $3.8 |
| Income tax | $1.6 |
| Preferred dividends | $0.3 |
| Net income | $4.0 |
| Total | $100 |
Each line = amount ÷ total money in × 100. Lines may not add to exactly $100 because of rounding.
How this is worked out
Cityfort calculation from the FY2025 10-K. Of every $100 that came in (total money in of $80,168M: premiums, net investment income, policy fees and other revenues), each line = line ÷ $80,168M × 100. Claims = $49,718M of benefits and claims less $658M of remeasurement gains; losses = $1,145M of investment losses + $1,939M of derivative losses; preferred dividends = $194M of dividends + a $12M preferred stock redemption premium; net income is net income available to common shareholders ($3,173M); the $24M share of outside owners rounds to 0 and is left out.
Save this receipt as an image
Embed this receipt or the key numbers
Paste this code into a blog or website to show the card you choose, with a link back to this page.
Each week: the next company due to report earnings, explained in 5 points.
No tips. Unsubscribe anytime.
We'll send a confirmation email. See our privacy policy.
02The business in one line
What does MetLife do?
Employers, pension plans and families pay MetLife premiums years before claims fall due. MetLife invests that money, pays the claims, pensions and interest it owes, and keeps what is left.
- In FY2025 customers paid $49,779M of premiums, and MetLife's investments earned $22,559M of net investment income.
- Of every $100 that came in during FY2025, claims and benefits took $61.2 and $4.0 was left as net income for common shareholders.
03Who pays it
Who pays MetLife?
MetLife does not disclose how much each type of customer pays.
U.S. employers
Buy group life, dental and disability cover for their workers; Group Benefits had $26,881M of segment revenue in FY2025.
Pension plans and institutions
Pay MetLife to take over pension payments or to hold stable value and annuity products; RIS had $21,036M of segment revenue in FY2025.
Families and individuals abroad
Buy life, health and savings policies in Asia, Latin America and Europe and the Middle East through agents, banks and direct sales.
Institutional investors
Pay fees to MetLife Investment Management to run their money.
Where its revenue came from · FY2025
- United States71.6%
- Japan8.1%
- Other countries20.4%
How spread out the customers are
The FY2025 10-K says no single customer exceeded 10% of premiums, fees and other revenues in 2025, 2024 or 2023.
Sources (1)
04How it makes money
How does MetLife make money?
MetLife earns a margin on money it holds for policyholders and on charging premiums that cover the claims it pays.
Customers pay premiums years before claims and pensions fall due. MetLife invests that money; profit is what investment income and premiums leave after claims, interest credited and costs. Gains and losses on investments and derivatives make reported net income swing from year to year.
Net income for common shareholders per $100 of revenue
$9.7$4.1
FY2021 to FY2025
- Customers pay premiums and deposits
- MetLife invests the money in bonds and loans
- Investments earn income
- Claims, pensions and interest credited are paid
- Costs and tax are covered; the rest is profit
↺ Step 5 feeds back into step 1.
05Business segments · FY2025
Which businesses make up MetLife?
Group Benefits
37.2%Workplace life, dental and disability cover for U.S. employers.
Revenue $26.9B ($26,881M)
Retirement and Income Solutions (RIS)
29.1%Pension risk transfers, stable value funds and annuities in the U.S., and longevity reinsurance in the U.K.
Revenue $21.0B ($21,036M)
Asia
16.5%Life, accident and health, and savings products in nine markets; Japan is the largest.
Revenue $12.0B ($11,955M)
Latin America
11.5%Life, retirement and health products; Mexico and Chile are the largest markets.
Revenue $8.3B ($8,304M)
EMEA
4.4%Europe and the Middle East; the Gulf region, the U.K., Turkey and France are the largest markets.
Revenue $3.2B ($3,154M)
MetLife Investment Management (MIM)
1.3%Asset management for outside clients; its revenue includes $563M of fees from other MetLife units.
Revenue $938M
How the mix changed
- Group Benefits
- Retirement and Income Solutions (RIS)
- Asia
- Latin America
- EMEA
- MetLife Investment Management (MIM)
Revenue by segment, FY2023 to FY2025.
US$
See the numbers
Sources (1)
06The numbers · Consolidated · US$
How has MetLife done?
Premiums
$49.8BFY2025
Premiums were $49,779M in FY2025, up from $44,945M in FY2024; Q4 FY2025 alone brought $16,691M, mostly from pension risk transfer deals.
US$ · premiums from policyholders and plan members, as reported
See the yearly numbers
See the quarterly numbers
Net income
$3.2BFY2025
Net income available to common shareholders of $3,173M in FY2025 came with $22,559M of net investment income, offset in part by $1,145M of investment losses and $1,939M of derivative losses.
US$ · after claims, costs, investment results and tax; the table shows where it came from
See the numbers
See all yearly numbers
Net investment income is interest and dividends on the money the company holds before paying claims; realized and unrealized gains are shown apart because they move with markets. Net income is the amount for common stockholders. Fiscal years are the company's own (Fiscal year ends Dec 31 (the calendar year)).
- "Claims" is the 10-K line policyholder benefits and claims; "underwriting expenses" is the line other expenses, which holds commissions, running costs and interest on debt. MetLife reports no loss, expense or combined ratio.
- "Fees and other" adds universal life and investment-type policy fees and other revenues. "Realized gains" is net investment gains (losses); the "unrealized gains" column holds the 10-K line net derivative gains (losses), changes in derivative values recognized in income.
- Net income is net income available to MetLife, Inc.'s common shareholders, the figure behind diluted EPS of $4.71 in FY2025: $3,173M in FY2025 and $4,226M in FY2024. Before $194M of preferred dividends and a $12M preferred stock redemption premium, net income attributable to MetLife, Inc. was $3,379M in FY2025 ($4,426M in FY2024, before $200M of preferred dividends).
- Debt is long-term debt ($14,467M), short-term debt ($355M) and junior subordinated debt ($4,155M) at Dec 31, 2025. Debt to capital of 40.1% is a Cityfort calculation from the FY2025 10-K: debt ÷ (debt + MetLife stockholders' equity); MetLife does not report this ratio.
- FY2021 and FY2022 are as restated in the FY2023 10-K for the new long-duration insurance accounting rules (LDTI). Book value per share is per common share, as stated in the Q4 earnings releases.
Learn: How to read a US earnings release: Nvidia's Q2 fiscal 2027 · What is return on equity? Profit on equity, with real US companies · Fiscal years that don't end in December: Nvidia's FY2027 explained
Sources (10)
- Form 10-K for FY2023
- Form 10-K for FY2025
- MetLife, Inc. Q4 2024 earnings release (8-K Ex. 99.1)
- MetLife, Inc. Q4 2025 earnings release (8-K Ex. 99.1)
- MetLife, Inc. Q4 2024 quarterly financial supplement (8-K Ex. 99.2)
- MetLife, Inc. Q2 2025 quarterly financial supplement (8-K Ex. 99.2)
- MetLife, Inc. Q3 2026 quarterly financial supplement (8-K Ex. 99.2)
- Form 10-Q for Q1 FY2026
- Form 10-Q for Q2 FY2026
- Form 10-Q for Q3 FY2026
07Who runs it
Who runs MetLife, and did they deliver?
Michel A. Khalaf
President and Chief Executive Officer · since 2019
Previously President, U.S. Business (2017 to 2019).
John D. McCallion
Chief Financial Officer and Head of MetLife Investment Management · since 2018
CFO since 2018; also head of MIM since September 2023.
Marlene Debel
Chief Risk Officer and Head of MetLife Insurance Investments · since 2019
Chief Risk Officer since May 2019.
Ramy Tadros
Regional President, U.S. Business · since 2023
Also head of MetLife Holdings.
R. Glenn Hubbard
Independent Chairman of the Board · since 2019
Chairman since May 1, 2019.
What they said, and what happened
5 too early to tell
Said on Feb 4, 2026
Management set a 2026 target for the direct expense ratio (excluding notable items and pension risk transfers) of 12.1%.
Too early to tellWhat happened
The ratio was 11.9% in Q3 FY2026; the call slides said MetLife was on track to beat the target.
Said on Feb 4, 2026
Management set a near-term target of double-digit annual growth in adjusted EPS.
Too early to tellWhat happened
Adjusted EPS excluding notable items was $2.85 in Q3 FY2026, up 22% from $2.34 a year earlier.
Said on Feb 4, 2026
Management set a near-term target for adjusted return on equity of 15% to 17%.
Too early to tellWhat happened
Adjusted ROE excluding notable items was 19.6% in Q3 FY2026, according to the call slides.
Said on Feb 4, 2026
Management said it expected 2026 share buybacks in line with 2025, when it bought back about $2.9 billion.
Too early to tellWhat happened
The Q3 FY2026 slides report $2.4 billion of buybacks in 2026 through October.
Said on Feb 19, 2026
The FY2025 10-K states a goal of about $25.0 billion of free cash flowCash from operations minus spending on buildings and equipment. Learn more over 2025 to 2029.
Too early to tellWhat happened
Not yet reported.
08What could go wrong
What could go wrong for MetLife?
- Other
Interest rates move book value
Book value per share fell to $30.73 at Sep 30, 2026 from $39.52 a year earlier, as accumulated other comprehensive lossPaper gains and losses, such as on some investments or currency moves, not yet counted in profit. (gains and losses kept out of net income, such as paper losses on bonds) grew to $25,304M. The 10-Q says gross unrealized losses on bonds rose to $43.9 billion, mainly because interest rates rose.
Watch Book value per share and accumulated other comprehensive loss in each quarter's 10-Q.
- Other
Losses on investments
MetLife held $315,931M of bonds and $84,593M of mortgage loans at Dec 31, 2025; 4.0% of its rated bonds were below investment grade (the riskier rating grades). The 10-K lists defaults and downgrades of its investments as a risk.
Watch Net investment losses and the below-investment-grade share.
- Pricing
Claims can exceed estimates
Prices and reserves rest on assumptions about deaths, illness and lifespans. Its 2026 annual assumption review lowered Q3 FY2026 adjusted earnings by $46M.
Watch Group life mortality ratio in the quarterly supplement.
- Demand
Lumpy pension deals
Pension risk transfer premiums arrive in large, uneven amounts: premiums were $16,691M in Q4 FY2025 against $10,555M in Q3 FY2025.
Watch RIS premiums, fees and other revenues excluding pension risk transfers.
- Debt
Ratings drive sales
The 10-K says a downgrade, or a possible one, of its financial strength or credit ratings could cost it business and raise its cost of capital.
Watch Rating agency actions on Metropolitan Life Insurance Company.
- Concentration
Reinsurance partner exposure
MetLife had receivables of $11.9 billion related to Chariot Reinsurance, a related party, at Sep 30, 2026. Against that it had a funds withheld liability of $12.3 billion: assets MetLife keeps but owes to Chariot under the reinsurance deal.
Watch Related-party note in each 10-Q.
- Regulation
Rules and taxes
The 10-K lists changes in insurance laws, supervision and tax rules as risks that could reduce profit or make its products less attractive to buyers.
Watch Regulatory changes named in the 10-K and 10-Qs.
- Governance
Trust shares and takeovers
The 10-K says the board may influence stockholder votes through the MetLife Policyholder Trust, which held 16.17% of shares at Mar 31, 2026.
Watch The trust's share count in the yearly proxy statementThe yearly filing about shareholder votes, the board and executive pay. Learn more.
09Supporters vs. critics
What do supporters and critics point to?
What supporters point to
- Premiums rose from $44,945M in FY2024 to $49,779M in FY2025, and net investment income from $21,273M to $22,559M.
- Group Benefits adjusted earnings, excluding notable items, were $523M in Q3 FY2026 against $458M in Q3 FY2025, according to the call slides.
- Adjusted EPS excluding notable items was $2.85 in Q3 FY2026, up 22% from $2.34 a year earlier, and adjusted ROE excluding notable items was 19.6%.
- Common dividends declared rose from $2.06 a share in FY2023 to $2.248 in FY2025, and shares outstanding fell 3.7% between Dec 31, 2025 and Sep 30, 2026 (Cityfort calculation from the FY2025 10-K and Q3 FY2026 10-Q).
- Assets under management reached $741.7B at Dec 31, 2025, up from $585.7B a year earlier; the PineBridge Investments purchase closed in Q4 2025.
What critics point to
- Net income for common shareholders per $100 of revenue fell from $9.7 in FY2021 to $4.1 in FY2025, and net income available to common shareholders fell from $4,226M in FY2024 to $3,173M in FY2025.
- FY2025 net income was after $1,145M of investment losses and $1,939M of derivative losses.
- Book value per share fell to $30.73 at Sep 30, 2026 from $39.52 a year earlier, and the 10-Q reports gross unrealized losses on bonds of $43.9 billion.
- RIS adjusted earnings were $1,671M in FY2025, about level with $1,667M in FY2024, in a year of $14.2B of pension risk transfer sales.
- At Sep 30, 2026 MetLife had receivables of $11.9 billion related to Chariot Reinsurance, a related party.
10What to watch next
What should you watch next at MetLife?
Next event
Q4 and full-year FY2026 results
Date not announced yet.
Book value and bond losses
Book value per share was $30.73 at Sep 30, 2026, and accumulated other comprehensive loss was $25,304M. Each 10-Q shows the new figures.
The 2026 expense target
On Feb 4, 2026, management set a 2026 target of 12.1% for the direct expense ratio (running costs as a share of premiums, fees and other revenues). The ratio was 11.9% in Q3 FY2026. The full-year figure comes with the Q4 FY2026 results.
Pension deal timing
Pension risk transfer premiums arrive in large, uneven amounts: premiums were $16,691M in Q4 FY2025 against $10,555M in Q3 FY2025.
Chariot Re exposure
MetLife had receivables of $11.9 billion related to Chariot Reinsurance, a related party, at Sep 30, 2026; the related-party note in each 10-Q updates the figure.
11Key facts
Key facts about MetLife
- What does MetLife do?
- In the U.S., MetLife, Inc. sells workplace benefits such as group life, dental and disability cover, plus pension risk transfers and annuities. Abroad it sells life, health and savings policies in Asia, Latin America, and Europe and the Middle East. Its MetLife Investment Management arm runs money for outside investors.
- How does MetLife make money?
- MetLife collects premiums, $49,779 million in FY2025, and invests the money until claims and pensions fall due. Those investments earned $22,559 million of net investment income in FY2025, and policy fees and other revenues added $7,830 million.
- Who are MetLife's customers?
- MetLife's customers are mainly U.S. employers buying group benefits for staff (Group Benefits, 37.2% of FY2025 segment revenue), pension plans and institutions (Retirement and Income Solutions, 29.1%), and individuals in Asia, Latin America and Europe and the Middle East. The FY2025 10-K says no single customer exceeded 10% of premiums, fees and other revenues.
- How big is MetLife?
- MetLife reported total revenues of $77,084 million and net income available to common shareholders of $3,173 million in FY2025, against $70,986 million and $4,226 million in FY2024. It held $472,178 million of investments at Dec 31, 2025.
- Where does MetLife's profit come from?
- By MetLife's own adjusted earnings measure, Asia earned $1,702 million in FY2025, Group Benefits $1,692 million and Retirement and Income Solutions $1,671 million. Latin America earned $798 million, EMEA $367 million and MetLife Investment Management $200 million, while Corporate & Other lost $293 million.
- What is the difference between MetLife's net income and adjusted earnings?
- MetLife's net income available to common shareholders was $3,173 million in FY2025, or $4.71 per diluted share. Its adjusted earnings available to common shareholders, a non-GAAPThe company's own "adjusted" numbers, not the official (GAAP) ones. Always read them next to the official figure. Learn more measure that leaves out market volatility and some accounting effects, were $5,943 million, or $8.83 per share.
- Who owns MetLife?
- No single owner controls MetLife, Inc. The MetLife Policyholder Trust held 16.17% of the shares at Mar 31, 2026, and directors and executive officers as a group held 0.4% (Cityfort calculation from the 2026 proxy statement).
- Does MetLife pay dividends?
- MetLife declared common dividends of $2.248 per share in FY2025, up from $2.155 in FY2024. It also bought back 35,295,854 of its shares in FY2025.
Terms on this page
Each explains the term in plain English, with the same number from other companies on Cityfort.
Go deeper
More detail from the same filings. Open any section.
12What it sells
12What it sells
What does MetLife sell?
Workplace benefits (Group Benefits)
Life, dental, disability, accident, vision and pet cover that U.S. employers buy for their staff, sold mostly through MetLife's own employees and brokers.
Retirement and income products (RIS)
Pension risk transfers, where MetLife takes over a company's pension payments for a lump sum. It also sells stable value funds, income annuities and structured settlements in the U.S., and longevity reinsurance (cover against people living longer than expected) in the U.K.
Insurance outside the U.S.
Life, accident and health, and savings products in Asia (Japan is the largest of nine markets), Latin America (Mexico and Chile are the largest) and Europe and the Middle East.
Asset management (MIM)
MetLife Investment Management runs bond, real estate, private credit and other funds for outside institutions, and manages MetLife's own investments.
What it does
- Does: Collects premiums now and pays claims, pensions and annuities years later
- Does: Invests the money in between, mostly in bonds and mortgage loans
- Does: Manages money for outside pension funds and institutions
What it does not do
- Does not: Sell car or home insurance (it reports no property and casualty segment)
- Does not: Own Brighthouse Financial, the U.S. retail life and annuity business it spun off in 2017
- Does not: Make most of its sales outside the U.S.: the U.S. was 71.6% of premiums, fees and other revenues in FY2025
Sources (1)
13How the money flows
13How the money flows · FY2025
How does money flow through MetLife?
Money in
- Premiums$49.8B
- Net investment income$22.6B
- Policy fees$5.0B
- Other revenues$2.8B
The company
MetLife
$80.2B came in
Money out
- Claims and benefits paid to policyholders$49.1B
- Interest credited to policyholder accounts and policyholder dividends$9.5B
- Other expenses: commissions, running costs and interest on debt$13.9B
- Investment and derivative losses$3.1B
- Income tax$1.3B
- Share of outside (noncontrolling) owners$24M
- Preferred dividends and preferred stock redemption premium$206M
- Net income available to common shareholders$3.2B
- Employers, pension plans and individuals paid $49,779M of premiums in FY2025.
- MetLife invests the money it holds; those investments earned $22,559M.
- Fees on savings-type policies and other revenues added $7,830M.
- Claims, benefits and interest credited to policyholders took most of the money.
- Running costs, investment losses, tax and preferred dividends took most of the rest, leaving $3,173M of net income for common shareholders.
Sources (1)
14What it needs to run
14What it needs to run
What does MetLife need to run?
A large investment portfolio
$472,178M of investments at Dec 31, 2025; the income on it ($22,559M in FY2025) pays a large share of claims and interest owed to policyholders.
High financial strength ratings
Employers and pension plans buy promises that run for decades; the 10-K lists ratings among the factors insurers compete on.
Distribution
Its own sales staff, brokers and agents in the U.S., and agents, banks and direct channels abroad.
People
About 46,000 employees in more than 40 markets, as the 2026 proxy statement reports.
15Where it sells
15Where it sells · FY2025
Where does MetLife sell?
- United States71.6%
- Japan8.1%
- Other countries20.4%
Sources (1)
16Competitors and what protects it
16Competitors and what protects it
Who does MetLife compete with?
Prudential Financial
NYSE: PRU
Listed in MetLife's 2026 proxy statement peer groups of insurance and financial services companies.
Aflac
Listed in MetLife's 2026 proxy statement peer groups of insurance and financial services companies.
AIG
NYSE: AIG
Listed in MetLife's 2026 proxy statement peer groups of insurance and financial services companies.
Principal Financial
Listed in MetLife's 2026 proxy statement peer groups of insurance and financial services companies.
Unum
Listed in MetLife's 2026 proxy statement peer groups of insurance and financial services companies.
What protects the business
Each strength is scored 1 (weak) to 5 (strong) for the business, with the reason. It is not a rating of the share.
- Scale of investments4 of 5
$472,178M of investments at Dec 31, 2025 earned $22,559M of net investment income in FY2025.
- Financial strength ratings4 of 5
Its main U.S. insurer, Metropolitan Life Insurance Company, was rated AA- by S&P and Fitch, Aa3 by Moody's and A+ by A.M. Best at Feb 19, 2026.
- Employer relationships3 of 5
The 10-K says Group Benefits has long-standing relationships with many of the largest U.S. employers.
Weak spot
Customers can switch at renewal
The 10-K notes that many group insurance products are priced again every year, so buyers may get better terms from a rival instead of renewing.
17Where growth could come from
17Where growth could come from
Where could MetLife's growth come from?
In its Q4 FY2025 results presentation on Feb 4, 2026, management set near-term annual targets: double-digit growth in adjusted EPS, an adjusted return on equity of 15% to 17%, and a free cash flow ratio of 65% to 75% of adjusted earnings (two-year average). For 2026 it targeted a direct expense ratio of 12.1%.
Workplace benefits
Working$523M vs $458M
Group Benefits adjusted earnings, excluding notable items (items MetLife picks out and reports separately), in Q3 FY2026 versus Q3 FY2025; the call slides credit underwriting margins.
Status: Working, on track against what the company said.
Pension risk transfer
Mixed$14.2B of sales in 2025
RIS had record sales in 2025, but its adjusted earnings were $1,671M, about level with $1,667M in FY2024.
Status: Mixed, partly on track.
Asia
Working$1,702M vs $1,621M
Asia adjusted earnings in FY2025 versus FY2024.
Status: Working, on track against what the company said.
Asset management
New$741.7B of assets managed
Total assets under management at Dec 31, 2025, up from $585.7B a year earlier; the PineBridge Investments purchase closed in Q4 2025.
Status: New, recently announced.
Cost control
Working11.9% in Q3 FY2026
Direct expense ratio excluding notable items and pension risk transfers. Management said in its Feb 4, 2026 results presentation that it was aiming for 12.1% in 2026.
Status: Working, on track against what the company said.
Status compares progress with what the company itself said it would do: Working = on track against what the company said; Mixed = partly on track; Behind = behind the company's own plan; New = recently announced; Early = too early to judge.
Sources (6)
18The company's own measures (non-GAAP)
18The company's own measures · FY2025
What do MetLife's own measures show?
Official (GAAP): Net income available to common shareholders
$3.2B
Company's own measure: Adjusted earnings available to common shareholders, FY2025
$5.9B
MetLife's own headline profit measure, also used to judge its segments; the 10-K reconciles it to net income.
Official (GAAP): Diluted EPS
$4.71
Company's own measure: Adjusted EPS, FY2025
$8.83
Adjusted earnings available to common shareholders per diluted share, as stated in the Q4 FY2025 earnings release.
Official (GAAP): Return on equity
12.9%
Company's own measure: Adjusted return on equity, FY2025
15.9%
Uses adjusted earnings and equity that leaves out most accumulated other comprehensive income (AOCI), as the company defines it.
Official (GAAP): Book value per common share
$39.02
Company's own measure: Adjusted book value per share, Dec 31, 2025
$57.07
Leaves out AOCI other than foreign currency translation and certain reinsurance derivatives, under a definition used since Q4 2024.
These are the company's own measures, defined by the company. They are not comparable across companies, and they are not added together. Each sits beside the nearest official (GAAP) figure.
Learn: Non-GAAP measures: what a company's "adjusted" numbers leave out
19Financial strength: investments, debt, capital
19Financial strength · Dec 31, 2025
How strong is MetLife's balance sheet?
What the premiums are invested in
- Bonds available for sale (fixed maturity securities)$315.9B
66.9% of the investments listed
- Mortgage loans$84.6B
17.9% of the investments listed
- Other invested assets$16.3B
3.5% of the investments listed
- Limited partnership interests$14.9B
3.2% of the investments listed
- Contractholder-directed and fair value option securities$14.0B
3.0% of the investments listed
- Real estate and real estate joint ventures$13.4B
2.8% of the investments listed
- Policy loans$8.5B
1.8% of the investments listed
- Short-term investments$3.6B
0.8% of the investments listed
- Shares (equity securities)$858M
0.2% of the investments listed
Shares of the portfolio: Cityfort calculation from the FY2025 10-K, each type ÷ the total listed.
- Book value per share
- $39.02
- shareholders' equity per share at the end of FY2025, as reported
- Return on equity
- 12.9%
- net income as % of average shareholders' equity, as reported
- Investments
- $472.2B
- money held in bonds, stocks and cash until claims are paid
- Debt
- $19.0B
- borrowings on the balance sheet
- Shareholders' equity
- $28.4B
- what the company owns minus what it owes
- Debt to capital
- 40.1%
- Cityfort calculation from the FY2025 10-K: debt ÷ (debt + shareholders' equity)
The FY2025 10-K states a Statement-Based Combined risk-based capital (RBC) ratio in excess of 350% and an NAIC-Based Combined RBC ratio in excess of 370% for 2025.
Figures at Dec 31, 2025, consolidated, as reported by the company in its 10-K and earnings release; see the dates on each source.
20Who owns it
20Who owns it · ownership as of Mar 31, 2026
Who owns MetLife?
- Officers and directors (as a group), shares
- 0.4%
Share classes
Holders of 5% or more
From the company's proxy statement (DEF 14A), later Schedule 13G filings and the share counts on its latest annual or quarterly report. Each holder row shows the date of its own filing.
Learn: How to read a proxy statement (DEF 14A): Nvidia's 2026 proxy · Form 4 insider filings: who files, the codes and the footnotes
21What it does with profit
21What it does with profit
What does MetLife do with its profit?
Dividend per share
$2.25FY2025
Dividend paid for each share, by financial year.
$ per share
See the numbers
Buyback · Dec 31, 2023
Bought back 50,269,483 shares in FY2023.
$3.1B
Buyback · Dec 31, 2024
Bought back 43,955,023 shares in FY2024.
$3.2B
Buyback · Dec 31, 2025
Bought back 35,295,854 shares in FY2025.
$2.9B
Sources (1)
22Governance signals
22Governance signals
What do MetLife's governance filings show?
- Auditor
- Deloitte & Touche LLP, since 1999
- Auditor changes
- None in the period covered
- Audit qualifications
- None reported
- Related-party dealings
- In 2025 MetLife invested in Chariot Holding Company, LP and reinsured business with Chariot Reinsurance, Ltd., which the Q3 FY2026 10-Q lists as a related party. At Sep 30, 2026, receivables of $11.9 billion and a funds withheld liability of $12.3 billion related to it.
- Credit rating
- A.M. Best, Fitch, Moody's and S&P (insurer financial strength of Metropolitan Life Insurance Company, as stated in the FY2025 10-K) A+ (A.M. Best) / AA- (Fitch) / Aa3 (Moody's) / AA- (S&P) (outlook Stable, as stated in the 10-K), Feb 19, 2026
A credit rating describes the company's ability to repay debt. It is not a rating of the share.
23How it got here
23How it got here
How did MetLife get here?
1868
Milestone
Founded
MetLife traces its start to 1868, as its earnings releases state.
2000
Milestone
Listed on the NYSE
MetLife, Inc., a Delaware company formed in 1999, began trading as MET on Apr 5, 2000.
2017
Business-model change
Brighthouse spun off
MetLife, Inc. completed the separation of Brighthouse Financial on Aug 4, 2017 by distributing Brighthouse Financial, Inc. shares to its common shareholders.
2019
Milestone
New CEO and strategy
Michel Khalaf became CEO in May 2019, the year of the Next Horizon strategy.
2025
Business-model change
New Frontier and PineBridge
MetLife began its New Frontier strategy, bought PineBridge Investments for a preliminary $885M and made asset management a reported segment.
2025
Business-model change
Old blocks reinsured
It reinsured (passed on to other insurers) blocks of older business with Chariot Re and Talcott, moving $10 billion of U.S. variable annuity reserves to Talcott.
24Sources and changes
Where every number on this page comes from
Sources (24 documents)
- S1Form 10-Q for Q3 FY2026 · SEC EDGAR · Tier 1: company or exchange filing · Nov 6, 2026
- S2Form 10-Q for Q2 FY2026 · SEC EDGAR · Tier 1: company or exchange filing · Aug 6, 2026
- S3Form 10-Q for Q1 FY2026 · SEC EDGAR · Tier 1: company or exchange filing · May 7, 2026
- S4Form 10-K for FY2025 · SEC EDGAR · Tier 1: company or exchange filing · Feb 19, 2026
- S5Form 10-Q for Q3 FY2025 · SEC EDGAR · Tier 1: company or exchange filing · Nov 7, 2025
- S6Form 10-Q for Q2 FY2025 · SEC EDGAR · Tier 1: company or exchange filing · Aug 7, 2025
- S7Form 10-Q for Q1 FY2025 · SEC EDGAR · Tier 1: company or exchange filing · May 1, 2025
- S8Form 10-K for FY2024 · SEC EDGAR · Tier 1: company or exchange filing · Feb 21, 2025
- S9Form 10-Q for Q3 FY2024 · SEC EDGAR · Tier 1: company or exchange filing · Nov 1, 2024
- S10Form 10-Q for Q2 FY2024 · SEC EDGAR · Tier 1: company or exchange filing · Aug 1, 2024
- S11Form 10-Q for Q1 FY2024 · SEC EDGAR · Tier 1: company or exchange filing · May 2, 2024
- S12Form 10-K for FY2023 · SEC EDGAR · Tier 1: company or exchange filing · Feb 16, 2024
- S13Form 10-K for FY2022 · SEC EDGAR · Tier 1: company or exchange filing · Feb 23, 2023
- S14Form 10-K for FY2021 · SEC EDGAR · Tier 1: company or exchange filing · Feb 18, 2022
- S15MetLife, Inc. 2026 proxy statement (DEF 14A) · SEC EDGAR · Tier 1: company or exchange filing · Apr 29, 2026
- S16MetLife, Inc. Q3 2026 earnings release (8-K Ex. 99.1) · SEC EDGAR · Tier 1: company or exchange filing · Nov 4, 2026
- S17MetLife, Inc. Q3 2026 quarterly financial supplement (8-K Ex. 99.2) · SEC EDGAR · Tier 1: company or exchange filing · Nov 4, 2026
- S18MetLife, Inc. Q4 2025 earnings release (8-K Ex. 99.1) · SEC EDGAR · Tier 1: company or exchange filing · Feb 4, 2026
- S19MetLife, Inc. Q4 2025 quarterly financial supplement (8-K Ex. 99.2) · SEC EDGAR · Tier 1: company or exchange filing · Feb 4, 2026
- S20MetLife, Inc. Q4 2024 earnings release (8-K Ex. 99.1) · SEC EDGAR · Tier 1: company or exchange filing · Feb 5, 2025
- S21MetLife, Inc. Q4 2024 quarterly financial supplement (8-K Ex. 99.2) · SEC EDGAR · Tier 1: company or exchange filing · Feb 5, 2025
- S22MetLife, Inc. Q2 2025 quarterly financial supplement (8-K Ex. 99.2) · SEC EDGAR · Tier 1: company or exchange filing · Aug 6, 2025
- S23MetLife, Inc. Q3 2026 earnings call presentation (8-K Ex. 99.4) · SEC EDGAR · Tier 1: company or exchange filing · Nov 4, 2026
- S24MetLife, Inc. Q4 2025 earnings call presentation (8-K Ex. 99.4) · SEC EDGAR · Tier 1: company or exchange filing · Feb 4, 2026
Changes to this page (v1 · Nov 20, 2026)
- v1 · Nov 20, 2026First version. (first version)
Numbers come only from tier 1 and tier 2 sources. Read how we research.
Disclaimer
For learning only. Cityfort is not a registered investment adviser or broker-dealer and does not recommend buying or selling any security. Prices shown are dated and may be out of date.
Investing in securities involves risk, including loss of capital. Before making any investment decision, do your own research and consider consulting a registered investment adviser or other qualified professional.
Cityfort, its owners and contributors may or may not hold securities of companies covered. Cityfort is not paid by any company it covers. Content is not an offer or solicitation to buy or sell any security, including in any initial public offering.
Read the positions policyRead the full disclaimerHide the full disclaimer
Cityfort publishes general educational content that explains how listed companies work. Cityfort is not registered with the US Securities and Exchange Commission or any state securities regulator as an investment adviser, and is not a broker-dealer or a member of FINRA. Cityfort does not provide investment, tax or legal advice, recommendations, ratings, price targets or any opinion on whether to buy, sell or hold any security. Nothing on the site is tailored to any person's circumstances.
All information is taken from publicly available sources, mainly company filings with the SEC, which are listed on each page with dates. We work to keep it accurate and correct errors publicly, but we do not guarantee that it is complete, accurate or up to date. Any market price or price-based ratio shown is dated, may be out of date by the time you read it, and is included only to explain concepts.
Statements by company management, including forward-looking statements and guidance, are reported as the company's statements, with their date and source; they are not our forecasts. Adjusted (non-GAAP) figures are the company's own measures and are shown next to the official (GAAP) figures.