Consumer Discretionary · NYSE: BBY
Best Buy: how the business works
Best Buy sells computers, phones, TVs and appliances, plus installation, repair and memberships, through 1,068 stores and online in the US and Canada, with revenue of $41.7 billion in FY2026 (February 2025 to January 2026).
By Hardik Bhandare · Checked against filings: . Editorial policy. Corrections
Follow Best Buy
Email me when Best Buy's page is updated after earnings.
We'll send a confirmation email first. See our privacy policy.
Best Buy Co., Inc. · Richfield, Minnesota · Founded 1966
Updated for Q2 FY2027 · checked
- Revenue, FY2026 (ended Jan 31, 2026)
- $41.7B
- Operating income, FY2026
- $1.39B
- Net income, FY2026
- $1.07B
- Stores, Aug 1, 2026
- 1,068
- Employees, Jan 31, 2026
- ~82,000
The short version
Best Buy in 5 points
1 · What it sells
Best Buy sells computers, phones, TVs, appliances and games, plus installation, repair and memberships, through 1,068 stores and online in the US and Canada, with revenue of $41.7 billion in FY2026 (February 2025 to January 2026).
2 · Who pays it
Best Buy's filings give no split by type of customer; by segment, shoppers in the US paid 91.8% of FY2026 revenue and shoppers in Canada 8.2%.
3 · What it keeps from $100
Of every $100 that came in during FY2026, Best Buy kept $2.6 as net income, after $0.9 of restructuring, impairment and disposal charges; operating income per $100 of revenue was $3.3.
4 · Where the operating profit comes from
In FY2026, Domestic (the US) earned $1,670 million of segment operating income, 93.6% of the total, and International (Canada) $115 million, or 6.4%, before $396 million of restructuring, impairment and amortization charges.
5 · The one thing to watch
In Q2 FY2027 (May 3 to Aug 1, 2026), comparable sales rose 4.1% and gross margin was 23.9%, including about $34 million of tariff refunds, against 23.2% a year earlier.
Sources: From Best Buy's FY2026 10-K, its Q2 FY2027 earnings release and 10-Q, and its Mar 3, 2026 earnings call · checked
See the full receipt and the management scorecard below
01Where the money goes · FY2026 (February 2025 to January 2026)
Where does $100 of Best Buy's money go?
Best Buy · FY2026 (February 2025 to January 2026)
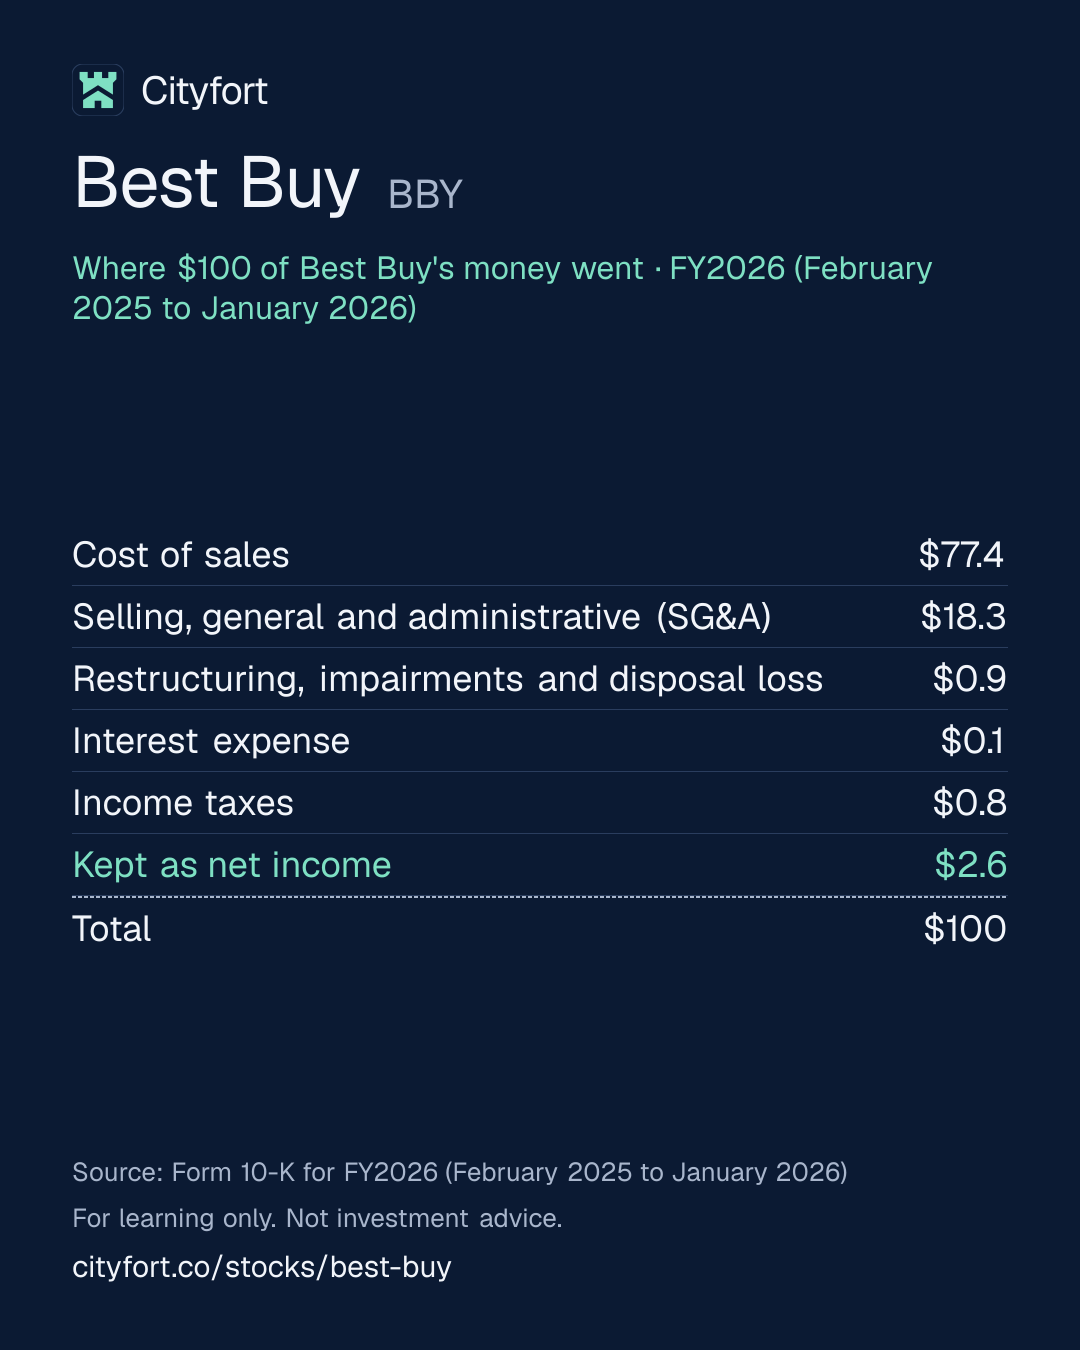
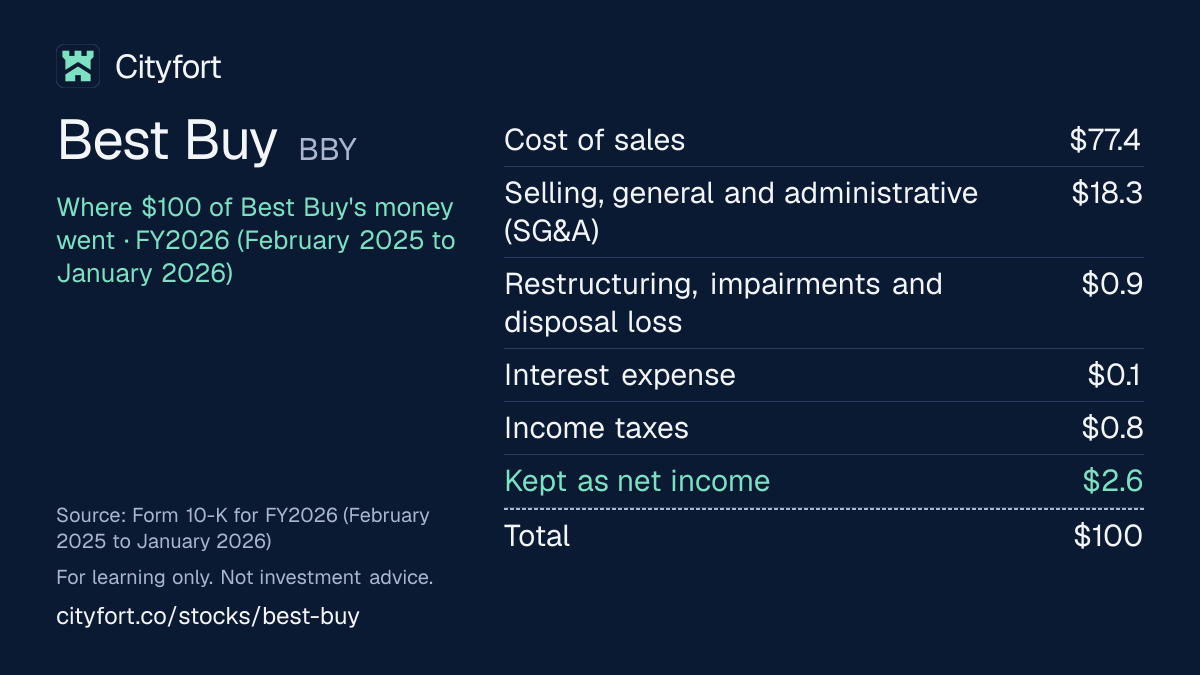
Receipt for every $100
| Cost of sales | $77.4 |
|---|---|
| Selling, general and administrative (SG&A) | $18.3 |
| Restructuring, impairments and disposal loss | $0.9 |
| Interest expense | $0.1 |
| Income taxes | $0.8 |
| Kept as net income | $2.6 |
| Total | $100 |
Each line = amount ÷ total money in × 100. Lines may not add to exactly $100 because of rounding.
How this is worked out
Cityfort calculation from FY2026 10-K. Of every $100 that came in during FY2026 (revenue plus $70 million of investment income, other income and income from affiliates): each line = line ÷ $41.76 billion × 100. The $0.9 line holds $190 million of restructuring, a $171 million Best Buy Health impairment and a $6 million disposal loss.
Save this receipt as an image:
1080 × 1350 PNG for Instagram, LinkedIn1200 × 675 PNG for X
Embed this receipt
Paste this code into a blog or website to show the receipt, with a link back to this page:
Each week: one company explained in 5 points, picked by earnings date.
Free, no tips, unsubscribe anytime.
We'll send a confirmation email. See our privacy policy.
02The business in one line
What does Best Buy do?
Shoppers in the US and Canada pay Best Buy for tech products and services; $77.4 of every $100 that came in during FY2026 went on cost of sales, and $2.6 was left as net income.
- FY2026 ran from February 2025 to January 2026 (it ended Jan 31, 2026). Best Buy names each year after the calendar year it ends in.
- Revenue was $41.7 billion in FY2026, down from $51.8 billion in FY2022. Comparable sales rose 4.1% in Q2 FY2027.
03Who pays it
Who pays Best Buy?
Shoppers in the US (Domestic segment)
92%
of revenue
People and businesses buying in 926 US stores and online: 91.8% of FY2026 revenue ($38.3 billion). Online sales were $13.2 billion, 34.4% of Domestic revenue. Best Buy Health is in this segment.
Shoppers in Canada (International segment)
8%
of revenue
142 stores in Canada at Jan 31, 2026, including 12 stand-alone Best Buy Mobile stores: 8.2% of FY2026 revenue ($3.4 billion).
Brands that buy advertising (Best Buy Ads)
Not disclosed
Management said on Mar 3, 2026 that gross advertising collections were just over $900 million in FY2026. They mostly reduce cost of goods sold, with a small part in revenue, so they have no share of revenue here.
Third-party sellers (Best Buy Marketplace)
Not disclosed
Sellers list goods on Best Buy's websites and pay commissions, which sit inside Services revenue above. The US marketplace launched in August 2025, and Canada already had one.
- Shoppers in the US (Domestic segment)92%
- Shoppers in Canada (International segment)8%
How spread out the customers are
Best Buy's filings do not split revenue by type of customer. The concentration is on the supply side: its 20 largest suppliers were about 80% of FY2026 merchandise purchases, and Apple, Samsung, HP, LG and Sony about 55%.
04Why it makes money
Why does Best Buy make money?
Best Buy keeps about $22.5 of each $100 of sales after product costs, and stores and staff take most of that, so small sales changes move profit a lot.
Gross margin, the share left after cost of sales, barely moved: 22.4% in FY2021 and 22.5% in FY2026. Revenue fell 19.5% from FY2022 to FY2026, but SG&A fell only 11.7%, from $8.6 billion to $7.6 billion. So operating income per $100 of revenue fell from $5.9 in FY2022 to $3.3.
Operating income per $100 of revenue
$5.1$3.3
FY2021 to FY2026
- Shoppers buy laptops, phones, TVs and appliances in 1,068 stores and online
- Best Buy buys most of them from five brands, which supply about 55% of its purchases
- $22.5 of each $100 of FY2026 revenue was left after cost of sales
- Services, memberships, advertising and marketplace commissions add to that gross profit
- SG&A takes $18.3 of each $100, leaving $3.3 of operating income
- Cash goes to dividends and buybacks: $1,074 million in FY2026
↺ Step 6 feeds back into step 1.
05Business segments · FY2026 (February 2025 to January 2026)
Which businesses make up Best Buy?
Domestic
92%All US operations, including Best Buy Health: 91.8% of revenue. Segment operating income was $1,670 million, 93.6% of the segment total, or $4.4 per $100 of its revenue. Comparable sales rose 0.4%.
Revenue $38.3B · Operating profit $1.7B
International
8%Canada: 8.2% of revenue. Segment operating income was $115 million, 6.4% of the segment total, or $3.4 per $100 of its revenue. Comparable sales rose 2.3%.
Revenue $3.4B · Operating profit $115M
How the mix changed
- Domestic
- International
Revenue by segment, FY2024 to FY2026.
US$
See the numbers
06The numbers · Consolidated · US$
How has Best Buy done?
Revenue
$41.7BFY2026
Revenue fell from $51.8 billion in FY2022 to $41.5 billion in FY2025, was $41.7 billion in FY2026 (February 2025 to January 2026), and rose 3.6% in Q2 FY2027.
US$
See the numbers
Net profit
$1.1BFY2026
Net income fell from $2.5 billion in FY2022 to $927 million in FY2025, which carried a $475 million Best Buy Health goodwill impairment, and was $1.07 billion in FY2026.
US$
See the numbers
Profit kept per $100 of revenue
$2.6FY2026
Net income per $100 of revenue fell from $4.7 in FY2022 to $2.6 in FY2026, while operating income per $100 fell from $5.9 to $3.3.
$ of profit per $100 of revenue (net margin)
See the numbers
Free cash flow
$1.3BFY2026
Cash from operations minus spending on property and equipment, Cityfort calculation from FY2023 10-K and FY2026 10-K, fell from $4.2 billion in FY2021 to $1.26 billion in FY2026.
US$ · cash from operations minus spending on plants and equipment
See the numbers
See all yearly numbers
EBITDA here = operating income plus depreciation and amortization (from the cash flow statement). Fiscal years are the company's own (Saturday nearest the end of January. Best Buy names each fiscal year after the calendar year it ends in: FY2026 ran from Feb 2, 2025 to Jan 31, 2026, and Q2 FY2027 from May 3 to Aug 1, 2026. FY2024 had 53 weeks; the extra week added about $675 million of US and $60 million of Canadian revenue.). Net profit is the share belonging to the company's owners.
Download Best Buy's yearly and quarterly numbers (CSV, with source ids)
Learn: Fiscal years that don't end in December: Nvidia's FY2027 explained · Stock-based compensation and dilution: pay that becomes shares
Sources (14)
- Form 10-K for fiscal 2023 (year ended Jan 28, 2023)
- Form 10-K for fiscal 2024 (53 weeks, year ended Feb 3, 2024)
- Form 10-K for fiscal 2026 (year ended Jan 31, 2026)
- Q3 fiscal 2025 results release (Form 8-K, Exhibit 99)
- Q4 and fiscal 2025 results release (Form 8-K, Exhibit 99)
- Q1 fiscal 2026 results release (Form 8-K, Exhibit 99)
- Q2 fiscal 2026 results release (Form 8-K, Exhibit 99)
- Q3 fiscal 2026 results release (Form 8-K, Exhibit 99)
- Form 10-Q for Q3 fiscal 2026 (quarter ended Nov 1, 2025)
- Q4 and fiscal 2026 results release (Form 8-K, Exhibit 99)
- Q1 fiscal 2027 results release (Form 8-K, Exhibit 99.1)
- Form 10-Q for Q1 fiscal 2027 (quarter ended May 2, 2026)
- Q2 fiscal 2027 results release (Form 8-K, Exhibit 99)
- Form 10-Q for Q2 fiscal 2027 (quarter ended Aug 1, 2026)
07Who runs it
Who runs Best Buy, and did they deliver?
Jason Bonfig
Chief Executive Officer and director · since 2026
Took over as CEO on Nov 1, 2026, under the succession plan announced on Apr 22, 2026, and joined the Board then. He joined Best Buy in 1999 as an inventory analyst and led the US Marketplace launch and the scaling of Best Buy Ads.
Corie Barry
Former Chief Executive Officer; strategic advisor · since 2019
CEO from June 2019, after serving as CFO. Under the April 2026 plan she stepped down as CEO and director on Oct 31, 2026, and stays as a strategic advisor for six months.
Anne Bramman
Executive Vice President and Chief Financial Officer · since 2026
CFO from Aug 19, 2026, after Matt Bilunas left on Jul 31, 2026. She was previously chief financial and growth officer of Circana and CFO of Nordstrom.
David Kenny
Chair of the Board
Named as Board chair in the Apr 22, 2026 CEO succession release.
Richard M. Schulze
Founder and Chairman Emeritus
Not an executive and not on the Board. He held 6.1% of shares after sales on May 29, 2026.
What they said, and what happened
3 delivered · 4 too early to tell
Said on Mar 4, 2025
Best Buy guided on Mar 4, 2025 to FY2026 revenue of $41.4 billion to $42.2 billion, comparable sales growth of 0.0% to 2.0%, an adjusted operating income rate of 4.2% to 4.4% and adjusted diluted EPS of $6.20 to $6.60.
DeliveredWhat happened
Revenue was $41.7 billion, comparable sales rose 0.5%, the adjusted operating income rate was 4.3% and adjusted diluted EPS was $6.43. On May 29, 2025 Best Buy had cut the comparable sales range to -1% to +1%, citing tariffs.
Said on Nov 25, 2025
Best Buy guided on Nov 25, 2025 to FY2026 revenue of $41.65 billion to $41.95 billion and adjusted diluted EPS of $6.25 to $6.35.
DeliveredWhat happened
Revenue was $41.69 billion, inside the range, and adjusted diluted EPS was $6.43, above it.
Said on Mar 3, 2026
Best Buy guided on Mar 3, 2026 to Q1 FY2027 comparable sales growth of about 1% and an adjusted operating income rate of about 3.9%.
DeliveredWhat happened
Comparable sales rose 2.0% and the adjusted operating income rate was 4.1%.
Said on Mar 3, 2026
Management said on Mar 3, 2026 that it expects Best Buy Ads gross advertising collections to grow about 10% in FY2027.
Too early to tellWhat happened
Management said on Aug 27, 2026 that Ads was on track for 10% growth this year. Best Buy does not report Ads revenue.
Said on May 28, 2026
Management said on May 28, 2026 that it expects at least $1.2 billion of US Marketplace merchandise value in FY2027.
Too early to tellWhat happened
On Aug 27, 2026 management put Q2 FY2027 at about $300 million and said it now expects $1.3 billion for the year.
Said on Aug 27, 2026
Best Buy guided on Aug 27, 2026 to FY2027 revenue of $42.3 billion to $42.8 billion and comparable sales growth of 1.9% to 3.0%.
Too early to tellWhat happened
First-half revenue was $18.7 billion, up 2.8% from $18.2 billion a year earlier. Q3 FY2027 results were not out when this page was written.
Said on Aug 27, 2026
Management said on Aug 27, 2026 that it expects about 9 million paid members by the end of FY2027, from just over 8 million in February.
Too early to tellWhat happened
Best Buy gives member counts only on earnings calls.
Sources (17)
- 8-K: CEO succession, Jason Bonfig to succeed Corie Barry (Exhibit 99.1)
- Q2 fiscal 2027 results release (Form 8-K, Exhibit 99)
- Form 10-K for fiscal 2026 (year ended Jan 31, 2026)
- 8-K: CFO Matt Bilunas to step down (Exhibit 99.1)
- 8-K: Anne Bramman appointed CFO (Exhibit 99.1)
- 2026 proxy statement (DEF 14A)
- Schedule 13D/A No. 15, Richard M. Schulze (event May 29, 2026)
- Q4 and fiscal 2025 results release (Form 8-K, Exhibit 99)
- Q4 and fiscal 2026 results release (Form 8-K, Exhibit 99)
- Q1 fiscal 2026 results release (Form 8-K, Exhibit 99)
- Q3 fiscal 2026 results release (Form 8-K, Exhibit 99)
- Q1 fiscal 2027 results release (Form 8-K, Exhibit 99.1)
- Q4 fiscal 2026 earnings call transcript (Mar 3, 2026)
- Q2 fiscal 2027 earnings call transcript (Aug 27, 2026)
- Q1 fiscal 2027 earnings call transcript (May 28, 2026)
- Q2 fiscal 2026 results release (Form 8-K, Exhibit 99)
- EDGAR filing index, Best Buy Co., Inc. (CIK 0000764478)
08What could go wrong
What could go wrong for Best Buy?
- Concentration
Five suppliers, about 55% of purchases
Best Buy's 20 largest suppliers were about 80% of FY2026 merchandise purchases, and Apple, Samsung, HP, LG and Sony about 55%. The 10-K says it generally has no long-term contracts requiring them to keep supplying it.
Watch Supplier shares in each 10-K, and any change in terms with the largest brands.
- Regulation
Tariffs on imported electronics
Best Buy directly imports only about 1% to 3% of its assortment, but its 10-K says vendors rely heavily on imports from China, Mexico and Southeast Asia, so results are highly sensitive to tariffs. Q2 FY2027 gross profit includes about $34 million of tariff refunds.
Watch Gross margin, and any tariff refunds named in each release.
- Demand
Demand for gadgets goes in cycles
Revenue fell three years in a row, from $51.8 billion in FY2022 to $41.5 billion in FY2025, then was $41.7 billion in FY2026. Comparable sales fell 9.9% in FY2023 and 6.8% in FY2024.
Watch Comparable sales by category each quarter.
- Competition
Price competition on thin margins
The 10-K says some rivals have lower cost structures and compete mainly on price, and Best Buy matches prices from certain stores and online sellers. Operating income was $3.3 per $100 of revenue in FY2026.
Watch Gross margin and operating margin each quarter.
- Demand
Dependence on the holiday quarter
Q4 brought $13.8 billion, or 33.1%, of FY2026 revenue. Operating cash flow was negative in Q3 of both FY2025 and FY2026, as inventory was built before the holidays.
Watch Q4 FY2027 revenue and comparable sales against Q4 FY2026.
- Execution
New ventures and write-downs
Best Buy wrote down $475 million of Best Buy Health goodwill in FY2025 and $171 million of goodwill and intangibles in FY2026, after a change in that unit's customer base, and exited part of it. The 10-K says new strategies such as Ads and Marketplace carry uncertainty and could lead to impairments.
Watch Best Buy Health goodwill, $298 million at Jan 31, 2026, and Ads and Marketplace updates.
- Execution
New CEO and CFO in the same year
Anne Bramman became CFO on Aug 19, 2026, and Jason Bonfig became CEO on Nov 1, 2026, following Corie Barry's seven years as CEO.
Watch Strategy and guidance in the first results under the new CEO.
- Debt
Store leases larger than debt
Operating lease liabilities were $2,964 million at Aug 1, 2026, against $1,169 million of debt. Operating lease obligations at Jan 31, 2026 were $3,347 million, with $739 million due within a year.
Watch Lease liabilities and store count in each 10-Q.
Sources (11)
- Form 10-K for fiscal 2026 (year ended Jan 31, 2026)
- Form 10-Q for Q2 fiscal 2027 (quarter ended Aug 1, 2026)
- Q2 fiscal 2027 results release (Form 8-K, Exhibit 99)
- Form 10-K for fiscal 2024 (53 weeks, year ended Feb 3, 2024)
- Q4 and fiscal 2026 results release (Form 8-K, Exhibit 99)
- Q3 fiscal 2026 results release (Form 8-K, Exhibit 99)
- Q3 fiscal 2025 results release (Form 8-K, Exhibit 99)
- Form 10-K for fiscal 2025 (year ended Feb 1, 2025)
- Form 10-Q for Q3 fiscal 2026 (quarter ended Nov 1, 2025)
- 8-K: CEO succession, Jason Bonfig to succeed Corie Barry (Exhibit 99.1)
- 8-K: Anne Bramman appointed CFO (Exhibit 99.1)
09Both sides
What do supporters and critics point to?
What supporters point to
- Comparable sales rose 2.0% in Q1 FY2027 and 4.1% in Q2 FY2027, and Computing and Mobile Phones comparable sales rose 6.8% in Q2.
- Cash was $2,255 million and debt $1,169 million at Aug 1, 2026, and the 10-K states BBB+ (S&P) and A3 (Moody's) ratings.
- The dividend per share rose every year from $2.20 in FY2021 to $3.80 in FY2026, and is $0.96 a quarter in FY2027.
- Management said on Mar 3, 2026 that Best Buy Ads gross collections were just over $900 million in FY2026, up more than 7%.
- Best Buy raised its FY2027 revenue and comparable sales guidance on Aug 27, 2026.
What critics point to
- Revenue was $41.7 billion in FY2026, against $51.8 billion in FY2022.
- Net income per $100 of revenue was $2.6 in FY2026, against $4.7 in FY2022.
- Apple, Samsung, HP, LG and Sony supplied about 55% of FY2026 merchandise purchases.
- Best Buy Health led to impairments of $475 million in FY2025 and $171 million in FY2026.
- Q2 FY2027 gross margin of 23.9% includes about $34 million of tariff refunds, and Entertainment comparable sales fell 6.3%.
10What to watch next
What should you watch next at Best Buy?
Next event
Q3 FY2027 results
Date not announced yet.
The holiday quarter
Q4 brought $13.8 billion, or 33.1%, of FY2026 revenue. Best Buy guided on Aug 27, 2026 to Q3 FY2027 comparable sales growth of 1.0% to 3.0%.
Tariff refunds in margins
Q2 FY2027 gross margin was 23.9%, including about $34 million of tariff refunds, against 23.2% a year earlier. Best Buy says a further $41 million received on Sep 2, 2026 will be recorded in Q3 FY2027.
New CEO and newer revenue streams
Jason Bonfig became CEO on Nov 1, 2026. Management said on Aug 27, 2026 it expects about $1.3 billion of US Marketplace merchandise value and about 10% growth in Ads collections in FY2027.
11Key facts
Key facts about Best Buy
- What does Best Buy do?
- Best Buy Co., Inc. sells computers, phones, TVs, appliances and games, plus installation, repair, tech support and memberships, in the US and Canada. It had 1,068 stores on Aug 1, 2026. Revenue was $41.7 billion in FY2026 (February 2025 to January 2026), and online sales were 34.4% of US revenue.
- How does Best Buy make money?
- Best Buy's business model is buying products from brands such as Apple, Samsung, HP, LG and Sony and reselling them, plus fees for services. In FY2026 (February 2025 to January 2026), cost of sales took $32.3 billion of its $41.7 billion of revenue, a gross margin of 22.5%. Services, which include memberships, repair, advertising and marketplace commissions, were $3.21 billion of US revenue on the May 2026 recast basis.
- Is Best Buy profitable?
- Yes. Best Buy's net income was $1.07 billion in FY2026 (February 2025 to January 2026), or $2.6 per $100 of revenue, after $361 million of restructuring and impairment charges. Operating income was $1.39 billion. In Q2 FY2027 (May 3 to Aug 1, 2026), net income was $315 million, up from $186 million a year earlier.
- What is Best Buy's revenue by segment?
- Best Buy reports two segments. In FY2026 (February 2025 to January 2026), Domestic (the US, including Best Buy Health) had revenue of $38.3 billion, or 91.8%, and International (Canada) had $3.4 billion, or 8.2%. Domestic earned $1,670 million of segment operating income and International $115 million, measured before restructuring, impairment and amortization charges.
- Who owns Best Buy?
- Best Buy has one class of common stock, with one vote per share and 209.7 million shares on Sep 2, 2026. Its 18 directors and executive officers together beneficially owned 0.50% on Mar 30, 2026, including options and restricted stock units. Filings show BlackRock with 11.08% (Dec 31, 2023 data, as used in the 2026 proxy), Vanguard Capital Management with 7.06% (Mar 31, 2026), State Street with 6.69% (Dec 31, 2024 data) and founder Richard M. Schulze with 6.1% (May 29, 2026).
- How much do computers and phones bring Best Buy?
- Best Buy's Computing and Mobile Phones category, which covers laptops, desktops, phones, tablets, networking and wearables, had US revenue of $17.8 billion in FY2026 (February 2025 to January 2026), on the May 2026 recast basis. That was 46.5% of Domestic revenue, up from $16.9 billion in FY2025.
- How much do TVs and other consumer electronics bring Best Buy?
- Best Buy's Consumer Electronics category, which covers TVs, home theater, headphones, speakers, cameras and smart home products, had US revenue of $10.4 billion in FY2026 (February 2025 to January 2026), on the May 2026 recast basis. That was 27.2% of Domestic revenue, down from $11.1 billion in FY2025.
- How much do appliances bring Best Buy?
- Best Buy's Appliances category, which covers refrigerators, laundry, ovens, dishwashers and small appliances such as vacuums and coffee makers, had US revenue of $4.1 billion in FY2026 (February 2025 to January 2026), on the May 2026 recast basis. That was 10.6% of Domestic revenue, down from $4.5 billion in FY2025.
- How much do services bring Best Buy?
- Best Buy's Services category, which covers advertising, delivery, installation, marketplace commissions, memberships, repair, tech support and warranty-related services, had US revenue of $3.21 billion in FY2026 (February 2025 to January 2026), on the May 2026 recast basis. That was 8.4% of Domestic revenue, against $3.17 billion in FY2025. Before the recast moved credit card and digital content revenue into Services, FY2026 Services were $2.47 billion.
- How much does gaming and entertainment bring Best Buy?
- Best Buy's Entertainment category, which covers gaming hardware and software, drones, toys and virtual reality, had US revenue of $2.6 billion in FY2026 (February 2025 to January 2026), on the May 2026 recast basis. That was 6.7% of Domestic revenue, up from $2.4 billion in FY2025. In Q2 FY2027, Entertainment comparable sales fell 6.3%.
Sources (7)
- Form 10-K for fiscal 2026 (year ended Jan 31, 2026)
- Form 10-Q for Q2 fiscal 2027 (quarter ended Aug 1, 2026)
- Revenue category reclassification, recast FY2025-FY2026 (Form 8-K, Exhibit 99.2)
- Q2 fiscal 2027 results release (Form 8-K, Exhibit 99)
- 2026 proxy statement (DEF 14A)
- Schedule 13G, Vanguard Capital Management (event Mar 31, 2026)
- Schedule 13D/A No. 15, Richard M. Schulze (event May 29, 2026)
Terms on this page
- Capital expenditures (capex)
- Debt-to-equity
- Earnings per share (EPS)
- EBITDA
- Free cash flow
- Market cap
- Net debt
- Net margin
- Operating income
- Operating margin
Each explains the term in plain English, with the same number from other companies on Cityfort.
Go deeper
More detail from the same filings. Open any section.
12What it sells
12What it sells
What does Best Buy sell?
Computing and Mobile Phones ($17.8B in FY2026, US)
Laptops, desktops, phones (including carrier commissions), tablets, networking and smartwatches. 46.5% of Domestic revenue.
Consumer Electronics ($10.4B)
TVs, soundbars and home theater, headphones and speakers, cameras, fitness gadgets and smart home products. 27.2% of Domestic revenue.
Appliances ($4.1B)
Large appliances such as refrigerators, washers and ovens, and small ones such as blenders and vacuums. 10.6% of Domestic revenue.
Services ($3.21B)
Geek Squad repair, set-up and tech support, delivery, installation, memberships, warranty-related services, advertising and marketplace commissions. 8.4% of Domestic revenue.
Entertainment ($2.6B)
Gaming consoles, games and accessories, drones, toys and virtual reality. 6.7% of Domestic revenue.
Canada ($3.4B)
The same six categories in 142 Canadian stores and online, reported as the International segment. Computing and Mobile Phones were $1.65 billion of it.
What it does
- Does: Resells brands such as Apple, Samsung, HP, LG and Sony, plus its own brands such as Insignia, Rocketfish and Best Buy Essentials
- Does: Delivers, installs and repairs products, including through Geek Squad, and sells paid memberships
- Does: Sells advertising to brands (Best Buy Ads) and lets third-party sellers list on its websites for a commission (Best Buy Marketplace)
What it does not do
- Does not: Does not make most of what it sells: it directly imports only about 1% to 3% of its assortment
- Does not: Does not count most advertising money as revenue: management said on Mar 3, 2026 that it mostly reduces cost of goods sold
- Does not: Does not split revenue by type of customer in its filings
13How the money flows
13How the money flows · FY2026 (February 2025 to January 2026)
How does money flow through Best Buy?
Money in
- Revenue$41.7B
- Investment income and other, plus income from affiliates$70M
The company
Best Buy
$41.8B came in
Money out
- Cost of sales$32.3B
- Selling, general and administrative (SG&A)$7.6B
- Restructuring, impairments and disposal loss$367M
- Interest expense$47M
- Income taxes$337M
- Net income$1.1B
- Customers paid Best Buy $41.7 billion of revenue in FY2026 (February 2025 to January 2026), mostly for products.
- Buying those products and delivering services took $32.3 billion of cost of sales, leaving $9.4 billion of gross profit.
- Stores, staff, advertising and other running costs (SG&A) took $7.6 billion.
- Restructuring of $190 million and a $171 million Best Buy Health impairment left $1.39 billion of operating income.
- After $47 million of interest, $70 million of investment and other income, a $6 million disposal loss and $337 million of tax, $1.07 billion was net income.
14What it needs to run
14What it needs to run
What does Best Buy need to run?
Stores
1,068 stores at Aug 1, 2026 (926 in the US, 142 in Canada), down from 1,105 a year earlier and 1,159 at the end of FY2021. Stores also serve as pickup points and ship online orders.
Suppliers
The 20 largest suppliers were about 80% of FY2026 merchandise purchases, and Apple, Samsung, HP, LG and Sony about 55%. Best Buy generally has no long-term contracts that require them to keep supplying it.
Inventory
$6.30 billion of merchandise at Aug 1, 2026, up from $5.82 billion a year earlier. It peaks before the holidays: $7.99 billion at Nov 1, 2025.
People
About 82,000 employees in the US and Canada at the end of FY2026, down from more than 90,000 at the end of FY2023.
Technology and supply chain
Capital spending was $704 million in FY2026: $463 million on e-commerce and IT, $200 million on store projects and $41 million on supply chain.
15Where growth could come from
15Where growth could come from
Where could Best Buy's growth come from?
Best Buy raised its FY2027 guidance (February 2026 to January 2027) on Aug 27, 2026. It expects revenue of $42.3 billion to $42.8 billion and comparable sales growth of 1.9% to 3.0%. It expects an adjusted operating income rate of 4.4% to 4.5% and adjusted diluted EPS of $6.70 to $6.90, both company measures. For Q3 FY2027 it expects comparable sales growth of 1.0% to 3.0%.
Best Buy Ads
WorkingJust over $900M gross collections, FY2026
Management said on Mar 3, 2026 that gross advertising collections rose more than 7% in FY2026, with 750 advertising partners. It expects about 10% growth in FY2027 and said on Aug 27, 2026 it was on track. Best Buy reports no Ads revenue or profit.
Status: Working, on track against what the company said.
US Marketplace
NewAbout $300M of goods sold, Q2 FY2027
Third-party sellers have listed on Best Buy's US websites since August 2025, and Best Buy earns commissions. Management said on Aug 27, 2026 it now expects about $1.3 billion of marketplace merchandise value in FY2027, up from at least $1.2 billion said on May 28.
Status: New, recently announced.
Paid memberships
WorkingJust over 8M paid members, Feb 2026
Management said on Nov 25, 2025 that paid members of My Best Buy Plus and Total were nearly 8 million, up from 7 million a year before. On Aug 27, 2026 it said it expects about 9 million by the end of FY2027.
Status: Working, on track against what the company said.
Computing and home theater
WorkingComputing and phones comparable sales +6.8%, Q2 FY2027
In Q2 FY2027, US comparable sales rose 4.5%. Best Buy credited computing, home theater and newer categories such as AI glasses and trading cards; gaming fell, with Entertainment comparable sales down 6.3%.
Status: Working, on track against what the company said.
Meta labs in stores
EarlyOver halfway through 50 spaces, Aug 2026
Management said on Aug 27, 2026 that Best Buy was more than halfway through building 50 dedicated spaces of about 900 square feet for Meta products.
Status: Early, too early to judge.
Status compares progress with what the company itself said it would do: Working = on track against what the company said; Mixed = partly on track; Behind = behind the company's own plan; New = recently announced; Early = too early to judge.
Sources (6)
- Q2 fiscal 2027 results release (Form 8-K, Exhibit 99)
- Q2 fiscal 2027 earnings call transcript (Aug 27, 2026)
- Q4 fiscal 2026 earnings call transcript (Mar 3, 2026)
- Form 10-K for fiscal 2026 (year ended Jan 31, 2026)
- Q1 fiscal 2027 earnings call transcript (May 28, 2026)
- Q3 fiscal 2026 earnings call transcript (Nov 25, 2025)
16The company's own measures (non-GAAP)
16The company's own measures · FY2026 (February 2025 to January 2026) and Q2 FY2027 (May 3 to Aug 1, 2026)
What do Best Buy's own measures show?
Official (GAAP): Operating income, FY2026
$1.4B
Company's own measure: Adjusted operating income, FY2026
$1.8B
Best Buy leaves out $190 million of restructuring, $171 million of goodwill and intangible impairments, a $21 million long-lived asset impairment and $14 million of amortization of acquired intangibles, $396 million in all.
Official (GAAP): Operating margin, FY2026
3.3%
Company's own measure: Adjusted operating income rate, FY2026
4.3%
Adjusted operating income ÷ revenue, with the same items left out.
Official (GAAP): Diluted EPS, FY2026
$5.04
Company's own measure: Adjusted diluted EPS, FY2026
$6.43
The same items, plus losses on a disposal and on investments, net of their tax effect.
Official (GAAP): Diluted EPS, FY2025
$4.28
Company's own measure: Adjusted diluted EPS, FY2025
$6.37
Mostly the $475 million Best Buy Health goodwill impairment, $2.19 a share before its tax effect.
Official (GAAP): Operating income, Q2 FY2027 (includes the refunds)
$421M
Company's own measure: Adjusted operating income, Q2 FY2027 (includes the refunds)
$417M
Lower than GAAP mainly because Best Buy also removes a $6 million restructuring credit, a reversal of earlier charges. Both figures include about $34 million of tariff refunds, which the adjusted figures do not remove.
Official (GAAP): Diluted EPS, Q2 FY2027 (includes the refunds)
$1.48
Company's own measure: Adjusted diluted EPS, Q2 FY2027 (includes the refunds)
$1.47
Same adjustments, net of tax.
Official (GAAP): Revenue growth, FY2026
0.4%
Company's own measure: Comparable sales growth, FY2026
0.5%
Change in sales at stores open at least 14 full months and in online, advertising, credit card and marketplace commission revenue, among others. Best Buy notes that retailers calculate this differently.
Official (GAAP): Revenue growth, Q2 FY2027
3.6%
Company's own measure: Comparable sales growth, Q2 FY2027
4.1%
Same definition. US comparable sales rose 4.5% and Canadian comparable sales fell 1.8%.
Official (GAAP): US Services revenue, FY2026 (May 2026 recast)
$3.2B
Company's own measure: Best Buy Ads gross advertising collections, FY2026 (just over)
$900M
Management said on Mar 3, 2026 that collections were just over $900 million, up more than 7%. They mostly reduce cost of goods sold, with a small part in Services revenue, so they are not revenue and are never added to it.
Official (GAAP): US Services revenue, Q2 FY2027
$824M
Company's own measure: US Marketplace merchandise value, Q2 FY2027 (about)
$300M
Management's approximate figure (Aug 27, 2026) for goods third-party sellers sold on Best Buy's US marketplace. Best Buy earns only commissions on it, counted in Services.
Official (GAAP)
No official figure measures this; it is the company's own operating measure.
Company's own measure: Paid members, February 2026 (just over)
8 million
Members of My Best Buy Plus and My Best Buy Total, as management said on Aug 27, 2026. Membership fees sit in Services revenue; filings give no member count.
These are the company's own measures, defined by the company. They are not comparable across companies, and they are not added together. Each sits beside the nearest official (GAAP) figure.
Learn: Non-GAAP measures: what a company's "adjusted" numbers leave out
Sources (6)
- Form 10-K for fiscal 2026 (year ended Jan 31, 2026)
- Form 10-Q for Q2 fiscal 2027 (quarter ended Aug 1, 2026)
- Q2 fiscal 2027 results release (Form 8-K, Exhibit 99)
- Revenue category reclassification, recast FY2025-FY2026 (Form 8-K, Exhibit 99.2)
- Q4 fiscal 2026 earnings call transcript (Mar 3, 2026)
- Q2 fiscal 2027 earnings call transcript (Aug 27, 2026)
17Financial strength and debt
17Financial strength · Aug 1, 2026
How much debt does Best Buy have?
- Total debt$1.2B
- Cash and investments$2.3B
- Net cash (cash minus debt)$1.1B
- Net worth (shareholders' money)$3.2B
- Debt to equity
- 0.37×
- $ of debt for every $1 of shareholders' money
- Net cash is a Cityfort calculation from Q2 FY2027 earnings release: cash and cash equivalents of $2,255 million minus debt of $1,169 million. It leaves out $279 million of restricted cash.
- Debt is mainly two notes: $500 million due Oct 1, 2028 and $650 million due Oct 1, 2030, plus $36 million of finance leases at Jan 31, 2026. A $1.25 billion credit facility was undrawn.
- Operating lease liabilities were $2,964 million at Aug 1, 2026 ($614 million current and $2,350 million long-term). Best Buy's operating lease obligations at Jan 31, 2026 were $3,347 million, with $739 million due within a year.
- Net cash moves with the seasons: debt exceeded cash by $242 million at Nov 1, 2025, before the holidays, and cash exceeded debt by $562 million at Jan 31, 2026.
- Stockholders' equity was $3,183 million at Aug 1, 2026, against $4,587 million at Jan 30, 2021, after years of buybacks.
Sources (6)
- Form 10-K for fiscal 2026 (year ended Jan 31, 2026)
- Form 10-Q for Q2 fiscal 2027 (quarter ended Aug 1, 2026)
- Q2 fiscal 2027 results release (Form 8-K, Exhibit 99)
- Q4 and fiscal 2026 results release (Form 8-K, Exhibit 99)
- Q3 fiscal 2026 results release (Form 8-K, Exhibit 99)
- SEC XBRL company facts, Best Buy Co., Inc. (CIK 0000764478)
18Who owns it
18Who owns it · ownership as of Mar 30, 2026
Who owns Best Buy?
- Officers and directors (as a group), shares
- 0.5%
Share classes
Holders of 5% or more
From the company's proxy statement (DEF 14A), later Schedule 13G filings and the share counts on its latest annual or quarterly report. Each holder row shows the date of its own filing.
Insider trades · Form 4 data as of Nov 6, 2026
What did Best Buy's insiders report trading?
Best Buy's insiders made 34 Form 4A filing an insider must make within two business days of buying or selling the company's shares. Learn more filings in the 12 months to Nov 6, 2026.
They reported no purchases and 26 sales (2.4 million shares) in the open market or privately (codes P and S).
7 of the 26 sales were on forms with the Rule 10b5-1 plan box checked.
The same filings report 35 other share transactions (A: 25, G: 8, F: 1, M: 1).
They also report 1 transaction in options, stock units or other derivatives.
Insiders are a company's officers, directors and owners of more than 10% of a class of its shares. Most changes in their holdings must be reported to the SEC on a Form 4 within two business days. Source: SEC Form 4 filings on EDGAR.
- P
- a purchase in the open market or privately
- S
- a sale in the open market or privately
- A
- a grant, award or other acquisition from the company under Rule 16b-3
- F
- shares withheld or handed over to pay an exercise price or tax when an award is received, exercised or vests
- M
- exercise or conversion of an option or other derivative, exempt under Rule 16b-3
- G
- a bona fide gift
Code meanings: General Instruction 8 of Form 4 (SEC).
The latest 25 of 61 transactions
Shares: A = acquired, D = disposed of. A price the filing gives only in a footnote shows as “See filing”. The 10b5-1 box is checked when at least one trade on the form was made under a Rule 10b5-1 plan. A Form 4/A replaces the form it amends. See all of Best Buy's Form 4 filings on EDGAR.
Learn: How to read a proxy statement (DEF 14A): Nvidia's 2026 proxy · Form 4 insider filings: who files, the codes and the footnotes · Rule 10b5-1 trading plans: how insiders pre-schedule their trades
Sources (6)
- Form 10-Q for Q2 fiscal 2027 (quarter ended Aug 1, 2026)
- Form 10-K for fiscal 2026 (year ended Jan 31, 2026)
- 2026 proxy statement (DEF 14A)
- Schedule 13G, Vanguard Capital Management (event Mar 31, 2026)
- Schedule 13G/A No. 12, The Vanguard Group (event Mar 13, 2026)
- Schedule 13D/A No. 15, Richard M. Schulze (event May 29, 2026)
19What it does with profit
19What it does with profit
What does Best Buy do with its profit?
Dividend per share
$3.80FY2026
Dividend paid for each share, by financial year.
$ per share
See the numbers
Buyback · Jan 30, 2021
FY2021: paid $312 million for its own shares.
$312M
Buyback · Jan 29, 2022
FY2022: paid $3.5 billion for its own shares.
$3.5B
Buyback · Jan 28, 2023
FY2023: paid $1.01 billion for its own shares.
$1.0B
Buyback · Feb 3, 2024
FY2024: paid $340 million for its own shares.
$340M
Buyback · Feb 1, 2025
FY2025: paid $500 million for its own shares.
$500M
Buyback · Jan 31, 2026
FY2026: paid $273 million for its own shares.
$273M
20Governance signals
20Governance signals
What do Best Buy's governance filings show?
- Auditor
- Deloitte & Touche LLP, since 2005
- Auditor changes
- None in the period covered
- Audit qualifications
- None reported
- Related-party dealings
- The 2026 proxy reports that Jason Bonfig's wife was a Senior Vice President of Omnichannel Operations, with FY2026 cash pay of about $504,506; she resigned, with a last day of Jul 31, 2026. Founder Richard M. Schulze, who is not a director, receives lifetime medical benefits, office space and administrative support under a 2013 letter agreement.
- Credit rating
- S&P Global Ratings and Moody's (as stated in the FY2026 10-K) BBB+ (S&P) / A3 (Moody's) (Stable (both)), Mar 16, 2026
A credit rating describes the company's ability to repay debt. It is not a rating of the share.
Flags to know about
shares as collateral
Founder's shares used as collateral for a loan
The 2026 proxy says a trust for founder Richard M. Schulze has used up to $200 million in value of Best Buy shares as collateral to secure a line of credit. Mr. Schulze held 6.43% of shares at Mar 30, 2026.
other
Founder's share sales and trading plan
A Schedule 13D/A filed Jun 2, 2026 reports open-market sales by Mr. Schulze on May 29, 2026, for asset diversification and liquidity, leaving 6.1%. It says he adopted a pre-arranged trading plan that day, expected to expire in June 2027.
other
New CEO, CFO and directors
Jason Bonfig succeeded Corie Barry as CEO on Nov 1, 2026, per an Apr 22, 2026 8-K. CFO Matt Bilunas left on Jul 31, 2026, and Anne Bramman became CFO on Aug 19, 2026. Meghan Frank and Dylan Jadeja joined the Board on Sep 12, 2025 and Dec 1, 2025.
late filing
Late insider reports
The 2026 proxy says one sale by M. Watson on Mar 14, 2025 and tax-withholding share sales for six officers on Mar 21, 2025 were reported late under Section 16.
auditor
Audit opinion and critical matters
Deloitte & Touche LLP, auditor since 2005, gave an unqualified FY2026 opinion and found internal control effective. Its critical audit matters were vendor allowances and Best Buy Health goodwill, $298 million of $790 million of goodwill.
disclosure
What Best Buy does not report
Filings give no Best Buy Ads revenue or profit, no Marketplace revenue, no paid member count and no revenue by type of customer. Those figures come only from earnings calls, as approximate management statements.
Sources (10)
- Form 10-K for fiscal 2026 (year ended Jan 31, 2026)
- 2026 proxy statement (DEF 14A)
- Schedule 13D/A No. 15, Richard M. Schulze (event May 29, 2026)
- 8-K: CEO succession, Jason Bonfig to succeed Corie Barry (Exhibit 99.1)
- 8-K: CFO Matt Bilunas to step down (Exhibit 99.1)
- 8-K: Anne Bramman appointed CFO (Exhibit 99.1)
- 8-K: Meghan Frank appointed to the Board (Exhibit 99.1)
- 8-K: Dylan Jadeja appointed to the Board (Exhibit 99.1)
- Q2 fiscal 2027 earnings call transcript (Aug 27, 2026)
- Q4 fiscal 2026 earnings call transcript (Mar 3, 2026)
21What the market paid
21What the market paid · price as of Nov 5, 2026
What did the market pay for Best Buy on Nov 5, 2026?
Price as of Nov 5, 2026 (shown for education; prices change daily).
Price as of Nov 5, 2026: $99.40, the close shown in Nasdaq's historical price table for Best Buy. The shares list on the NYSE, and this price is from Nasdaq's site, not NYSE's. Times 209.7 million shares (Sep 2, 2026), that is a market value of about $20.8 billion (Cityfort calculation from the Nov 5, 2026 closing price and the Q2 FY2027 10-Q cover). P/E is price ÷ earnings per share. It is 16.5 on diluted EPS of $6.01 for the four quarters to Aug 1, 2026, which include a $171 million Best Buy Health impairment (Cityfort calculation from the Q3 FY2026 to Q2 FY2027 earnings releases). It is 19.7 on FY2026 diluted EPS of $5.04. P/B is market value ÷ stockholders' equity: 6.5 on $3,183 million at Aug 1, 2026.
- Share price
- $99.40
- Market value (market cap)
- $20.8B
- P/E
- 16.5×
- P/B
- 6.5×
More price-based ratios · as of Nov 5, 2026
Each ratio divides a number from the company's filings by the market value or share price on Nov 5, 2026. Prices change daily, so these ratios do too.
Price to sales (P/S)
0.5×
$20.8B market value ÷ $42.2B revenue (four quarters to Aug 1, 2026) = 0.5×
Cityfort calculation from the Nov 5, 2026 closing price and the Q3 FY2026 to Q2 FY2027 10-Qs and earnings releases. Source: BBY historical closing prices, Oct 20 to Nov 5, 2026; Form 10-Q for Q2 fiscal 2027 (quarter ended Aug 1, 2026); Form 10-K for fiscal 2026 (year ended Jan 31, 2026) and 6 more
How price ratios workDividend yield
3.82%
$3.80 dividends per share (FY2026) ÷ $99.40 share price = 3.82%
Cityfort calculation from the FY2026 10-K and the Nov 5, 2026 closing price. Source: BBY historical closing prices, Oct 20 to Nov 5, 2026; Form 10-Q for Q2 fiscal 2027 (quarter ended Aug 1, 2026); Form 10-K for fiscal 2026 (year ended Jan 31, 2026) and 4 more
What dividend yield meansFree cash flow yield
6.0%
$1.3B free cash flow (FY2026) ÷ $20.8B market value = 6.0%
Cityfort calculation from the FY2026 10-K and the Nov 5, 2026 closing price. Source: BBY historical closing prices, Oct 20 to Nov 5, 2026; Form 10-Q for Q2 fiscal 2027 (quarter ended Aug 1, 2026); Form 10-K for fiscal 2026 (year ended Jan 31, 2026) and 4 more
What free cash flow means
Shares used for the market value: 209.7 million ($99.40 × 209.7 million shares ≈ $20.8B). Source: Form 10-Q for Q2 fiscal 2027 (quarter ended Aug 1, 2026); Form 10-K for fiscal 2026 (year ended Jan 31, 2026); 2026 proxy statement (DEF 14A)
Source: BBY historical closing prices, Oct 20 to Nov 5, 2026; Form 10-Q for Q2 fiscal 2027 (quarter ended Aug 1, 2026); Form 10-K for fiscal 2026 (year ended Jan 31, 2026) and 4 more
Sources (10)
- BBY historical closing prices, Oct 20 to Nov 5, 2026
- Form 10-Q for Q2 fiscal 2027 (quarter ended Aug 1, 2026)
- Form 10-K for fiscal 2026 (year ended Jan 31, 2026)
- Q2 fiscal 2027 results release (Form 8-K, Exhibit 99)
- Q1 fiscal 2027 results release (Form 8-K, Exhibit 99.1)
- Q4 and fiscal 2026 results release (Form 8-K, Exhibit 99)
- Q3 fiscal 2026 results release (Form 8-K, Exhibit 99)
- Form 10-Q for Q3 fiscal 2026 (quarter ended Nov 1, 2025)
- Form 10-Q for Q1 fiscal 2027 (quarter ended May 2, 2026)
- 2026 proxy statement (DEF 14A)
22How it got here
22How it got here
How did Best Buy get here?
1966
Milestone
Incorporated in Minnesota
Best Buy Co., Inc. was incorporated in Minnesota in 1966. Its Apr 22, 2026 release calls Jason Bonfig the sixth CEO in its 60-year history.
2019
Milestone
Barry becomes CEO
Corie Barry, then CFO and chief strategic transformation officer, became CEO in June 2019. She joined Best Buy in 1999.
2021
Business-model change
Health and furniture deals
Best Buy bought Current Health, a care-at-home technology platform, on Nov 2, 2021 for $389 million net cash, and Yardbird, an outdoor furniture seller, on Nov 4, 2021 for $79 million.
2022
Milestone
Sales peak
Revenue reached $51.8 billion in FY2022 (ended Jan 29, 2022), with comparable sales up 10.4%.
2023
Crisis
Three years of falling sales
Revenue fell in FY2023, FY2024 and FY2025, to $41.5 billion. Comparable sales fell 9.9%, 6.8% and 2.3%.
2025
Crisis
Best Buy Health write-down
Best Buy recorded a $475 million goodwill impairment for Best Buy Health in Q4 FY2025, the quarter ended Feb 1, 2025.
2025
Business-model change
US Marketplace launched, part of Health exited
Best Buy launched Best Buy Marketplace in the US in August 2025. In FY2026 it exited a component of Best Buy Health and recorded a further $171 million impairment in Q3 FY2026.
2026
Milestone
New CEO and CFO
Jason Bonfig succeeded Corie Barry as CEO on Nov 1, 2026, as announced on Apr 22, 2026. Anne Bramman became CFO on Aug 19, 2026.
Sources (10)
- Form 10-K for fiscal 2026 (year ended Jan 31, 2026)
- 8-K: CEO succession, Jason Bonfig to succeed Corie Barry (Exhibit 99.1)
- Form 10-K for fiscal 2023 (year ended Jan 28, 2023)
- Form 10-K for fiscal 2024 (53 weeks, year ended Feb 3, 2024)
- Form 10-K for fiscal 2025 (year ended Feb 1, 2025)
- Q4 and fiscal 2025 results release (Form 8-K, Exhibit 99)
- Form 10-Q for Q3 fiscal 2026 (quarter ended Nov 1, 2025)
- Q4 fiscal 2026 earnings call transcript (Mar 3, 2026)
- 8-K: Anne Bramman appointed CFO (Exhibit 99.1)
- Q2 fiscal 2027 results release (Form 8-K, Exhibit 99)
23Sources and changes
Where every number on this page comes from
Sources (32 documents)
- S1Form 10-K for fiscal 2026 (year ended Jan 31, 2026) · Best Buy Co., Inc. (SEC EDGAR) · Tier 1: company or exchange filing · Mar 18, 2026
- S2Form 10-K for fiscal 2025 (year ended Feb 1, 2025) · Best Buy Co., Inc. (SEC EDGAR) · Tier 1: company or exchange filing · Mar 19, 2025
- S3Form 10-K for fiscal 2024 (53 weeks, year ended Feb 3, 2024) · Best Buy Co., Inc. (SEC EDGAR) · Tier 1: company or exchange filing · Mar 15, 2024
- S4Form 10-K for fiscal 2023 (year ended Jan 28, 2023) · Best Buy Co., Inc. (SEC EDGAR) · Tier 1: company or exchange filing · Mar 17, 2023
- S5Form 10-Q for Q2 fiscal 2027 (quarter ended Aug 1, 2026) · Best Buy Co., Inc. (SEC EDGAR) · Tier 1: company or exchange filing · Sep 4, 2026
- S6Form 10-Q for Q1 fiscal 2027 (quarter ended May 2, 2026) · Best Buy Co., Inc. (SEC EDGAR) · Tier 1: company or exchange filing · Jun 5, 2026
- S7Form 10-Q for Q3 fiscal 2026 (quarter ended Nov 1, 2025) · Best Buy Co., Inc. (SEC EDGAR) · Tier 1: company or exchange filing · Dec 5, 2025
- S8Q2 fiscal 2027 results release (Form 8-K, Exhibit 99) · Best Buy Co., Inc. (SEC EDGAR) · Tier 1: company or exchange filing · Aug 27, 2026
- S9Q1 fiscal 2027 results release (Form 8-K, Exhibit 99.1) · Best Buy Co., Inc. (SEC EDGAR) · Tier 1: company or exchange filing · May 28, 2026
- S10Revenue category reclassification, recast FY2025-FY2026 (Form 8-K, Exhibit 99.2) · Best Buy Co., Inc. (SEC EDGAR) · Tier 1: company or exchange filing · May 28, 2026
- S11Q4 and fiscal 2026 results release (Form 8-K, Exhibit 99) · Best Buy Co., Inc. (SEC EDGAR) · Tier 1: company or exchange filing · Mar 3, 2026
- S12Q3 fiscal 2026 results release (Form 8-K, Exhibit 99) · Best Buy Co., Inc. (SEC EDGAR) · Tier 1: company or exchange filing · Nov 25, 2025
- S13Q2 fiscal 2026 results release (Form 8-K, Exhibit 99) · Best Buy Co., Inc. (SEC EDGAR) · Tier 1: company or exchange filing · Aug 28, 2025
- S14Q1 fiscal 2026 results release (Form 8-K, Exhibit 99) · Best Buy Co., Inc. (SEC EDGAR) · Tier 1: company or exchange filing · May 29, 2025
- S15Q4 and fiscal 2025 results release (Form 8-K, Exhibit 99) · Best Buy Co., Inc. (SEC EDGAR) · Tier 1: company or exchange filing · Mar 4, 2025
- S16Q3 fiscal 2025 results release (Form 8-K, Exhibit 99) · Best Buy Co., Inc. (SEC EDGAR) · Tier 1: company or exchange filing · Nov 26, 2024
- S172026 proxy statement (DEF 14A) · Best Buy Co., Inc. (SEC EDGAR) · Tier 1: company or exchange filing · Apr 30, 2026
- S18Schedule 13G, Vanguard Capital Management (event Mar 31, 2026) · Vanguard Capital Management (SEC EDGAR) · Tier 1: company or exchange filing · Apr 29, 2026
- S19Schedule 13G/A No. 12, The Vanguard Group (event Mar 13, 2026) · The Vanguard Group (SEC EDGAR) · Tier 1: company or exchange filing · Mar 26, 2026
- S20Schedule 13D/A No. 15, Richard M. Schulze (event May 29, 2026) · Richard M. Schulze (SEC EDGAR) · Tier 1: company or exchange filing · Jun 2, 2026
- S218-K: CEO succession, Jason Bonfig to succeed Corie Barry (Exhibit 99.1) · Best Buy Co., Inc. (SEC EDGAR) · Tier 1: company or exchange filing · Apr 22, 2026
- S228-K: CFO Matt Bilunas to step down (Exhibit 99.1) · Best Buy Co., Inc. (SEC EDGAR) · Tier 1: company or exchange filing · Jun 22, 2026
- S238-K: Anne Bramman appointed CFO (Exhibit 99.1) · Best Buy Co., Inc. (SEC EDGAR) · Tier 1: company or exchange filing · Aug 3, 2026
- S248-K: Meghan Frank appointed to the Board (Exhibit 99.1) · Best Buy Co., Inc. (SEC EDGAR) · Tier 1: company or exchange filing · Sep 12, 2025
- S258-K: Dylan Jadeja appointed to the Board (Exhibit 99.1) · Best Buy Co., Inc. (SEC EDGAR) · Tier 1: company or exchange filing · Dec 1, 2025
- S26Q2 fiscal 2027 earnings call transcript (Aug 27, 2026) · Best Buy Co., Inc. investor relations (LSEG StreetEvents edited transcript) · Tier 1: company or exchange filing · Aug 27, 2026
- S27Q1 fiscal 2027 earnings call transcript (May 28, 2026) · Best Buy Co., Inc. investor relations (LSEG StreetEvents edited transcript) · Tier 1: company or exchange filing · May 28, 2026
- S28Q4 fiscal 2026 earnings call transcript (Mar 3, 2026) · Best Buy Co., Inc. investor relations (LSEG StreetEvents edited transcript) · Tier 1: company or exchange filing · Mar 3, 2026
- S29Q3 fiscal 2026 earnings call transcript (Nov 25, 2025) · Best Buy Co., Inc. investor relations (Refinitiv StreetEvents edited transcript) · Tier 1: company or exchange filing · Nov 25, 2025
- S30BBY historical closing prices, Oct 20 to Nov 5, 2026 · Nasdaq · Tier 1: company or exchange filing · Nov 5, 2026
- S31SEC XBRL company facts, Best Buy Co., Inc. (CIK 0000764478) · U.S. SEC (data.sec.gov) · Tier 1: company or exchange filing · Nov 7, 2026
- S32EDGAR filing index, Best Buy Co., Inc. (CIK 0000764478) · U.S. SEC (EDGAR) · Tier 1: company or exchange filing · Nov 7, 2026
Changes to this page (v1 · Nov 6, 2026)
- v1 · Nov 6, 2026First version, through Q2 FY2027 (quarter ended Aug 1, 2026). (first version)
Numbers come only from tier 1 and tier 2 sources. Read how we research.
Disclaimer
For learning only. Cityfort is not a registered investment adviser or broker-dealer and does not recommend buying or selling any security. Prices shown are dated and may be out of date.
Investing in securities involves risk, including loss of capital. Before making any investment decision, do your own research and consider consulting a registered investment adviser or other qualified professional.
Cityfort, its owners and contributors may or may not hold securities of companies covered. Cityfort is not paid by any company it covers. Content is not an offer or solicitation to buy or sell any security, including in any initial public offering.
Read the positions policyRead the full disclaimerHide the full disclaimer
Cityfort publishes general educational content that explains how listed companies work. Cityfort is not registered with the US Securities and Exchange Commission or any state securities regulator as an investment adviser, and is not a broker-dealer or a member of FINRA. Cityfort does not provide investment, tax or legal advice, recommendations, ratings, price targets or any opinion on whether to buy, sell or hold any security. Nothing on the site is tailored to any person's circumstances.
All information is taken from publicly available sources, mainly company filings with the SEC, which are listed on each page with dates. We work to keep it accurate and correct errors publicly, but we do not guarantee that it is complete, accurate or up to date. Any market price or price-based ratio shown is dated, may be out of date by the time you read it, and is included only to explain concepts.
Statements by company management, including forward-looking statements and guidance, are reported as the company's statements, with their date and source; they are not our forecasts. Adjusted (non-GAAP) figures are the company's own measures and are shown next to the official (GAAP) figures.