Consumer Discretionary · NYSE: CCL
Carnival: how the business works
Carnival had 94 ships at Nov 30, 2025, running cruise vacations under brands such as Carnival Cruise Line, Princess and AIDA, with revenue of $26.6 billion in FY2025.
By Hardik Bhandare · Checked against filings: . Editorial policy. Corrections
Follow Carnival
Email me when Carnival's page is updated after earnings.
We'll send a confirmation email first. See our privacy policy.
Carnival Corporation Ltd. · Miami, Florida
Updated for Q3 FY2026 · checked
- Revenue, FY2025 (ended Nov 30, 2025)
- $26.6B
- Net income, FY2025
- $2.8B
- Ships, Nov 30, 2025
- 94
- Passengers carried, FY2025
- 13.6M
- Team members, FY2025 10-K
- >160,000
The short version
Carnival in 5 points
1 · What it sells
Carnival had 94 ships at Nov 30, 2025, selling cruise vacations under eight brands, including Carnival Cruise Line, Princess and AIDA, with revenue of $26.6 billion in FY2025.
2 · Who pays it
Guests paid for cruise tickets (65.4% of FY2025 revenue) and for onboard extras such as drinks, casinos, spas and shore excursions, plus other revenue (34.6%).
3 · What it keeps from $100
Of every $100 of FY2025 revenue, Carnival kept $16.8 as operating profit and $10.4 as net income, after $6.5 went on net interest, debt payoff costs, other items and tax.
4 · Where the operating profit comes from
North America brands made $3.2 billion of segment operating income in FY2025 and Europe brands $1.6 billion, while Cruise Support, which includes its ports and destinations, showed a $468 million loss.
5 · The one thing to watch
Fuel cost Carnival $615 million in Q3 FY2026, up from $451 million a year earlier, while debt stood at $23.9 billion on Aug 31, 2026.
Sources: From Carnival's FY2025 10-K and its Q3 FY2026 10-Q and earnings release · checked
See the full receipt and the management scorecard below
01Where the money goes · FY2025
Where does $100 of Carnival's money go?
Carnival · FY2025
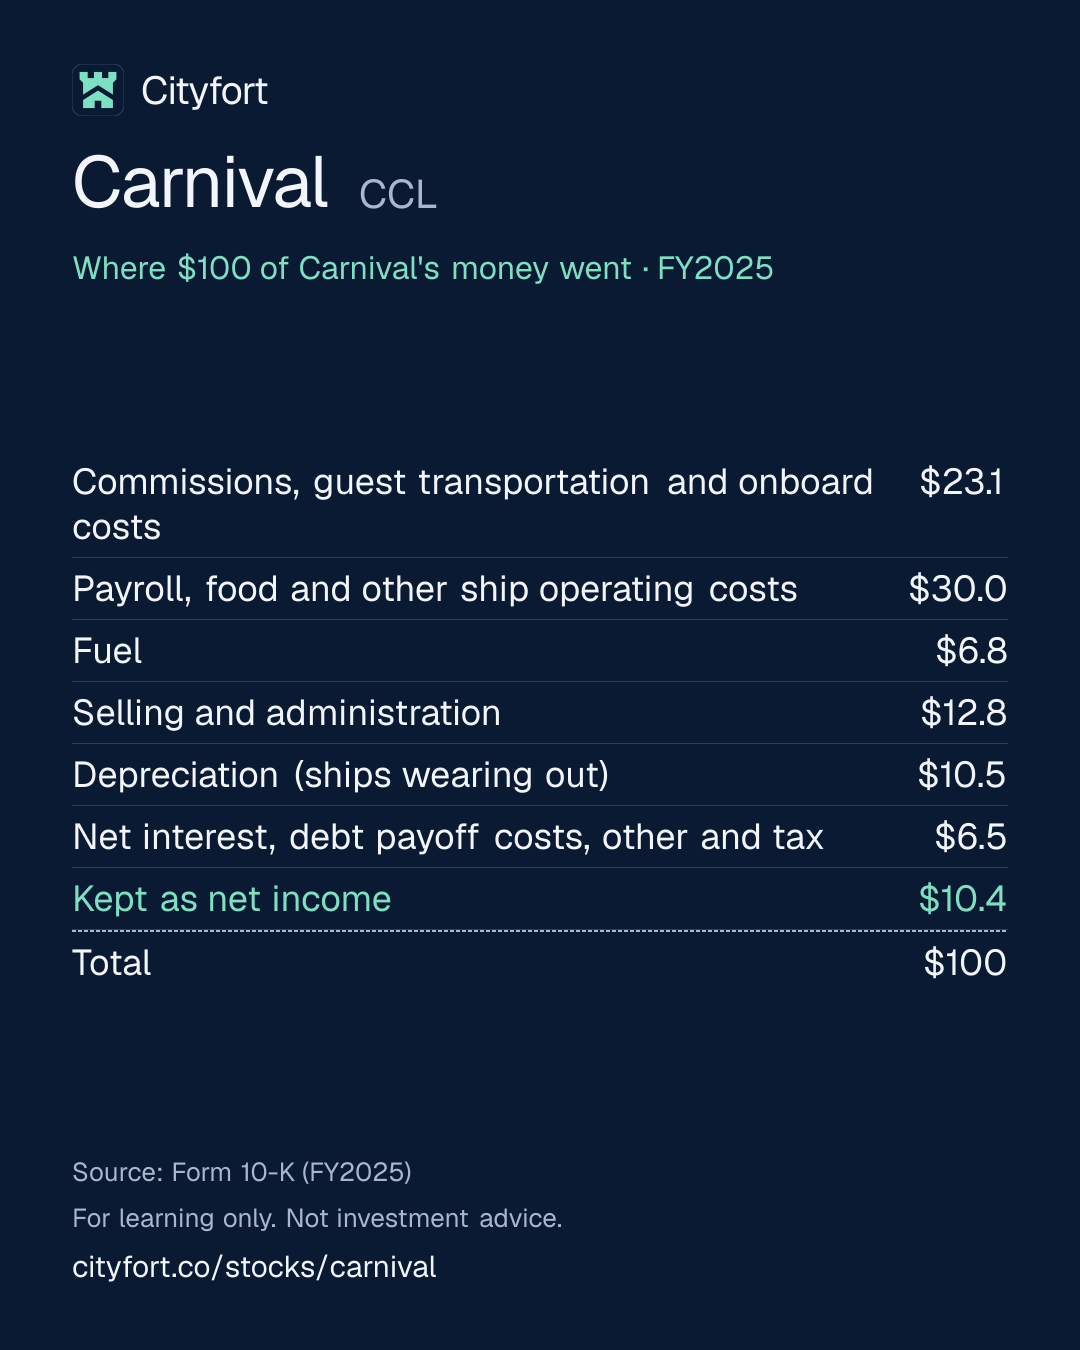
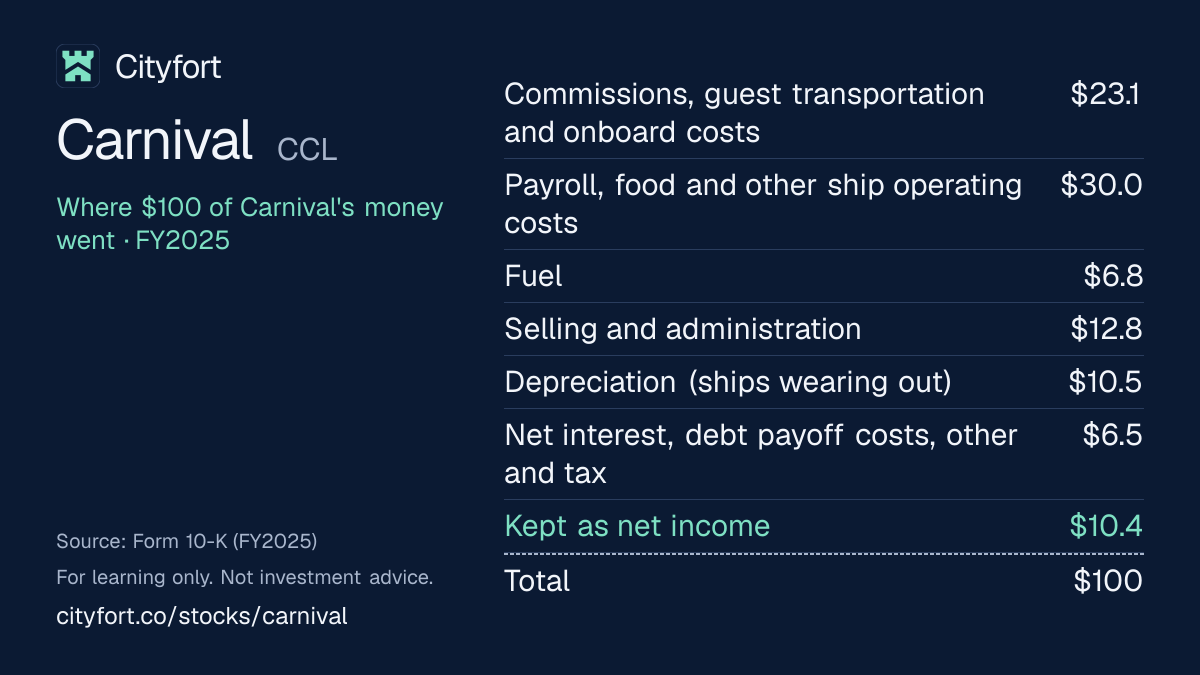
Receipt for every $100
| Commissions, guest transportation and onboard costs | $23.1 |
|---|---|
| Payroll, food and other ship operating costs | $30.0 |
| Fuel | $6.8 |
| Selling and administration | $12.8 |
| Depreciation (ships wearing out) | $10.5 |
| Net interest, debt payoff costs, other and tax | $6.5 |
| Kept as net income | $10.4 |
| Total | $100 |
Each line = amount ÷ total money in × 100. Lines may not add to exactly $100 because of rounding.
How this is worked out
Cityfort calculation from the FY2025 10-K. Of every $100 of FY2025 revenue (interest income is netted in the interest line): each line = line ÷ $26,622 million × 100.
Save this receipt as an image:
1080 × 1350 PNG for Instagram, LinkedIn1200 × 675 PNG for X
Embed this receipt
Paste this code into a blog or website to show the receipt, with a link back to this page:
Each week: one company explained in 5 points, picked by earnings date.
Free, no tips, unsubscribe anytime.
We'll send a confirmation email. See our privacy policy.
02The business in one line
What does Carnival do?
Guests pay Carnival for cruises and onboard extras; most of the money goes on running ships and selling trips, and $10.4 of every $100 of FY2025 revenue was left as net income.
- Tickets were 65.4% of FY2025 revenue. Onboard spending and other revenue, such as drinks, casinos, spas and shore excursions, were 34.6%.
- Ships cost the same to own whether full or not, so filling them matters. Occupancy was 105% in FY2025, because some cabins hold more than two guests.
03Who pays it
Who pays Carnival?
Guests buying cruise tickets
65%
of revenue
The fare for the cabin, most meals, entertainment and port visits: $17.4 billion in FY2025.
Guests spending onboard, and other revenue
35%
of revenue
Drinks, casino, spa, shore excursions, internet, specialty dining and other revenue: $9.2 billion in FY2025.
- Guests buying cruise tickets65%
- Guests spending onboard, and other revenue35%
How spread out the customers are
Carnival sells to individual travelers, so no single customer is material. No group of travel agencies under common control was 10% or more of FY2025 revenue. Of 13.6 million FY2025 passengers, 8.1 million came from the US and Canada.
04Why it makes money
Why does Carnival make money?
Carnival's ships cost much the same to own and crew whether full or not, so extra guests and onboard spending lift profit fast.
Depreciation, crew pay and interest do not shrink when ships sail half empty, as FY2021 showed. Once ships are full, more ticket and onboard revenue flows largely to profit. Operating profit per $100 of revenue rose from $9.1 in FY2023 to $16.8 in FY2025.
Operating profit per $100 of revenue
$9.1$16.8
FY2023 to FY2025
- Eight brands sell cruises in the US, Germany, the UK and other markets
- Guests pay much of the fare before sailing
- Full ships spread fixed costs over more guests
- Guests spend more onboard and at Carnival's own destinations
- Cash pays down debt and pays for new ships
- New, larger ships add berths
↺ Step 6 feeds back into step 1.
05Business segments · FY2025
Which businesses make up Carnival?
North America
66%Carnival Cruise Line, Princess, Holland America and Seabourn: $3.2 billion of segment operating income (adjusted, the company's segment measure) in FY2025.
Revenue $17.6B · Operating profit $3.2B
Europe
32%AIDA, Costa, P&O Cruises and Cunard: $1.6 billion of segment operating income in FY2025.
Revenue $8.5B · Operating profit $1.6B
Cruise Support
1%Its ports and private destinations, net of charges between Carnival's own units: a $468 million segment loss in FY2025.
Revenue $309M · Operating profit −$468M
Tour and Other
1%Holland America Princess Alaska Tours: $22 million of segment operating income in FY2025.
Revenue $241M · Operating profit $22M
How the mix changed
- North America
- Europe
- Cruise Support
- Tour and Other
Revenue by segment, FY2023 to FY2025.
US$
See the numbers
06The numbers · Consolidated · US$
How has Carnival done?
Revenue
$26.6BFY2025
Revenue fell to $1.9 billion in FY2021, when cruising was paused for COVID-19, and rose every year since, to $26.6 billion in FY2025; the June to August quarter was the largest in FY2025 and so far in FY2026, and the company says demand peaks then.
US$
See the numbers
Net profit
$2.8BFY2025
Carnival lost $9.5 billion in FY2021 and $6.1 billion in FY2022, was close to break-even in FY2023 and earned $2.8 billion in FY2025.
US$
See the numbers
Profit kept per $100 of revenue
$10.4FY2025
Net income per $100 of revenue rose from $7.7 in FY2024 to $10.4 in FY2025, after losses in FY2021 to FY2023.
$ of profit per $100 of revenue (net margin)
See the numbers
Free cash flow
$2.6BFY2025
Free cash flow was negative $7.7 billion in FY2021 and $6.6 billion in FY2022, then turned positive and reached $2.6 billion in FY2025.
US$ · cash from operations minus spending on plants and equipment
See the numbers
See all yearly numbers
EBITDA here = operating income plus depreciation and amortization (from the cash flow statement). Fiscal years are the company's own (November 30. Carnival's FY2025 ended Nov 30, 2025, and Q3 FY2026 ended Aug 31, 2026. FY2021 to FY2025 are the combined results of Carnival Corporation & plc, which became one company on May 7, 2026 with the same consolidated scope.). Net profit is the share belonging to the company's owners.
Download Carnival's yearly and quarterly numbers (CSV, with source ids)
Learn: Fiscal years that don't end in December: Nvidia's FY2027 explained · Stock-based compensation and dilution: pay that becomes shares
Sources (15)
- Form 10-K for fiscal year 2023 (ended Nov 30, 2023)
- SEC XBRL company facts for Carnival (CIK 0000815097): FY2021 balance sheet, diluted shares, historical dividends
- Form 10-K for fiscal year 2025 (ended Nov 30, 2025), Carnival Corporation & plc joint filing
- Form 10-K for fiscal year 2024 (ended Nov 30, 2024)
- Q4 and full year 2024 earnings release (8-K Exhibit 99.1)
- Q4 and full year 2025 earnings release (8-K Exhibit 99.1)
- Q1 2025 earnings release (8-K Exhibit 99.1)
- Q1 2026 earnings release (8-K Exhibit 99.1)
- Q2 2025 earnings release (8-K Exhibit 99.1)
- Q2 2026 earnings release (8-K Exhibit 99.1)
- Q3 2025 earnings release (8-K Exhibit 99.1)
- Q3 2026 earnings release (8-K Exhibit 99.1)
- Form 10-Q for Q1 fiscal 2026 (three months ended Feb 28, 2026)
- Form 10-Q for Q2 fiscal 2026 (three months ended May 31, 2026)
- Form 10-Q for Q3 fiscal 2026 (three months ended Aug 31, 2026)
07Who runs it
Who runs Carnival, and did they deliver?
Josh Weinstein
Chief Executive Officer
His FY2025 total pay was $18,887,776 in the proxy's summary compensation table, of which $11,961,027 was stock awards.
Micky Arison
Chair of the Board
Part of the Arison Group, which reported 8.06% in its Nov 26, 2025 Schedule 13D/A. Companies linked to a trust of which he is a beneficiary have agreements with Carnival (see governance).
What they said, and what happened
1 delivered · 3 too early to tell
Said on Dec 19, 2025
Carnival said it would reinstate a quarterly dividend of $0.15 a share.
DeliveredWhat happened
It paid $208 million, $207 million and $204 million in Q1, Q2 and Q3 FY2026.
Said on Dec 19, 2025
Carnival guided FY2026 adjusted EPS of about $2.48 and adjusted net income of about $3.5 billion.
Too early to tellWhat happened
It lowered EPS guidance to about $2.21 on Mar 27, 2026, citing fuel prices, then raised it to $2.22 (Jun 23) and $2.24 (Sep 29). FY2026 ends Nov 30, 2026.
Said on Mar 27, 2026
Carnival announced a $2.5 billion share buyback program with no end date.
Too early to tellWhat happened
$929 million was paid for buybacks in the first nine months of FY2026, and $1,562 million of the program remained at Aug 31, 2026.
Said on Mar 27, 2026
Carnival set PROPEL targets for 2029: return on invested capital above 16%, adjusted EPS more than 50% above 2025, and more than 40% of cash from operations returned to shareholders, about $14 billion.
Too early to tellWhat happened
The targets run to 2029. FY2025 adjusted EPS, the base, was $2.25.
Sources (7)
- 2026 proxy statement (DEF 14A), Carnival Corporation & plc
- Schedule 13D/A (Amendment No. 28) by the Arison Group (MA 1994 B Shares, Micky Arison, Richard L. Kohan, KLR, Nickel 2015-94 B Trust)
- Q4 and full year 2025 earnings release (8-K Exhibit 99.1)
- Q1 2026 earnings release (8-K Exhibit 99.1)
- Q2 2026 earnings release (8-K Exhibit 99.1)
- Q3 2026 earnings release (8-K Exhibit 99.1)
- Form 10-Q for Q3 fiscal 2026 (three months ended Aug 31, 2026)
08What could go wrong
What could go wrong for Carnival?
- Debt
Large debt load
Carnival had $23.9 billion of debt at Aug 31, 2026, against $14.2 billion of shareholders' equity. About $2.5 billion of principal is due in 2027 and $4.0 billion in 2028, and its loans carry covenants such as a minimum interest coverage of 3.0 times.
Watch Net debt and the debt maturity table in each 10-Q.
- Raw-material prices
Fuel prices
Fuel cost $615 million in Q3 FY2026, up from $451 million a year earlier, at $826 a ton against $607. Carnival cut its FY2026 EPS guidance on Mar 27, 2026, citing fuel prices.
Watch Fuel cost per metric ton in each earnings release.
- Demand
World events and travel demand
Carnival's 10-K names wars, pandemics, inflation and interest rates as risks to travel demand. When cruising paused for COVID-19, FY2021 revenue was $1.9 billion and the net loss $9.5 billion.
Watch Customer deposits and booking comments in each earnings release.
- Regulation
Emissions rules
The EU Emissions Trading System cost Carnival $91 million in 2025, with 70% of emissions in scope. The company expects about $160 million in 2026, when 100% is in scope.
Watch Emissions costs reported in the 10-K and 10-Qs.
- Legal
Data security incident
Six purported class actions followed a data security incident on Apr 14, 2026. They were consolidated, and proceedings are stayed until Dec 11, 2026; Carnival does not expect a material impact.
Watch The legal note in the FY2026 10-K.
- Currency
Currency moves
The Europe segment was 31.8% of FY2025 revenue, and at Aug 31, 2026 euro fixed-rate debt was 33% of debt and euro floating-rate debt 10%. The 10-K names the euro, pound and Australian dollar as currency risks.
Watch Constant-currency comments and the debt currency mix in each 10-Q.
Sources (5)
09Both sides
What do supporters and critics point to?
What supporters point to
- Revenue rose from $1.9 billion in FY2021 to $26.6 billion in FY2025, and net income reached $2.8 billion in FY2025.
- Debt fell from $34.5 billion at Nov 30, 2022 to $23.9 billion at Aug 31, 2026, and no secured debt remained after Jun 25, 2026.
- Customer deposits, cash guests paid before sailing, were $7.6 billion at Aug 31, 2026.
- Carnival reinstated a dividend in Dec 2025 and paid $929 million for buybacks in the first nine months of FY2026.
- Free cash flow rose from $997 million in FY2023 to $2.6 billion in FY2025.
What critics point to
- Debt of $23.9 billion at Aug 31, 2026 was about 1.7 times shareholders' equity of $14.2 billion.
- Fuel cost $615 million in Q3 FY2026, up from $451 million a year earlier.
- Cruising stopped during COVID-19, and Carnival lost $9.5 billion in FY2021 and $6.1 billion in FY2022.
- Operating income for the nine months to Aug 31, 2026 was $3,678 million, down from $3,748 million a year earlier.
- Carnival faces class actions over an Apr 14, 2026 data security incident, and a 2022 DOJ and EPA notice of potential penalties over alleged Clean Water Act violations.
10What to watch next
What should you watch next at Carnival?
Next event
Q4 FY2026 results
Date not announced yet.
Fuel costs
Fuel cost $615 million in Q3 FY2026, up from $451 million, at $826 a ton. The company's Sep 29, 2026 guidance assumed about $768 a ton for FY2026.
Debt and the new commercial paper program
Debt was $23.9 billion at Aug 31, 2026, with $2.5 billion of principal due in 2027. On Nov 4, 2026 Carnival reported a commercial paper program of up to $2.0 billion.
Buybacks and PROPEL targets
$1,562 million of the $2.5 billion buyback program remained at Aug 31, 2026. The PROPEL targets set on Mar 27, 2026 run to 2029.
11Key dates
What are the key dates for Carnival?
| Event | Date | Source |
|---|---|---|
| Fiscal 2026 endsCarnival's fiscal year ends on Nov 30. | Form 10-K for fiscal year 2025 (ended Nov 30, 2025), Carnival Corporation & plc joint filing; Form 10-Q for Q3 fiscal 2026 (three months ended Aug 31, 2026) | |
| Stay of the data incident class actions endsThe court stayed the consolidated case until this date. | Form 10-Q for Q3 fiscal 2026 (three months ended Aug 31, 2026) |
Learn: Fiscal years that don't end in December: Nvidia's FY2027 explained
12Key facts
Key facts about Carnival
- What does Carnival do?
- Carnival Corporation Ltd. runs cruise vacations under eight brands, including Carnival Cruise Line, Princess Cruises, Holland America Line, AIDA, Costa and P&O Cruises. Carnival had 94 ships with 272,380 lower berths on Nov 30, 2025, and carried 13.6 million passengers in FY2025.
- How does Carnival make money, and what is its business model?
- Carnival sells cruise tickets that include the cabin, most meals, entertainment and port visits, then earns more from onboard spending such as drinks, casinos, spas and shore excursions. In FY2025 (the year ended Nov 30, 2025) Carnival had revenue of $26.6 billion and kept $16.8 of operating profit and $10.4 of net income per $100 of revenue.
- Is Carnival profitable?
- Yes, since FY2024. Carnival's net income was $2.8 billion in FY2025 and $1.9 billion in FY2024, after losses of $9.5 billion in FY2021 and $6.1 billion in FY2022 during the COVID-19 pause and restart. Carnival's net income was $2.7 billion in the nine months to Aug 31, 2026.
- What is Carnival's revenue by segment?
- In FY2025 Carnival's North America segment (Carnival Cruise Line, Princess, Holland America and Seabourn) had revenue of $17.6 billion, 66.1% of the total. Its Europe segment (AIDA, Costa, P&O Cruises and Cunard) had $8.5 billion, 31.8%. Cruise Support and Tour and Other made up the remaining 2.1%.
- How much does Carnival make from onboard spending?
- Carnival earned $9.2 billion of onboard and other revenue in FY2025, 34.6% of revenue, up from $8.6 billion in FY2024. Carnival's passenger tickets brought in $17.4 billion in FY2025.
- Who are Carnival's customers?
- Carnival carried 13.6 million passengers in FY2025, 8.1 million of them from the US and Canada. Guests sourced in the US accounted for $14.8 billion, or 55.8%, of Carnival's FY2025 revenue, Germany 12.6% and the UK 11.5%.
- Who owns Carnival?
- Carnival Corporation Ltd. has one class of common shares, with 1,344.6 million shares outstanding on Sep 22, 2026. In SEC filings, each on its own share count, the Arison Group, which includes Chair Micky Arison, reported 8.06% (Nov 26, 2025), BlackRock 6.8% (Jul 27, 2026) and Vanguard Capital Management 6.87% (Apr 29, 2026).
- What happened to Carnival plc?
- On May 7, 2026 Carnival ended its dual listing with Carnival plc. Each Carnival plc share was exchanged one for one into a Carnival Corporation Ltd. share, Carnival plc left the London Stock Exchange and the NYSE, and Carnival moved its incorporation from Panama to Bermuda.
- Does Carnival pay a dividend?
- Carnival paid no dividends in FY2021 to FY2025. Carnival reinstated a $0.15 quarterly dividend in Dec 2025 and paid $0.45 a share, or $618 million, in the first nine months of FY2026.
Sources (11)
- Form 10-K for fiscal year 2025 (ended Nov 30, 2025), Carnival Corporation & plc joint filing
- Form 10-K for fiscal year 2023 (ended Nov 30, 2023)
- Form 10-Q for Q3 fiscal 2026 (three months ended Aug 31, 2026)
- Schedule 13D/A (Amendment No. 28) by the Arison Group (MA 1994 B Shares, Micky Arison, Richard L. Kohan, KLR, Nickel 2015-94 B Trust)
- Schedule 13G by BlackRock, Inc. (event date Jun 30, 2026)
- Schedule 13G by Vanguard Capital Management (event date Mar 31, 2026)
- 8-K filed May 7, 2026: completion of DLC unification and redomiciliation to Bermuda
- 8-K Exhibit 99.1 filed May 7, 2026: press release on completing the DLC unification
- Q3 2026 earnings release (8-K Exhibit 99.1)
- Q2 2026 earnings release (8-K Exhibit 99.1)
- Q1 2026 earnings release (8-K Exhibit 99.1)
Terms on this page
- Capital expenditures (capex)
- Debt-to-equity
- Earnings per share (EPS)
- EBITDA
- Free cash flow
- Market cap
- Net debt
- Net margin
- P/E ratio
- Revenue vs net income
Each explains the term in plain English, with the same number from other companies on Cityfort.
Go deeper
More detail from the same filings. Open any section.
13What it sells
13What it sells
What does Carnival sell?
North America brands (63 ships, 64% of berths)
Carnival Cruise Line (29 ships), Princess Cruises (17), Holland America Line (11) and Seabourn (6), at Nov 30, 2025.
Europe brands (31 ships, 36% of berths)
AIDA (11 ships), Costa (9), P&O Cruises (7) and Cunard (4), at Nov 30, 2025.
Onboard extras ($9.2B of FY2025 revenue)
Drinks, casino, spa, shore excursions, internet and specialty dining. Onboard and other revenue was 34% of 2025 cruise revenues, the 10-K says.
Ports and private destinations
Seven ports and destinations it owns or operates, including Celebration Key, opened in July 2025, and RelaxAway Half Moon Cay. They had 7.4 million guest visits in 2025.
Alaska land tours
Holland America Princess Alaska Tours, reported as the Tour and Other segment ($241 million of FY2025 revenue).
What it does
- Does: Sells trips through travel agents, tour operators, its own websites and call centers
- Does: Owns or operates seven ports and destinations that its ships visit
- Does: Collects much of the fare before guests sail, held as customer deposits ($7.6 billion at Aug 31, 2026)
- Does: Orders its new ships from shipyards: 7 were on order at Nov 30, 2025, from Fincantieri and Meyer Werft
What it does not do
- Does not: Does not include drinks, casino, spa or shore excursions in the ticket price: those are onboard extras
- Does not: Is not part of Royal Caribbean Group, Norwegian Cruise Line Holdings or MSC Cruises, which its 10-K names as competitors
- Does not: No longer has two listed companies: Carnival plc was delisted on May 7, 2026 and is now a UK subsidiary
- Does not: Does not build its own ships
14How the money flows
14How the money flows · FY2025
How does money flow through Carnival?
Money in
- Revenue (tickets $17,419M, onboard and other $9,202M)$26.6B
The company
Carnival
$26.6B came in
Money out
- Commissions, guest transportation and onboard costs$6.1B
- Payroll, food and other ship operating costs$8.0B
- Fuel$1.8B
- Selling and administration$3.4B
- Depreciation and amortization (ships wearing out)$2.8B
- Net interest, debt payoff costs, other and income tax$1.7B
- Net income$2.8B
- Guests paid Carnival $26.6 billion in FY2025: $17.4 billion for tickets and $9.2 billion onboard and other.
- Travel agent commissions, guest transportation and onboard costs took $6.1 billion.
- Payroll, food, fuel and other ship running costs took $9.8 billion, and selling and administration $3.4 billion.
- Ships wearing out cost $2.8 billion, leaving $4.5 billion of operating profit.
- Net interest of $1.3 billion, $409 million of debt payoff costs and other items left $2.8 billion of net income.
15What it needs to run
15What it needs to run
What does Carnival need to run?
Ships
94 ships with 272,380 lower berths (two beds per cabin) on Nov 30, 2025. At Aug 31, 2026, $11.4 billion of ship commitments fell due after 2030.
New ships on order
7 ships on order at Nov 30, 2025, for delivery to 2033, from Fincantieri and Meyer Werft, starting with Carnival Festivale in Apr 2027. In Jun 2026 Carnival ordered 3 LNG-powered ships for Princess, for 2035, 2038 and 2039.
Crew and shore staff
More than 160,000 team members from about 150 countries. Shipboard employees averaged 101,000 in 2025, and 48% of them were under collective agreements.
Fuel
2.8 million metric tons in FY2025, at $610 a ton. Fuel cost $1.8 billion that year.
Ports and private destinations
Seven owned or operated ports and destinations, with 7.4 million guest visits in 2025, up from 6.5 million in 2024.
16Where it sells
16Where it sells · FY2025
Where does Carnival sell?
- United States56%
- Germany13%
- United Kingdom12%
- Other countries20%
17Competitors and what protects it
17Competitors and what protects it
Who does Carnival compete with?
Royal Caribbean Group
NYSE: RCL
Named in Carnival's FY2025 10-K as one of its principal cruise competitors.
Norwegian Cruise Line Holdings
Named in Carnival's FY2025 10-K as one of its principal cruise competitors.
MSC Cruises
Named in Carnival's FY2025 10-K as one of its principal cruise competitors; it is privately owned.
What protects the business
Each strength is scored 1 (weak) to 5 (strong) for the business, with the reason. It is not a rating of the share.
- Scale4 of 5
Carnival had 35.6% of global cruise berths at Dec 31, 2025 (Cityfort calculation from the FY2025 10-K), across 94 ships.
- Brands in several countries3 of 5
Eight brands source guests from the US, Germany, the UK and other countries; no country other than these three was 10% of FY2025 revenue.
- Own destinations3 of 5
Seven owned or operated ports and destinations had 7.4 million guest visits in 2025; Celebration Key, opened in July 2025, had about 2.5 million guests in its first year, the company says.
- Ships take years to build3 of 5
New capacity arrives slowly: Carnival's 7 ships on order at Nov 30, 2025 deliver between Apr 2027 and Jun 2033.
Weak spot
Debt and exposure to world events
Carnival had $23.9 billion of debt at Aug 31, 2026. When cruising paused for COVID-19, FY2021 revenue fell to $1.9 billion and the net loss was $9.5 billion.
18Where growth could come from
18Where growth could come from
Where could Carnival's growth come from?
Carnival said in its Sep 29, 2026 earnings release that it expects FY2026 adjusted net income of about $3.08 billion and adjusted EPS of about $2.24, on its own definitions. On Dec 19, 2025 it had said about $3.5 billion and $2.48, and it cut the EPS figure on Mar 27, 2026, citing fuel prices. GAAP diluted EPS was $1.96 for the first nine months of FY2026.
Onboard spending
Working$9.2B, FY2025
Onboard and other revenue rose from $7.5 billion in FY2023 to $9.2 billion in FY2025, 34.6% of revenue.
Status: Working, on track against what the company said.
Celebration Key and other destinations
Working7.4M guest visits, 2025
Guest visits to Carnival's own ports and destinations rose from 6.5 million in 2024. The company says Celebration Key, opened in July 2025, had about 2.5 million guests in its first year.
Status: Working, on track against what the company said.
Paying down debt
Working$23.9B debt, Aug 31, 2026
Down from $34.5 billion at Nov 30, 2022 and $26.6 billion at Nov 30, 2025. After a second investment-grade rating on Jun 25, 2026, no secured debt remained, the company says.
Status: Working, on track against what the company said.
Returning cash to shareholders
New$929M of buybacks, 9M FY2026
Carnival reinstated a $0.15 quarterly dividend in Dec 2025 and announced a $2.5 billion buyback in Mar 2026. Its PROPEL targets, set on Mar 27, 2026, aim to return more than 40% of cash from operations to shareholders through 2029.
Status: New, recently announced.
New ships
Early7 ships on order at Nov 30, 2025, plus 3 Princess ships ordered in Jun 2026
Carnival Festivale (Apr 2027) and Carnival Tropicale (Mar 2028) have 5,360 berths each. Three more Carnival Cruise Line ships follow in 2029, 2031 and 2033, and AIDA ships in 2030 and 2031, subject to financing (all at Nov 30, 2025). In Jun 2026 Carnival ordered three LNG-powered Princess ships for delivery in 2035, 2038 and 2039.
Status: Early, too early to judge.
Status compares progress with what the company itself said it would do: Working = on track against what the company said; Mixed = partly on track; Behind = behind the company's own plan; New = recently announced; Early = too early to judge.
Sources (8)
- Q3 2026 earnings release (8-K Exhibit 99.1)
- Q4 and full year 2025 earnings release (8-K Exhibit 99.1)
- Q1 2026 earnings release (8-K Exhibit 99.1)
- Form 10-Q for Q3 fiscal 2026 (three months ended Aug 31, 2026)
- Form 10-K for fiscal year 2025 (ended Nov 30, 2025), Carnival Corporation & plc joint filing
- Form 10-K for fiscal year 2023 (ended Nov 30, 2023)
- 8-K filed Aug 5, 2026: redemption of 7.000% notes due 2029; collateral released on second investment grade rating (Jun 25, 2026)
- Q2 2026 earnings release (8-K Exhibit 99.1)
19The company's own measures (non-GAAP)
19The company's own measures · FY2025 and Q3 FY2026
What do Carnival's own measures show?
Official (GAAP): Net income, FY2025
$2.8B
Company's own measure: Adjusted net income, FY2025
$3.1B
Leaves out gains and impairments on ship sales, debt extinguishment and modification costs ($409 million in FY2025), restructuring and other items, as Carnival defines it.
Official (GAAP): Diluted EPS, FY2025
$2.02
Company's own measure: Adjusted diluted EPS, FY2025
$2.25
Adjusted net income per diluted share, same exclusions.
Official (GAAP): Operating income, FY2025
$4.5B
Company's own measure: Adjusted EBITDA, FY2025
$7.2B
Adjusted net income before interest, income tax, depreciation and amortization, as Carnival defines it.
Official (GAAP): Net income, Q3 FY2026
$1.9B
Company's own measure: Adjusted net income, Q3 FY2026
$2.0B
Adds back $23 million of debt extinguishment costs and other items.
Official (GAAP): Gross margin yields per available lower berth day, FY2025
$81.7M
Company's own measure: Net yields per available lower berth day, FY2025
209.7 $ per available lower berth day
Adjusted gross margin divided by available lower berth days (two guests per cabin for each day a ship can sail), as Carnival defines it; $197.33 in FY2024. Carnival pairs it with gross margin yields, $81.72 in FY2025 and $71.43 in FY2024.
Official (GAAP): Passenger ticket revenue, FY2025
17,419.0%
Company's own measure: Occupancy, FY2025
105%
Carnival's occupancy statistic, measured against two guests per cabin; above 100% because some cabins hold more than two guests. It was 56% in FY2021.
These are the company's own measures, defined by the company. They are not comparable across companies, and they are not added together. Each sits beside the nearest official (GAAP) figure.
Learn: Non-GAAP measures: what a company's "adjusted" numbers leave out
Sources (5)
- Q4 and full year 2025 earnings release (8-K Exhibit 99.1)
- Form 10-K for fiscal year 2025 (ended Nov 30, 2025), Carnival Corporation & plc joint filing
- Q3 2026 earnings release (8-K Exhibit 99.1)
- Q4 and full year 2024 earnings release (8-K Exhibit 99.1)
- Form 10-K for fiscal year 2023 (ended Nov 30, 2023)
20Financial strength and debt
20Financial strength · Aug 31, 2026
How much debt does Carnival have?
- Total debt$23.9B
- Cash and investments$1.2B
- Net debt (debt minus cash)$22.7B
- Net worth (shareholders' money)$14.2B
- Debt to equity
- 1.69×
- $ of debt for every $1 of shareholders' money
- Net debt is a Cityfort calculation from the Q3 FY2026 10-Q: total debt at carrying value minus cash. Operating lease liabilities of $1,250 million are not included; some data vendors add them in.
- Total debt was $34.5 billion at Nov 30, 2022 (Cityfort calculation from the FY2023 10-K). The company says it has cut debt by over $10 billion since its peak in January 2023.
- Principal due: $2.5 billion in 2027, $4.0 billion in 2028 and $3.6 billion in 2029. Liquidity was $5.7 billion at Aug 31, 2026, including a $4.5 billion undrawn revolving credit facility.
- Customer deposits, cash guests paid before sailing, were $7.6 billion at Aug 31, 2026. They count as a liability until the cruise happens.
- On Nov 4, 2026 Carnival reported a new commercial paper program of up to $2.0 billion, backed by its revolving credit facility.
21Who owns it
21Who owns it · ownership as of Jan 13, 2026
Who owns Carnival?
- Officers and directors (as a group), shares
- 7.9%
Share classes
Holders of 5% or more
From the company's proxy statement (DEF 14A), later Schedule 13G filings and the share counts on its latest annual or quarterly report. Each holder row shows the date of its own filing.
Insider trades · Form 4 data as of Nov 6, 2026
What did Carnival's insiders report trading?
Carnival's insiders made 30 Form 4A filing an insider must make within two business days of buying or selling the company's shares. Learn more filings in the 12 months to Nov 6, 2026.
They reported no purchases and 7 sales (468,529.2132 shares) in the open market or privately (codes P and S).
None of the sales were on forms with the Rule 10b5-1 plan box checked.
The same filings report 48 other share transactions (F: 26, A: 19, G: 3).
Insiders are a company's officers, directors and owners of more than 10% of a class of its shares. Most changes in their holdings must be reported to the SEC on a Form 4 within two business days. Source: SEC Form 4 filings on EDGAR.
- P
- a purchase in the open market or privately
- S
- a sale in the open market or privately
- A
- a grant, award or other acquisition from the company under Rule 16b-3
- F
- shares withheld or handed over to pay an exercise price or tax when an award is received, exercised or vests
- G
- a bona fide gift
Code meanings: General Instruction 8 of Form 4 (SEC).
The latest 25 of 55 transactions
Shares: A = acquired, D = disposed of. A price the filing gives only in a footnote shows as “See filing”. The 10b5-1 box is checked when at least one trade on the form was made under a Rule 10b5-1 plan. A Form 4/A replaces the form it amends. See all of Carnival's Form 4 filings on EDGAR.
Learn: How to read a proxy statement (DEF 14A): Nvidia's 2026 proxy · Form 4 insider filings: who files, the codes and the footnotes · Rule 10b5-1 trading plans: how insiders pre-schedule their trades
Sources (5)
- Form 10-Q for Q3 fiscal 2026 (three months ended Aug 31, 2026)
- 8-K filed May 7, 2026: completion of DLC unification and redomiciliation to Bermuda
- Schedule 13D/A (Amendment No. 28) by the Arison Group (MA 1994 B Shares, Micky Arison, Richard L. Kohan, KLR, Nickel 2015-94 B Trust)
- Schedule 13G by Vanguard Capital Management (event date Mar 31, 2026)
- Schedule 13G by BlackRock, Inc. (event date Jun 30, 2026)
22What it does with profit
22What it does with profit
What does Carnival do with its profit?
Buyback · Aug 31, 2026
Paid $929 million to buy back shares in the first nine months of FY2026, under the $2.5 billion program announced in March 2026; 20.3 million shares at an average $27.03 in Q3.
$929M
Money raised · Nov 30, 2021
Issued $1.0 billion of new shares in FY2021, during the COVID-19 pause.
$1.0B
Money raised · Nov 30, 2022
Issued $1.2 billion of new shares in FY2022.
$1.2B
23Governance signals
23Governance signals
What do Carnival's governance filings show?
- Auditor
- Deloitte & Touche LLP, since 2024
- Auditor changes
- None in the period covered
- Audit qualifications
- None reported
- Related-party dealings
- The 2026 proxy reports FY2025 deals with companies linked to Chair Micky Arison. Carnival Cruise Line paid $806,000 under an advertising agreement with the Miami Heat and its arena. Carnival paid $1,410,000 to lease an aircraft from Ad Astra I, LLC, and Nickel Cayman Management paid Carnival $162,000 in fees plus $2,784,000 of costs. The boards approved or ratified them.
- Credit rating
- Fitch and S&P (as stated in Carnival's earnings releases and an 8-K); Moody's Investment grade at Fitch and S&P (the filings do not state the letter grades); Carnival said on Jun 23, 2026 that Moody's had upgraded its rating, without stating the grade (Moody's: positive, as the company stated on Jun 23, 2026; not stated for Fitch and S&P), Sep 29, 2026
A credit rating describes the company's ability to repay debt. It is not a rating of the share.
Flags to know about
auditor
New auditor from fiscal 2024
Deloitte & Touche LLP has audited Carnival since fiscal 2024. PricewaterhouseCoopers audited it from at least 1986 through fiscal 2023. Deloitte's FY2025 opinion was unqualified.
regulatory
DOJ and EPA notice on alleged Clean Water Act violations
On Mar 14, 2022 the DOJ and EPA notified Carnival of potential civil penalties and injunctive relief for alleged Clean Water Act violations by vessels covered by the 2013 Vessel General Permit. Carnival says it is working with the agencies toward a resolution and does not expect a material impact.
other
Havana Docks lawsuit
Havana Docks sued in 2019 under the Helms-Burton Act, alleging that Carnival 'trafficked' in confiscated Cuban property. A $110 million judgment plus $4 million of costs was reversed on appeal in Oct 2024; on May 21, 2026 the Supreme Court sent the case back to the appeals court. Carnival does not expect a material impact.
other
Data security incident class actions
Six purported class actions followed a data security incident on Apr 14, 2026. The court consolidated them and stayed proceedings until Dec 11, 2026. Carnival does not expect a material impact.
disclosure
Ownership table predates the unification
The 2026 proxy's ownership percentages are of Carnival Corporation's shares before Carnival plc shares were exchanged on May 7, 2026. The first proxy for the single company has not been filed yet.
other
Moved from Panama to Bermuda
On May 7, 2026 Carnival Corporation became Carnival Corporation Ltd., a Bermuda company. Shareholder rights now follow Bermuda law and its bye-laws.
Sources (8)
- Form 10-K for fiscal year 2025 (ended Nov 30, 2025), Carnival Corporation & plc joint filing
- 2026 proxy statement (DEF 14A), Carnival Corporation & plc
- Q4 and full year 2025 earnings release (8-K Exhibit 99.1)
- Q3 2026 earnings release (8-K Exhibit 99.1)
- 8-K filed Aug 5, 2026: redemption of 7.000% notes due 2029; collateral released on second investment grade rating (Jun 25, 2026)
- Q2 2026 earnings release (8-K Exhibit 99.1)
- Form 10-Q for Q3 fiscal 2026 (three months ended Aug 31, 2026)
- 8-K filed May 7, 2026: completion of DLC unification and redomiciliation to Bermuda
24What the market paid
24What the market paid · price as of Nov 5, 2026
What did the market pay for Carnival on Nov 5, 2026?
Price as of Nov 5, 2026 (shown for education; prices change daily).
Price as of Nov 5, 2026: $29.59, the close shown in Nasdaq's historical price table for Carnival. The shares list on the NYSE, and this price is from Nasdaq's site, not NYSE's. Times 1,344.6 million shares (Sep 22, 2026), that is a market value of about $39.8 billion (Cityfort calculation from the Nov 5, 2026 closing price and the Q3 FY2026 10-Q). P/E is price ÷ earnings per share: 12.9 on diluted EPS of $2.29 for the four quarters to Aug 31, 2026 (Cityfort calculation from the Nov 5, 2026 closing price and the Q4 FY2025 to Q3 FY2026 earnings releases). The $0.15 quarterly dividend, times four, is 2.03% of this price (Cityfort calculation from the Nov 5, 2026 closing price and the Q3 FY2026 10-Q).
- Share price
- $29.59
- Market value (market cap)
- $39.8B
- P/E
- 12.9×
More price-based ratios · as of Nov 5, 2026
Each ratio divides a number from the company's filings by the market value or share price on Nov 5, 2026. Prices change daily, so these ratios do too.
Price to sales (P/S)
1.4×
$39.8B market value ÷ $27.6B revenue (four quarters to Aug 31, 2026) = 1.4×
Cityfort calculation from the Nov 5, 2026 closing price and the Q4 FY2025 to Q3 FY2026 10-Qs and earnings releases. Source: CCL historical daily prices, Nasdaq's table for an NYSE-listed share (close of Nov 5, 2026: $29.59); Form 10-Q for Q3 fiscal 2026 (three months ended Aug 31, 2026); Q4 and full year 2025 earnings release (8-K Exhibit 99.1) and 5 more
How price ratios workFree cash flow yield
6.6%
$2.6B free cash flow (FY2025) ÷ $39.8B market value = 6.6%
Cityfort calculation from the FY2025 10-K and the Nov 5, 2026 closing price. Source: CCL historical daily prices, Nasdaq's table for an NYSE-listed share (close of Nov 5, 2026: $29.59); Form 10-Q for Q3 fiscal 2026 (three months ended Aug 31, 2026); Q4 and full year 2025 earnings release (8-K Exhibit 99.1) and 4 more
What free cash flow means
Shares used for the market value: 1,344.6 million ($29.59 × 1,344.6 million shares ≈ $39.8B). Source: Form 10-Q for Q3 fiscal 2026 (three months ended Aug 31, 2026); 8-K filed May 7, 2026: completion of DLC unification and redomiciliation to Bermuda
Source: CCL historical daily prices, Nasdaq's table for an NYSE-listed share (close of Nov 5, 2026: $29.59); Form 10-Q for Q3 fiscal 2026 (three months ended Aug 31, 2026); Q4 and full year 2025 earnings release (8-K Exhibit 99.1) and 3 more
Sources (10)
- CCL historical daily prices, Nasdaq's table for an NYSE-listed share (close of Nov 5, 2026: $29.59)
- Form 10-Q for Q3 fiscal 2026 (three months ended Aug 31, 2026)
- Q4 and full year 2025 earnings release (8-K Exhibit 99.1)
- Q1 2026 earnings release (8-K Exhibit 99.1)
- Q2 2026 earnings release (8-K Exhibit 99.1)
- Q3 2026 earnings release (8-K Exhibit 99.1)
- Form 10-Q for Q1 fiscal 2026 (three months ended Feb 28, 2026)
- Form 10-Q for Q2 fiscal 2026 (three months ended May 31, 2026)
- Form 10-K for fiscal year 2025 (ended Nov 30, 2025), Carnival Corporation & plc joint filing
- 8-K filed May 7, 2026: completion of DLC unification and redomiciliation to Bermuda
25How it got here
25How it got here
How did Carnival get here?
2003
Business-model change
Two listed companies, one cruise group
On Apr 17, 2003 Carnival Corporation and Carnival plc formed a dual listed company: two listed companies with one management team and identical boards.
2021
Crisis
COVID-19 pause
With cruising paused and restarting, FY2021 revenue was $1.9 billion and the net loss $9.5 billion. Carnival borrowed $13.0 billion and issued $1.0 billion of shares that year.
2023
Milestone
Ships full again, debt at its peak
Occupancy returned to 100% in FY2023 and the net loss shrank to $74 million. The company says its debt peaked in January 2023.
2025
Milestone
Net income of $2.8 billion and Celebration Key
Net income reached $2.8 billion in FY2025. Celebration Key opened in July 2025, and Fitch rated Carnival investment grade, the company said in December.
2025
Milestone
Dividend reinstated
In December 2025 Carnival reinstated a $0.15 quarterly dividend, its first since 2020.
2026
Business-model change
One company, moved to Bermuda
On May 7, 2026 Carnival plc shares were exchanged one for one into Carnival Corporation Ltd. shares, Carnival plc left the London and New York exchanges, and the company moved from Panama to Bermuda.
2026
Milestone
Second investment-grade rating
On Jun 25, 2026 Carnival received a second investment-grade rating, from S&P, which released the collateral on its 2029 notes. No secured debt remains, the company says.
Sources (8)
- Form 10-K for fiscal year 2025 (ended Nov 30, 2025), Carnival Corporation & plc joint filing
- Form 10-K for fiscal year 2023 (ended Nov 30, 2023)
- Q4 and full year 2025 earnings release (8-K Exhibit 99.1)
- 8-K filed May 7, 2026: completion of DLC unification and redomiciliation to Bermuda
- 8-K Exhibit 99.1 filed May 7, 2026: press release on completing the DLC unification
- EDGAR submissions index for Carnival Corp Ltd. (CIK 0000815097): name change and filing dates
- 8-K filed Aug 5, 2026: redemption of 7.000% notes due 2029; collateral released on second investment grade rating (Jun 25, 2026)
- Q3 2026 earnings release (8-K Exhibit 99.1)
26Sources and changes
Where every number on this page comes from
Sources (26 documents)
- S1Form 10-K for fiscal year 2025 (ended Nov 30, 2025), Carnival Corporation & plc joint filing · Carnival Corporation (SEC EDGAR) · Tier 1: company or exchange filing · Jan 27, 2026
- S2Form 10-K for fiscal year 2024 (ended Nov 30, 2024) · Carnival Corporation (SEC EDGAR) · Tier 1: company or exchange filing · Jan 27, 2025
- S3Form 10-K for fiscal year 2023 (ended Nov 30, 2023) · Carnival Corporation (SEC EDGAR) · Tier 1: company or exchange filing · Jan 26, 2024
- S4Form 10-Q for Q3 fiscal 2026 (three months ended Aug 31, 2026) · Carnival Corporation Ltd. (SEC EDGAR) · Tier 1: company or exchange filing · Sep 29, 2026
- S5Form 10-Q for Q2 fiscal 2026 (three months ended May 31, 2026) · Carnival Corporation Ltd. (SEC EDGAR) · Tier 1: company or exchange filing · Jun 26, 2026
- S6Form 10-Q for Q1 fiscal 2026 (three months ended Feb 28, 2026) · Carnival Corporation (SEC EDGAR) · Tier 1: company or exchange filing · Mar 27, 2026
- S7Q3 2026 earnings release (8-K Exhibit 99.1) · Carnival Corporation Ltd. (SEC EDGAR) · Tier 1: company or exchange filing · Sep 29, 2026
- S8Q2 2026 earnings release (8-K Exhibit 99.1) · Carnival Corporation Ltd. (SEC EDGAR) · Tier 1: company or exchange filing · Jun 23, 2026
- S9Q1 2026 earnings release (8-K Exhibit 99.1) · Carnival Corporation (SEC EDGAR) · Tier 1: company or exchange filing · Mar 27, 2026
- S10Q4 and full year 2025 earnings release (8-K Exhibit 99.1) · Carnival Corporation (SEC EDGAR) · Tier 1: company or exchange filing · Dec 19, 2025
- S11Q3 2025 earnings release (8-K Exhibit 99.1) · Carnival Corporation (SEC EDGAR) · Tier 1: company or exchange filing · Sep 29, 2025
- S12Q2 2025 earnings release (8-K Exhibit 99.1) · Carnival Corporation (SEC EDGAR) · Tier 1: company or exchange filing · Jun 24, 2025
- S13Q1 2025 earnings release (8-K Exhibit 99.1) · Carnival Corporation (SEC EDGAR) · Tier 1: company or exchange filing · Mar 21, 2025
- S14Q4 and full year 2024 earnings release (8-K Exhibit 99.1) · Carnival Corporation (SEC EDGAR) · Tier 1: company or exchange filing · Dec 20, 2024
- S152026 proxy statement (DEF 14A), Carnival Corporation & plc · Carnival Corporation (SEC EDGAR) · Tier 1: company or exchange filing · Feb 27, 2026
- S168-K filed May 7, 2026: completion of DLC unification and redomiciliation to Bermuda · Carnival Corporation Ltd. (SEC EDGAR) · Tier 1: company or exchange filing · May 7, 2026
- S178-K Exhibit 99.1 filed May 7, 2026: press release on completing the DLC unification · Carnival Corporation Ltd. (SEC EDGAR) · Tier 1: company or exchange filing · May 7, 2026
- S188-K filed Aug 5, 2026: redemption of 7.000% notes due 2029; collateral released on second investment grade rating (Jun 25, 2026) · Carnival Corporation Ltd. (SEC EDGAR) · Tier 1: company or exchange filing · Aug 5, 2026
- S198-K filed Nov 4, 2026: $2.0 billion commercial paper program · Carnival Corporation Ltd. (SEC EDGAR) · Tier 1: company or exchange filing · Nov 4, 2026
- S20Schedule 13D/A (Amendment No. 28) by the Arison Group (MA 1994 B Shares, Micky Arison, Richard L. Kohan, KLR, Nickel 2015-94 B Trust) · SEC EDGAR · Tier 1: company or exchange filing · Nov 26, 2025
- S21Schedule 13G by BlackRock, Inc. (event date Jun 30, 2026) · SEC EDGAR · Tier 1: company or exchange filing · Jul 27, 2026
- S22Schedule 13G by Vanguard Capital Management (event date Mar 31, 2026) · SEC EDGAR · Tier 1: company or exchange filing · Apr 29, 2026
- S23Schedule 13G/A by The Vanguard Group reporting 0 shares (event date Mar 13, 2026) · SEC EDGAR · Tier 1: company or exchange filing · Mar 26, 2026
- S24SEC XBRL company facts for Carnival (CIK 0000815097): FY2021 balance sheet, diluted shares, historical dividends · SEC (data.sec.gov) · Tier 1: company or exchange filing · Nov 6, 2026
- S25EDGAR submissions index for Carnival Corp Ltd. (CIK 0000815097): name change and filing dates · SEC (data.sec.gov) · Tier 1: company or exchange filing · Nov 6, 2026
- S26CCL historical daily prices, Nasdaq's table for an NYSE-listed share (close of Nov 5, 2026: $29.59) · Nasdaq, Inc. · Tier 1: company or exchange filing · Nov 5, 2026
Changes to this page (v1 · Nov 6, 2026)
- v1 · Nov 6, 2026First version, through Q3 FY2026 (quarter ended Aug 31, 2026). (first version)
Numbers come only from tier 1 and tier 2 sources. Read how we research.
Disclaimer
For learning only. Cityfort is not a registered investment adviser or broker-dealer and does not recommend buying or selling any security. Prices shown are dated and may be out of date.
Investing in securities involves risk, including loss of capital. Before making any investment decision, do your own research and consider consulting a registered investment adviser or other qualified professional.
Cityfort, its owners and contributors may or may not hold securities of companies covered. Cityfort is not paid by any company it covers. Content is not an offer or solicitation to buy or sell any security, including in any initial public offering.
Read the positions policyRead the full disclaimerHide the full disclaimer
Cityfort publishes general educational content that explains how listed companies work. Cityfort is not registered with the US Securities and Exchange Commission or any state securities regulator as an investment adviser, and is not a broker-dealer or a member of FINRA. Cityfort does not provide investment, tax or legal advice, recommendations, ratings, price targets or any opinion on whether to buy, sell or hold any security. Nothing on the site is tailored to any person's circumstances.
All information is taken from publicly available sources, mainly company filings with the SEC, which are listed on each page with dates. We work to keep it accurate and correct errors publicly, but we do not guarantee that it is complete, accurate or up to date. Any market price or price-based ratio shown is dated, may be out of date by the time you read it, and is included only to explain concepts.
Statements by company management, including forward-looking statements and guidance, are reported as the company's statements, with their date and source; they are not our forecasts. Adjusted (non-GAAP) figures are the company's own measures and are shown next to the official (GAAP) figures.