Financials · NYSE: APO
Apollo: how the business works
Apollo invests money for pension funds, insurers and individuals and sells annuities through its insurer Athene, with revenue of $32.0 billion in FY2025.
By Hardik Bhandare · Checked against filings: . Editorial policy. Corrections
Follow Apollo
Email me when Apollo's page is updated after earnings.
We'll send a confirmation email first. See our privacy policy.
Apollo Global Management, Inc. · New York, New York · Founded 1990
Updated for Q3 FY2026 · checked
- Revenue, FY2025
- $32.0B
- Net income for common stockholders, FY2025
- $3.4B
- Assets under management, Sep 30, 2026
- $1.07 trillion
- Held by directors and executive officers, Apr 1, 2026
- 8.3%
- Founded
- 1990
The short version
Apollo in 5 points
1 · What it sells
Apollo invests money for pension funds, insurers and individuals, mostly in credit, and sells annuities through its insurer Athene, with $1,073.6 billion of assets under management at Sep 30, 2026.
2 · Who pays it
In FY2025, Athene's savers and institutions brought in 84.4% of Apollo's revenue, and fund investors paying management, advisory and incentive fees brought in 15.6%.
3 · What it keeps from $100
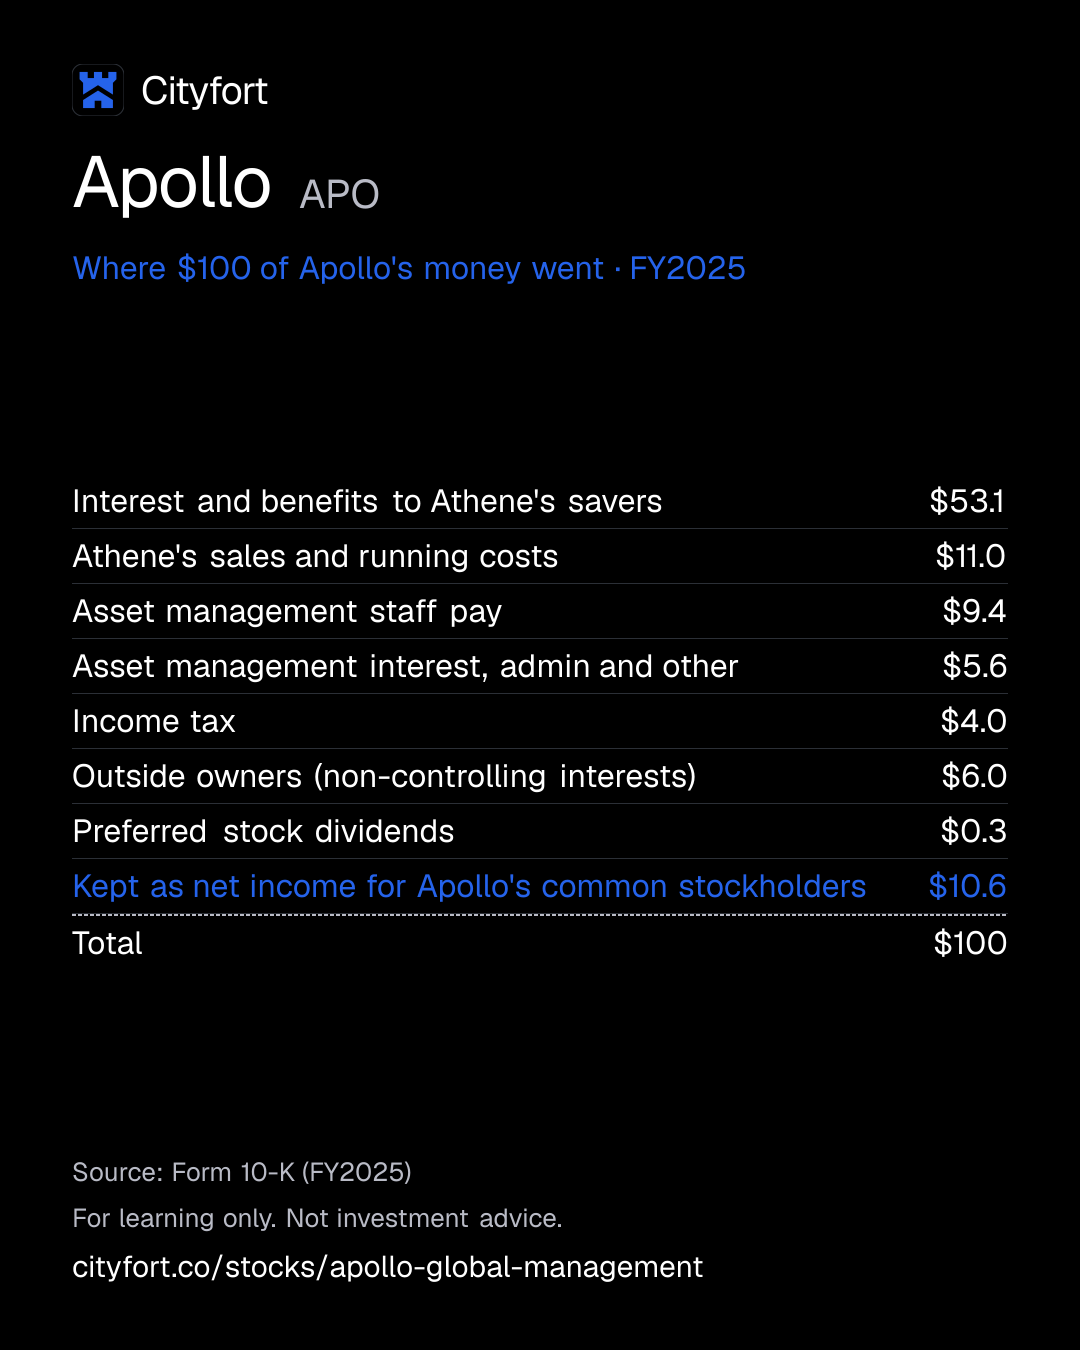
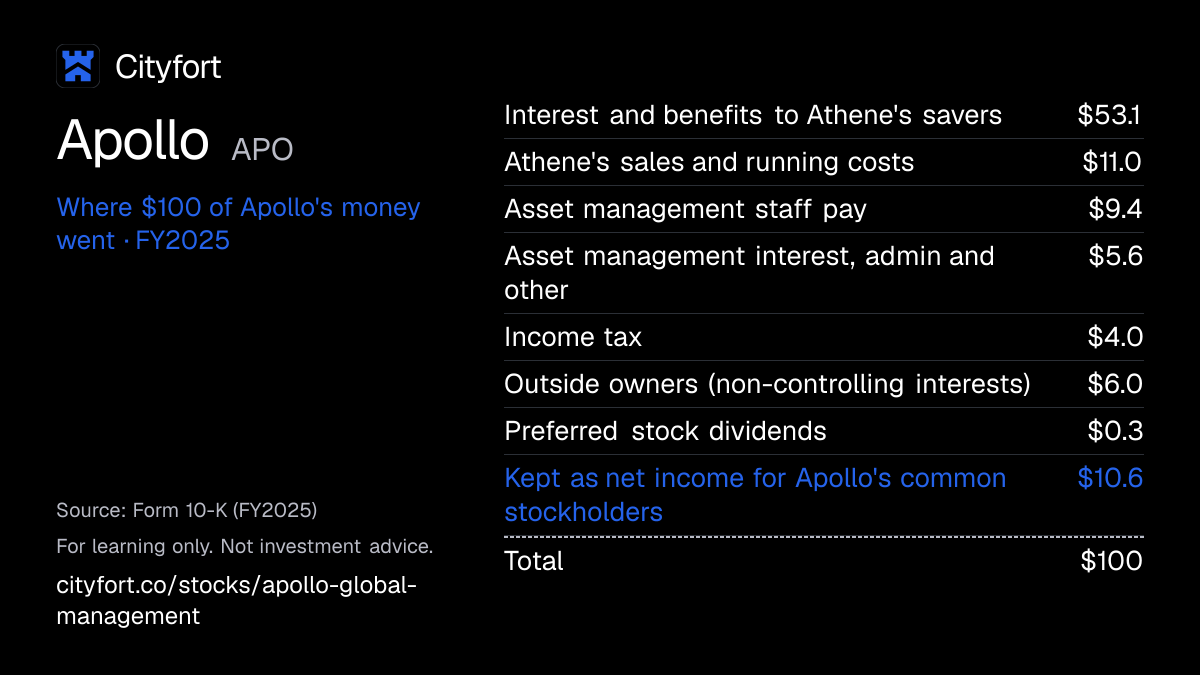
Of every $100 that came in during FY2025, Apollo kept $10.6 as net income for common stockholders after $53.1 went to Athene's savers and $6.0 to outside owners; it reports no operating income line, and income before tax was $6,677 million.
4 · Where the operating profit comes from
Retirement Services gave $3,361 million of FY2025 segment income, Apollo's own measure, ahead of Asset Management at $2,528 million and Principal Investing at $338 million.
5 · The one thing to watch
Athene's spread related earnings, Apollo's own segment measure, were $2,440 million in the first nine months of FY2026, down from $2,496 million, while fee related earnings, also its own measure, rose to $802 million in Q3 FY2026 from $652 million.
Sources: From Apollo's FY2025 10-K and Q3 FY2026 10-Q · checked
01Where the money goes · FY2025
Where does $100 of Apollo's money go?
Apollo · FY2025
Receipt for every $100
| Interest and benefits to Athene's savers | $53.1 |
|---|---|
| Athene's sales and running costs | $11.0 |
| Asset management staff pay | $9.4 |
| Asset management interest, admin and other | $5.6 |
| Income tax | $4.0 |
| Outside owners (non-controlling interests) | $6.0 |
| Preferred stock dividends | $0.3 |
| Kept as net income for Apollo's common stockholders | $10.6 |
| Total | $100 |
Each line = amount ÷ total money in × 100. Lines may not add to exactly $100 because of rounding.
How this is worked out
Cityfort calculation from the FY2025 10-K. Of every $100 that came in during FY2025 (revenue of $32,049 million minus $83 million of other losses): each line = line ÷ $31,966 million × 100. Savers' interest and benefits combine three Athene expense lines ($12,089 million, $4,433 million and $452 million). Net income is the part left for common stockholders after $97 million of preferred stock dividends.
Save this receipt as an image
Embed this receipt or the key numbers
Paste this code into a blog or website to show the card you choose, with a link back to this page.
Each week: the next company due to report earnings, explained in 5 points.
No tips. Unsubscribe anytime.
We'll send a confirmation email. See our privacy policy.
02The business in one line
What does Apollo do?
Savers buy annuities from Apollo's insurer Athene, and funds pay Apollo to invest their money. Most of that money goes back to savers as interest and benefits; what is left is profit.
- Athene's savers and institutions were 84.4% of Apollo's FY2025 revenue; fund investors paying fees were 15.6%.
- Of every $100 that came in during FY2025, $53.1 went on savers' interest and benefits and $11.0 on Athene's sales and running costs; Apollo kept $10.6 as net income for its common stockholders.
03Who pays it
Who pays Apollo?
Savers and institutions using Athene
84.4%
of revenue
Individuals buy annuities; institutions buy funding agreements and pension group annuities. Athene earns investment income on their money. Retirement Services was $27,049 million of FY2025 revenue.
Fund investors
15.6%
of revenue
Pension, endowment and sovereign wealth funds, insurers and individual investors pay management, advisory and incentive fees. Asset Management was $5,000 million of FY2025 revenue.
Athene, Apollo's own insurer
Share of revenue not disclosed
Athene paid the asset management arm $1,441 million of fees in FY2025. These fees cancel out in the combined accounts.
- Savers and institutions using Athene84.4%
- Fund investors15.6%
How spread out the customers are
Apollo does not disclose any outside customer's share of revenue. Apollo managed or advised $392.2 billion of AUM for its own insurer, Athene, at Dec 31, 2025.
04How it makes money
How does Apollo make money?
Apollo earns fees on money it manages and a spread on Athene's annuity savings.
The asset manager charges fees on AUM, which reached $1,073.6 billion at Sep 30, 2026. Athene invests savers' money and keeps the gap between what the investments earn and what it credits savers. Apollo calls that gap the net investment spread; it was 1.61% in FY2025.
Athene's net investment spread
1.9%1.6%
FY2023 to FY2025
- Athene sells annuities and takes in savers' money
- Apollo's asset managers invest much of it, mostly in credit
- Athene earns investment income and credits savers a lower rate
- The asset manager earns fees from Athene and outside clients
- Fees and the spread pay staff, interest, tax and dividends
↺ Step 5 feeds back into step 1.
Sources (1)
05Business segments · FY2025
Which businesses make up Apollo?
Asset Management
22.1%Runs credit and equity funds for clients and Athene; profit here is fee related earnings: fees minus the pay and running costs tied to them. Segment revenue is Apollo's own measure: the three segments add to $20,209 million, not GAAP revenue of $32,049 million.
Revenue $4.5B ($4,465M) · Operating profit $2.5B ($2,528M)
Retirement Services
71.5%Athene's annuity business; profit here is spread related earnings, investment income minus the cost of savers' money and running costs.
Revenue $14.5B ($14,451M) · Operating profit $3.4B ($3,361M)
Principal Investing
6.4%Realized performance fees and income on Apollo's own investments, after the pay tied to them.
Revenue $1.3B ($1,293M) · Operating profit $338M
How the mix changed
- Asset Management
- Retirement Services
- Principal Investing
Revenue by segment, FY2023 to FY2025.
US$
See the numbers
Sources (1)
06The numbers · Consolidated · US$
How has Apollo done?
Revenue
$32.0BFY2025
Revenue rose to $32,644 million in FY2023, when Athene booked $12,749 million of premiums including large pension annuity deals, and was $32,049 million in FY2025.
US$
See the numbers
Net income
$3.4BFY2025
Net income for Apollo's common stockholders fell from $5,001 million in FY2023 to $3,395 million in FY2025, and Q3 FY2026 showed a $1,057 million loss after $3,418 million of investment-related losses at Athene.
US$
See the numbers
Net income for every $100 of revenue
$10.6FY2025
Apollo kept $10.6 of every $100 of revenue as net income for common stockholders in FY2025, down from $17.2 in FY2024.
Net margin: $ of net income per $100 of revenue
See the numbers
Cash from operations was $7,246 million in FY2025, up from $3,253 million in FY2024; Apollo reports no capital spending line, so free cash flow is not shown.
See all yearly numbers
EBITDA here = operating income plus depreciation and amortization (from the cash flow statement). Fiscal years are the company's own: Fiscal year ends Dec 31. Net income is the share belonging to the company's owners. Total net income differs from net profit to the company's owners: Total net income includes the share of outside owners (non-controlling interests), mostly in Athene-related and fund entities; net profit is the part left for Apollo Global Management, Inc. common stockholders after preferred stock dividends.
Learn: Fiscal years that don't end in December: Nvidia's FY2027 explained · Stock-based compensation and dilution: pay that becomes shares
Sources (13)
07Who runs it
Who runs Apollo, and did they deliver?
Marc Rowan
Co-founder, Chief Executive Officer and Chair
Owned 5.9% of the shares at Apr 1, 2026 (2026 proxy).
James Zelter
President · since 2025
Oversees operations and strategy across asset management and retirement services.
Martin Kelly
Chief Financial Officer
Signs the 10-Q certifications as CFO.
James Belardi
Executive Chairman and Chief Investment Officer of Athene
Co-founded Athene; on Apollo's board since January 2022.
Scott Kleinman
Co-President of Apollo Asset Management
On Apollo's board since January 2022.
Gary Cohn
Lead Independent Director · since 2025
Joined the board in April 2025; Vice Chairman of IBM since 2021.
08What could go wrong
What could go wrong for Apollo?
- Other
Investment swings can turn profit into loss
In Q3 FY2026 Athene booked $3,418 million of investment-related losses, against $2,254 million of gains a year earlier. Apollo reported a $1,057 million net loss for its common stockholders that quarter.
Watch Investment related gains (losses) and net income in each 10-Q.
- Pricing
A thinner spread at Athene
Athene's net investment spread fell from 1.93% in FY2023 to 1.61% in FY2025, while its cost of funds rose from 2.71% to 3.69%. In the first nine months of FY2026, spread related earnings, Apollo's own segment measure, were $2,440 million, down from $2,496 million.
Watch Net investment spread in the 10-K and spread related earnings each quarter.
- Concentration
Much of its AUM is its own insurer's money
Apollo managed or advised $426.6 billion of AUM for its own insurer, Athene, at Sep 30, 2026, and Athene paid the asset manager $1,441 million of fees in FY2025. Withdrawals from Athene's investment-type policies were $22,657 million in FY2025.
Watch Deposits and withdrawals on Athene's policies in the cash flow statement.
- Legal
Lawsuits involving founders and executives
Delaware suits allege that $570 million of 2022 payments to former managing partners exceeded fair value and that parts of the 2022 stockholders agreement violate Delaware law. Federal class actions allege securities law violations over statements about Jeffrey Epstein. Apollo says no reasonable estimate of possible loss can be made.
Watch Court rulings reported in the legal note of each 10-Q.
- Regulation
Insurance rules in two countries
Athene's insurers are regulated in the US and in Bermuda, where the Bermuda Monetary Authority supervises Athene. Athene says the capital needed to keep its desired financial strength ratings is a particular concern when deciding how much capital it can pay out.
Watch Athene's financial strength ratings and capital rule changes in Bermuda or US states.
- Debt
Rising debt
Debt rose from $10,588 million at Dec 31, 2024 to $14,749 million at Sep 30, 2026, across the asset manager and Athene. Apollo added $600 million of 7.550% junior subordinated notes in Nov 2026.
Watch Total debt in each 10-Q and new note issues in 8-K filings.
09Supporters vs. critics
What do supporters and critics point to?
What supporters point to
- Assets under management reached $1,073.6 billion at Sep 30, 2026, up 14.4% from Dec 31, 2025.
- Fee related earnings, Apollo's own asset management measure, rose to $802 million in Q3 FY2026 from $652 million a year earlier.
- At Dec 31, 2025, $535.6 billion of the $938.4 billion of AUM was what Apollo calls perpetual capital.
- Cash of $18,344 million exceeded debt of $13,364 million at Dec 31, 2025 (Cityfort calculation from the FY2025 10-K).
- The quarterly dividend rose to $0.5625 from May 2026, and the board approved buybacks of up to $4.0 billion on Feb 9, 2026.
What critics point to
- Athene's net investment spread fell from 1.93% in FY2023 to 1.61% in FY2025, while its cost of funds rose from 2.71% to 3.69%.
- Apollo reported net losses for common stockholders of $1,930 million in Q1 FY2026 and $1,057 million in Q3 FY2026, after net income for common stockholders of $3,395 million in FY2025.
- Debt rose from $10,588 million at Dec 31, 2024 to $14,749 million at Sep 30, 2026.
- Apollo managed $426.6 billion of AUM for its own insurer, Athene, at Sep 30, 2026, out of $1,073.6 billion in total.
- Pending suits allege that $570 million of 2022 payments to former managing partners exceeded fair value, and that statements about Jeffrey Epstein violated federal securities laws.
10What to watch next
What should you watch next at Apollo?
Next event
Q4 FY2026 results
Date not announced yet.
Investment gains and losses at Athene
Athene booked $3,418 million of investment-related losses in Q3 FY2026, against $2,254 million of gains a year earlier.
Spread related earnings
Spread related earnings, Apollo's own segment measure for Athene, were $2,440 million in the first nine months of FY2026, down from $2,496 million; the FY2026 10-K will give the full year.
Delaware court rulings
Oral argument on Apollo's motion to dismiss the stockholders agreement class action was scheduled for Nov 17, 2026; the filings used for this page give no outcome.
New debt
Apollo added $600 million of 7.550% junior subordinated notes in Nov 2026, after debt of $14,749 million at Sep 30, 2026.
11Key dates
What are the key dates for Apollo?
| Event | Date | Source |
|---|---|---|
| Quarterly dividend of $0.5625 payableTo holders on record on Nov 18, 2026; declared Nov 3, 2026. | Apollo Reports Third Quarter 2026 Results (8-K Ex. 99.1) | |
| Fiscal 2026 endsApollo's fiscal year is the calendar year. | Form 10-Q for Q3 FY2026 | |
| Meyer "Micky" Malka joins the boardThe board grows to 14 directors; the board determined he is independent under NYSE standards. | Apollo 8-K filed Oct 20, 2026 (Items 5.02, 7.01, 9.01): board appointment |
Learn: What is an 8-K? A company's news report, with a real Adobe filing · Fiscal years that don't end in December: Nvidia's FY2027 explained
12Key facts
Key facts about Apollo
- What does Apollo Global Management do?
- Apollo Global Management invests money for clients such as pension funds and insurers, and sells annuities and other retirement savings products through its insurer, Athene. Its assets under management were $1,073.6 billion at Sep 30, 2026.
- How does Apollo Global Management make money?
- Apollo earns fees on the money it manages and a spread on Athene's annuity savings: the gap between what the investments earn and what Athene credits savers. Athene's net investment spread was 1.61% in FY2025.
- Who are Apollo Global Management's customers?
- In FY2025, Athene's savers and institutions accounted for 84.4% of Apollo Global Management's revenue ($27,049 million), and fund investors paying fees for 15.6% ($5,000 million). Apollo does not disclose any outside customer's share of revenue.
- How big is Apollo Global Management?
- Apollo reported revenue of $32,049 million in FY2025 and net income attributable to Apollo Global Management, Inc. common stockholders of $3,395 million. Total net income, including outside owners, was $5,401 million.
- Who owns Apollo Global Management?
- There is one class of common stock with one vote per share, and 576,519,062 shares were outstanding on Apr 17, 2026. No holder in the 2026 proxy owned more than 6.6% (Leon Black), and directors and executive officers together held 8.3%.
- Does Apollo Global Management pay a dividend?
- Apollo paid dividends of $1.99 per share for FY2025 and $0.5625 a quarter from May 2026. In FY2025 it spent $1,201 million on common dividends and $773 million on buybacks.
- How much debt does Apollo Global Management have?
- Debt was $14,749 million at Sep 30, 2026: $5,936 million at the asset management arm and $8,813 million at Athene. Apollo's stockholders' equity was $15,949 million on that date.
Terms on this page
Each explains the term in plain English, with the same number from other companies on Cityfort.
Go deeper
More detail from the same filings. Open any section.
13What it sells
13What it sells
What does Apollo sell?
Credit funds and accounts
Loans, bonds and asset-backed lending that Apollo arranges or buys for clients. Credit held $749.2 billion of the $938.4 billion of assets under management (AUM, money it manages) at Dec 31, 2025.
Equity funds
Stakes in companies, real estate and infrastructure, including private equity buyouts. Equity held $189.2 billion of AUM at Dec 31, 2025.
Annuities and funding agreements (Athene)
Athene issues, reinsures and buys retirement savings products: fixed and indexed annuities, payout annuities, pension group annuities and funding agreements sold to institutions.
Principal investing
Apollo's share of profits when its funds sell investments (realized performance fees), plus returns on its own money invested in the funds.
What it does
- Does: Charges clients management fees on the money it runs
- Does: Takes in annuity savers' money through Athene and invests it
- Does: Earns a share of fund profits once investments are sold
What it does not do
- Does not: Is not a bank: Athene's savers buy insurance contracts, not deposits
- Does not: Does not split Athene's revenue by country; it says Athene's revenue comes mainly from the US and Bermuda
Sources (2)
14How the money flows
14How the money flows · FY2025
How does money flow through Apollo?
Money in
- Retirement Services revenue (Athene: investment income, premiums, charges, gains)$27.0B
- Asset Management revenue (fees and investment income)$5.0B
- Other losses, net−$83M
The company
Apollo
$32.0B came in
Money out
- Interest and benefits credited to Athene's savers and policyholders$17.0B
- Athene's sales and running costs$3.5B
- Asset management staff pay$3.0B
- Asset management interest, admin and other costs$1.8B
- Income tax$1.3B
- Share of outside owners (non-controlling interests)$1.9B
- Preferred stock dividends$97M
- Net income attributable to Apollo Global Management, Inc. common stockholders$3.4B
- Athene's revenue was $27,049 million in FY2025. Of that, $19,245 million was net investment income on the money it holds for savers.
- The asset management arm earned $5,000 million, including $2,378 million of management fees.
- Most of Athene's money went back to savers: $16,974 million of credited interest and benefits. Athene's sales and running costs took $3,520 million.
- Asset management staff took $2,993 million and other asset management costs $1,802 million. Other items cost a net $83 million, leaving $6,677 million before tax.
- After $1,276 million of tax, $1,909 million for outside owners and $97 million of preferred stock dividends, $3,395 million was left for Apollo's common stockholders.
Sources (1)
15What it needs to run
15What it needs to run
What does Apollo need to run?
Savers' money at Athene
Deposits on Athene's investment-type policies were $81,183 million in FY2025, while withdrawals were $22,657 million.
Investment staff
About 4,130 asset management employees, including about 600 who joined with Bridge, and about 2,010 Retirement Services employees at Dec 31, 2025.
Insurance licenses and ratings
Athene's insurers are regulated in the US and Bermuda. At Dec 31, 2025, four agencies rated its main insurance subsidiaries A+ or A1 for financial strength.
Borrowed money
Debt was $14,749 million at Sep 30, 2026: $5,936 million at the asset management arm and $8,813 million at Athene.
Sources (2)
16Competitors and what protects it
16Competitors and what protects it
Who does Apollo compete with?
Blackstone
NYSE: BX
In Apollo's 2026 proxy pay peer group of 10 firms, picked after reviewing AUM, market valueShare price × number of shares: what all the shares were worth at one dated price. Learn more and business mix.
KKR
NYSE: KKR
In the same 10-firm pay peer group named in Apollo's 2026 proxy statementThe yearly filing about shareholder votes, the board and executive pay. Learn more.
Ares
In the same 10-firm pay peer group named in Apollo's 2026 proxy statement.
Carlyle
In the same 10-firm pay peer group named in Apollo's 2026 proxy statement.
Brookfield Asset Management
In the same 10-firm pay peer group named in Apollo's 2026 proxy statement.
What protects the business
Each strength is scored 1 (weak) to 5 (strong) for the business, with the reason. It is not a rating of the share.
- Scale of assets managed4 of 5
AUM reached $1,073.6 billion at Sep 30, 2026, up from $650.8 billion at Dec 31, 2023.
- Long-term capital4 of 5
At Dec 31, 2025, $535.6 billion of the $938.4 billion of AUM was what Apollo calls perpetual capital, such as publicly traded and non-traded vehicles and origination platform assets.
- An in-house insurer as client3 of 5
Athene paid the asset manager $1,441 million of fees in FY2025, up from $955 million in FY2023.
Weak spot
Thinner spread at Athene
Athene's net investment spread fell from 1.93% in FY2023 to 1.61% in FY2025. Over the same years its cost of funds rose from 2.71% to 3.69%.
17Where growth could come from
17Where growth could come from
Where could Apollo's growth come from?
Apollo's earnings releases give no numeric targets. In the Q3 FY2026 release, CEO Marc Rowan said the company's core earnings power is growing and described its setup for 2027 as strong.
Assets under management
Working$1,073.6B at Sep 30, 2026
Up 14.4% from Dec 31, 2025. The Q3 FY2026 10-Q names client subscriptions, Athora's purchase of Pension Insurance Corporation and Athene's growth among the sources.
Status: Working, on track against what the company said.
Fee related earnings (company measure)
Working$802M in Q3 FY2026
Up from $652 million in Q3 FY2025. Management fees in the segment rose to $1,017 million from $863 million.
Status: Working, on track against what the company said.
Spread related earnings at Athene (company measure)
Mixed$2,440M, first 9 months of FY2026
Down from $2,496 million a year earlier. In Q3 FY2026, Athene's cost of funds was $3,224 million against $2,661 million a year before.
Status: Mixed, partly on track.
Origination
Working$114B in Q3 FY2026
Management said in the Q3 FY2026 release that origination, the loans and assets Apollo sources itself, reached a record $114 billion in the quarter.
Status: Working, on track against what the company said.
Bridge Investment Group
NewBought Sep 2, 2025
An all-stock deal: Apollo issued 9,736,433 shares. The FY2025 10-K counts $34.2 billion of equity AUM inflow from the purchase.
Status: New, recently announced.
Status compares progress with what the company itself said it would do: Working = on track against what the company said; Mixed = partly on track; Behind = behind the company's own plan; New = recently announced; Early = too early to judge.
18The company's own measures (non-GAAP)
18The company's own measures · FY2025 and Q3 FY2026
What do Apollo's own measures show?
Official (GAAP): Net income attributable to Apollo Global Management, Inc. common stockholders, FY2025
$3.4B
Company's own measure: Fee related earnings, FY2025
$2.5B
Apollo's profit measure for asset management: management fees, capital solutions fees and fee-related performance fees, minus the pay and running costs tied to them.
Official (GAAP): Net income attributable to Apollo Global Management, Inc. common stockholders, FY2025
$3.4B
Company's own measure: Spread related earnings, FY2025
$3.4B
Athene's investment income minus its cost of funds, running costs and financing costs, on Apollo's segment basis.
Official (GAAP): Income before income tax, FY2025
$6.7B
Company's own measure: Segment income, FY2025
$6.2B
Fee related earnings plus spread related earnings plus principal investing income. Apollo's reconciliation to GAAP adds back outside owners' share and deducts stock-based payPay given as shares instead of cash, which spreads ownership more thinly. Learn more and deal costs, among other items.
Official (GAAP): Net loss attributable to Apollo Global Management, Inc. common stockholders, Q3 FY2026
−$1.1B
Company's own measure: Fee related earnings, Q3 FY2026
$802M
The same asset management measure for one quarter; it was $652 million in Q3 FY2025.
Official (GAAP): Loss before income tax, Q3 FY2026
−$1.5B
Company's own measure: Segment income, Q3 FY2026
$1.7B
The segment measure stayed positive in a quarter when GAAP results included $3,418 million of investment-related losses at Athene.
Official (GAAP): Total assets on the balance sheet, Sep 30, 2026
$498.3B
Company's own measure: Assets under management, Sep 30, 2026
$1.07T
Money Apollo manages for outside clients, Athene and itself. Most outside clients' money is not on Apollo's balance sheet.
These are the company's own measures, defined by the company. They are not comparable across companies, and they are not added together. Each sits beside the nearest official (GAAP) figure.
Learn: Non-GAAP measures: what a company's "adjusted" numbers leave out · Stock-based compensation and dilution: pay that becomes shares
Sources (2)
19Financial strength and debt
19Financial strength · Dec 31, 2025
How much debt does Apollo have?
- Total debt$13.4B
- Cash and investments$18.3B
- Net cash (cash minus debt)$5.0B
- Net worth (shareholders' money)$23.3B
- Debt to equity
- 0.57×
- $ of debt for every $1 of shareholders' money
- Debt was $13,364 million ($5,516 million at the asset management arm and $7,848 million at Athene) and cash $18,344 million, per the FY2025 10-K; cash exceeded debt by $4,980 million (Cityfort calculation from the FY2025 10-K).
- Apollo's largest obligations are to savers, not lenders: Athene owed $315,889 million on interest-sensitive contracts and $50,264 million of future policy benefits at Dec 31, 2025.
- At Sep 30, 2026, debt was $5,936 million at the asset management arm plus $8,813 million at Athene, and Apollo's stockholders' equity was $15,949 million, per the Q3 FY2026 10-Q.
- Apollo sold $750 million of 5.700% senior notes due 2036, partly to retire $500 million of 4.400% notes due 2026 (8-K filed Mar 30, 2026). It added $600 million of 7.550% junior subordinated notes due 2056 (8-K filed Nov 13, 2026).
- Equity here is stockholders' equity of Apollo Global Management, Inc. Total equity, including outside owners, was $42,515 million at Dec 31, 2025.
20Who owns it
20Who owns it · ownership as of Apr 1, 2026
Who owns Apollo?
- Officers and directors (as a group), shares
- 8.3%
Share classes
Holders of 5% or more
From the company's proxy statement (DEF 14A), later Schedule 13G filings and the share counts on its latest annual or quarterly report. Each holder row shows the date of its own filing.
Learn: How to read a proxy statement (DEF 14A): Nvidia's 2026 proxy · Form 4 insider filings: who files, the codes and the footnotes
21What it does with profit
21What it does with profit
What does Apollo do with its profit?
Dividend per share
$1.99FY2025
Dividend paid for each share, by financial year.
$ per share
See the numbers
No buybacks or fund raises in the period covered.
Sources (1)
22Governance signals
22Governance signals
What do Apollo's governance filings show?
- Auditor
- Deloitte & Touche LLP, since 2007
- Auditor changes
- None in the period covered
- Audit qualifications
- None reported
- Related-party dealings
- Athene, Apollo's own insurer, paid the asset management arm $1,441 million of fees in FY2025; these cancel out in the combined accounts. Apollo also advises Athora, a European retirement group, and a Jan 1, 2022 stockholders agreement gives former managing partners certain rights.
- Credit rating
- Four agencies; the Q3 FY2026 10-Q names S&P Global, A.M. Best, Fitch and Moody's A+ or A1 (financial strength of Athene's significant insurance subsidiaries, not Apollo's own debt) (outlook Not stated in the filings), Dec 31, 2025
A credit rating describes the company's ability to repay debt. It is not a rating of the share.
Flags to know about
other · Nov 5, 2026
Lawsuit over 2022 payments to former managing partners
A purported stockholder's derivative suit in the Delaware Court of Chancery alleges that $570 million paid to former managing and contributing partners when Apollo ended its Up-C structure exceeded fair value. The court denied a motion to dismiss on Sep 20, 2024; proceedings are stayed while the parties discuss mediation.
other · Nov 5, 2026
Class action over the stockholders agreement
A class action by a purported stockholder in the Delaware Court of Chancery alleges that parts of the Jan 1, 2022 stockholders agreement with the former managing partners violate Delaware law. Apollo says the claims are without merit; oral argument on its motion to dismiss was scheduled for Nov 17, 2026.
other · Nov 5, 2026
Securities class actions about statements on Jeffrey Epstein
Consolidated class actions in federal court in New York allege violations of federal securities laws by Apollo, Marc Rowan and Leon Black. They challenge public statements in 2021 and 2022 that Apollo never did any business with Jeffrey Epstein; Apollo says it intends to defend against the claims.
disclosure · Nov 20, 2026
No rating of Apollo's own debt in the filings used
The 10-K gives financial strength ratings for Athene's insurers only. Ratings of Apollo's own notes were not found in the filings used for this page.
23How it got here
23How it got here
How did Apollo get here?
1990
Milestone
Apollo founded
Apollo began in 1990; it now calls itself an alternative asset manager and a retirement services provider.
2022
Business-model change
Merger with Athene
Apollo merged with the annuity insurer Athene and ended its Up-C structure, moving to one class of common stock with one vote per share.
2023
Milestone
Pension deals lift Athene's premiums
Athene booked $12,749 million of premiums in FY2023, including large pension group annuity deals, against $1,318 million in FY2024.
2025
Milestone
Bridge Investment Group bought
Apollo completed the all-stock purchase of Bridge on Sep 2, 2025, issuing 9,736,433 shares.
2026
Milestone
New $4.0 billion buyback
On Feb 9, 2026 the board replaced its earlier buyback program with one of up to $4.0 billion.
2026
Milestone
AUM passes $1 trillion
Apollo said in its Q1 FY2026 release that AUM had passed $1 trillion; it was $1,073.6 billion at Sep 30, 2026.
2026
Milestone
Preferred stock converts
On Jul 31, 2026, all of Apollo's mandatory convertible preferred stock converted into common stock.
24Sources and changes
Where every number on this page comes from
Sources (19 documents)
- S1Form 10-Q for Q3 FY2026 · SEC EDGAR · Tier 1: company or exchange filing · Nov 5, 2026
- S2Form 10-Q for Q2 FY2026 · SEC EDGAR · Tier 1: company or exchange filing · Aug 10, 2026
- S3Form 10-Q for Q1 FY2026 · SEC EDGAR · Tier 1: company or exchange filing · May 7, 2026
- S4Form 10-K for FY2025 · SEC EDGAR · Tier 1: company or exchange filing · Feb 25, 2026
- S5Form 10-Q for Q3 FY2025 · SEC EDGAR · Tier 1: company or exchange filing · Nov 10, 2025
- S6Form 10-Q for Q2 FY2025 · SEC EDGAR · Tier 1: company or exchange filing · Aug 7, 2025
- S7Form 10-Q for Q1 FY2025 · SEC EDGAR · Tier 1: company or exchange filing · May 7, 2025
- S8Form 10-K for FY2024 · SEC EDGAR · Tier 1: company or exchange filing · Feb 24, 2025
- S9Form 10-Q for Q3 FY2024 · SEC EDGAR · Tier 1: company or exchange filing · Nov 6, 2024
- S10Form 10-Q for Q2 FY2024 · SEC EDGAR · Tier 1: company or exchange filing · Aug 8, 2024
- S11Form 10-Q for Q1 FY2024 · SEC EDGAR · Tier 1: company or exchange filing · May 7, 2024
- S12Form 10-K for FY2023 · SEC EDGAR · Tier 1: company or exchange filing · Feb 27, 2024
- S13Form 10-K for FY2022 · SEC EDGAR · Tier 1: company or exchange filing · Mar 1, 2023
- S14Apollo 2026 proxy statement (DEF 14A) · SEC EDGAR · Tier 1: company or exchange filing · Apr 24, 2026
- S15Apollo Reports Third Quarter 2026 Results (8-K Ex. 99.1) · SEC EDGAR · Tier 1: company or exchange filing · Nov 3, 2026
- S17Apollo Reports First Quarter 2026 Results (8-K Ex. 99.1) · SEC EDGAR · Tier 1: company or exchange filing · May 6, 2026
- S19Apollo 8-K filed Nov 13, 2026 (Items 1.01, 2.03, 8.01): junior subordinated notes · SEC EDGAR · Tier 1: company or exchange filing · Nov 13, 2026
- S20Apollo 8-K filed Mar 30, 2026 (Items 1.01, 2.03, 8.01): senior notes · SEC EDGAR · Tier 1: company or exchange filing · Mar 30, 2026
- S21Apollo 8-K filed Oct 20, 2026 (Items 5.02, 7.01, 9.01): board appointment · SEC EDGAR · Tier 1: company or exchange filing · Oct 20, 2026
Changes to this page (v1 · Nov 20, 2026)
- v1 · Nov 20, 2026First version. (first version)
Numbers come only from tier 1 and tier 2 sources. Read how we research.
Disclaimer
For learning only. Cityfort is not a registered investment adviser or broker-dealer and does not recommend buying or selling any security. Prices shown are dated and may be out of date.
Investing in securities involves risk, including loss of capital. Before making any investment decision, do your own research and consider consulting a registered investment adviser or other qualified professional.
Cityfort, its owners and contributors may or may not hold securities of companies covered. Cityfort is not paid by any company it covers. Content is not an offer or solicitation to buy or sell any security, including in any initial public offering.
Read the positions policyRead the full disclaimerHide the full disclaimer
Cityfort publishes general educational content that explains how listed companies work. Cityfort is not registered with the US Securities and Exchange Commission or any state securities regulator as an investment adviser, and is not a broker-dealer or a member of FINRA. Cityfort does not provide investment, tax or legal advice, recommendations, ratings, price targets or any opinion on whether to buy, sell or hold any security. Nothing on the site is tailored to any person's circumstances.
All information is taken from publicly available sources, mainly company filings with the SEC, which are listed on each page with dates. We work to keep it accurate and correct errors publicly, but we do not guarantee that it is complete, accurate or up to date. Any market price or price-based ratio shown is dated, may be out of date by the time you read it, and is included only to explain concepts.
Statements by company management, including forward-looking statements and guidance, are reported as the company's statements, with their date and source; they are not our forecasts. Adjusted (non-GAAP) figures are the company's own measures and are shown next to the official (GAAP) figures.