Financials · NYSE: COF
Capital One: how the business works
Capital One lends to credit card holders, car buyers and businesses and runs the Discover payment network, with total net revenue of $53.4 billion in FY2025.
By Hardik Bhandare · Checked against filings: . Editorial policy. Corrections
Follow Capital One
Email me when Capital One's page is updated after earnings.
We'll send a confirmation email first. See our privacy policy.
Capital One Financial Corporation · McLean, Virginia · Founded 1987
Updated for Q3 FY2026 · checked
- Total net revenue, FY2025
- $53.4B
- Net income for common stock, FY2025
- $2.2B
- Net income, Q3 FY2026
- $3.5B
- Loans, Sep 30, 2026
- $462.5B
- Deposits, Sep 30, 2026
- $480.7B
The short version
Capital One in 5 points
1 · What it sells
Capital One issues credit cards, makes car loans, lends to businesses, takes deposits and runs the Discover payment network, with $462.5 billion of loans at Sep 30, 2026.
2 · Who pays it
Capital One does not split revenue by customer; of the $69,252 million that came in during FY2025, card borrowers paid 59%, car buyers and other consumer borrowers 11%, merchants' card fees 9%, business borrowers 8%, account and card fees 4% and investments and other 9%.
3 · What it keeps from $100
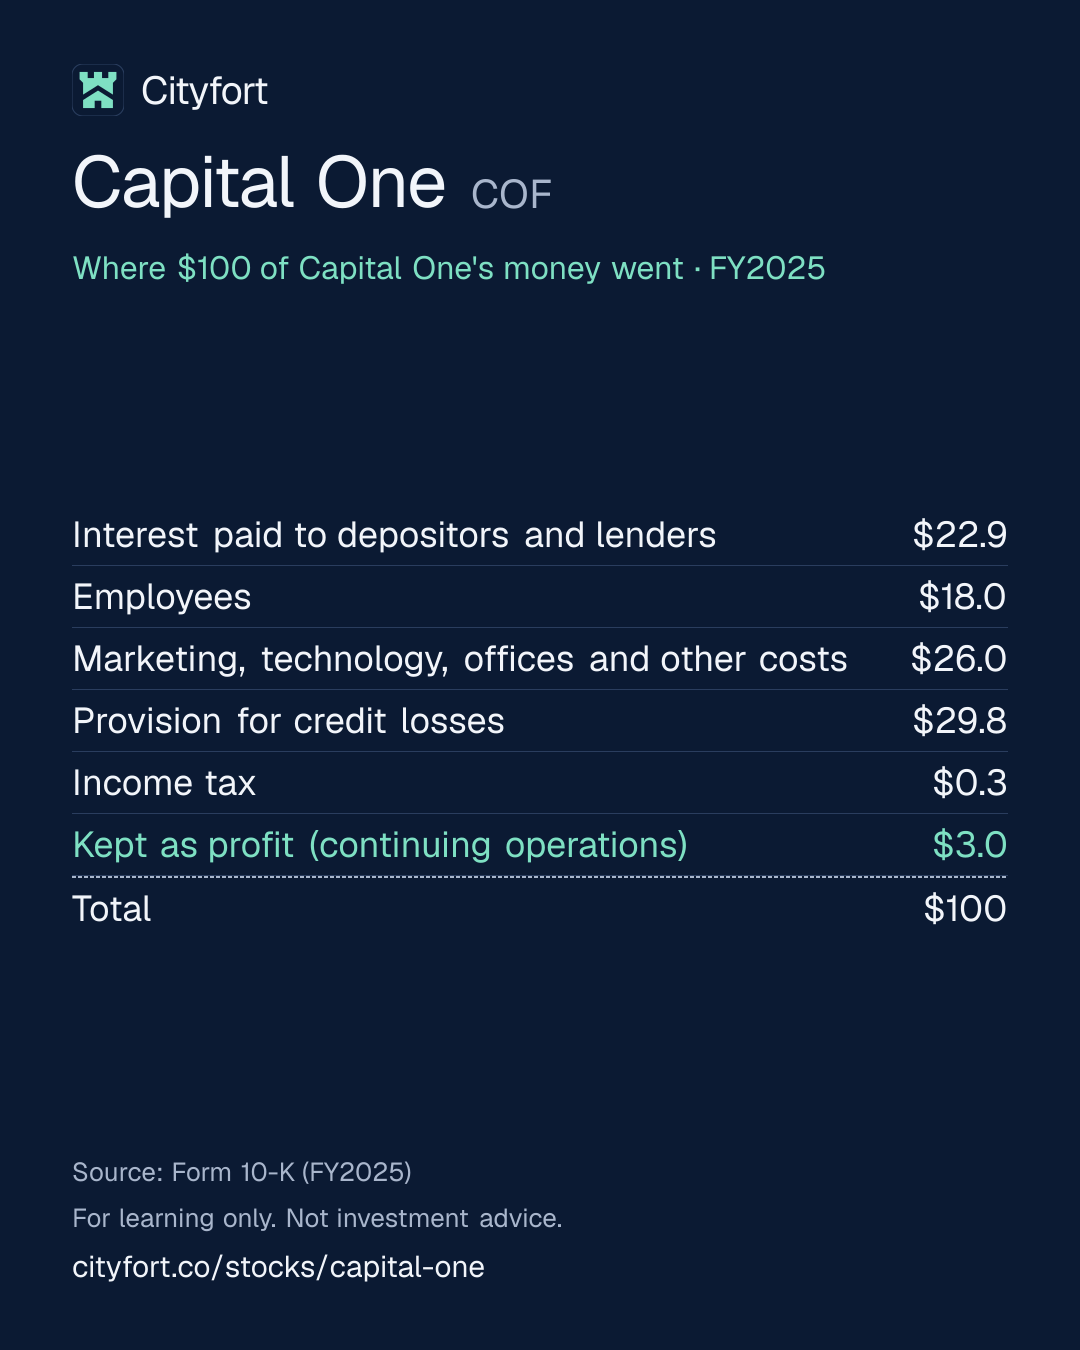
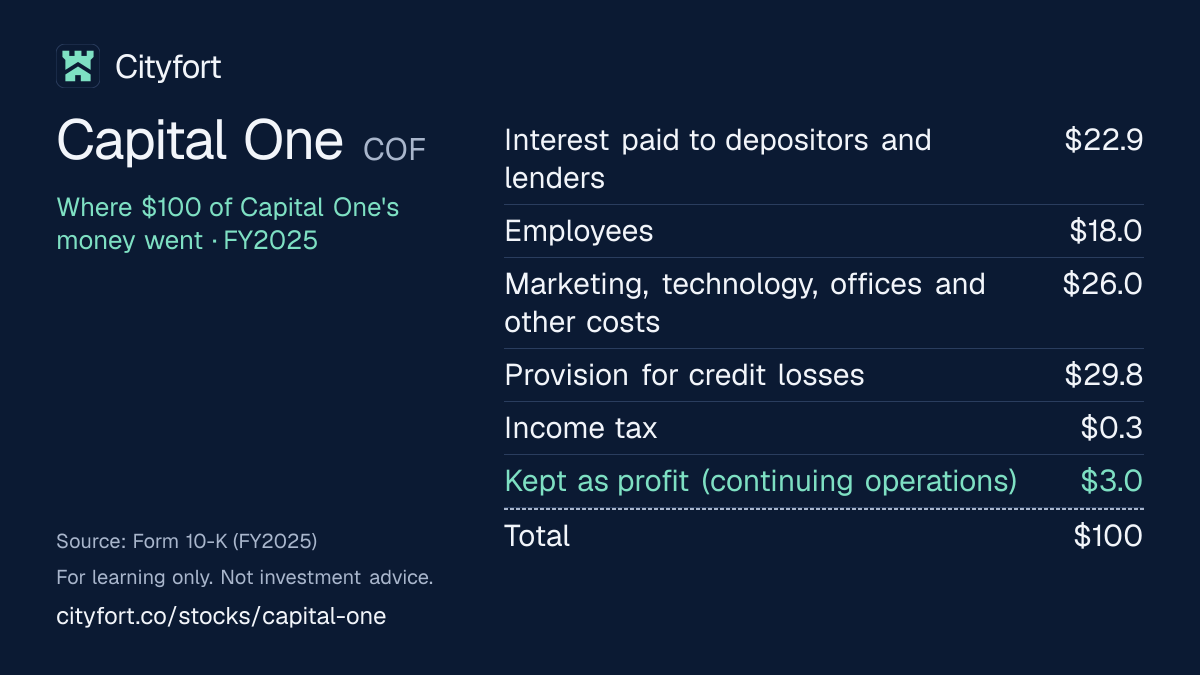
Of every $100 that came in during FY2025, Capital One paid $22.9 in interest, set aside $29.8 for credit losses, including the $8,767 million initial allowance for Discover loans, and kept $3.0 as profit from continuing operations.
4 · Where the operating profit comes from
In Q3 FY2026, Credit Card earned $2,859 million of the $3,539 million of net income, Consumer Banking $560 million and Commercial Banking $313 million, with a $193 million loss in Other.
5 · The one thing to watch
Net charge-offs were 3.30% of average loans in FY2025, up from 0.88% in FY2021, and 2.73% in Q3 FY2026.
Sources: From Capital One's FY2025 10-K, Q3 FY2026 10-Q and Q3 FY2026 earnings release and financial supplement · checked
See the full receipt and the management scorecard below
01Where $100 of a bank's money goes · FY2025
Where does $100 of Capital One's money go?
Capital One · FY2025
Receipt for every $100
| Interest paid to depositors and lenders | $22.9 |
|---|---|
| Employees | $18.0 |
| Marketing, technology, offices and other costs | $26.0 |
| Provision for credit losses | $29.8 |
| Income tax | $0.3 |
| Kept as profit (continuing operations) | $3.0 |
| Total | $100 |
Each line = amount ÷ total money in × 100. Lines may not add to exactly $100 because of rounding.
How this is worked out
Cityfort calculation from the FY2025 10-K. Of every $100 that came in during FY2025 (interest income $58,696 million plus noninterest income $10,556 million): each line = line ÷ $69,252 million × 100. Profit is income from continuing operations ($2,088 million); net income of $2,453 million also includes $365 million from the sold Discover Home Loan business. The provision includes the $8.8 billion initial allowance for acquired Discover loans.
Save this receipt as an image:
1080 × 1350 PNG for Instagram, LinkedIn1200 × 675 PNG for X
Embed this receipt
Paste this code into a blog or website to show the receipt, with a link back to this page:
Each week: one company explained in 5 points, picked by earnings date.
Free, no tips, unsubscribe anytime.
We'll send a confirmation email. See our privacy policy.
02The business in one line
What does Capital One do?
Card holders, car buyers and businesses pay Capital One interest, and merchants pay fees when its cards are used; most of that goes on interest to depositors, losses on unpaid loans and staff, and what is left is profit.
- In FY2025, Capital One earned $58.7 billion of interest and $10.6 billion of fees and other noninterest income.
- Of every $100 that came in during FY2025, $22.9 went to depositors and lenders as interest, $29.8 to provisions for credit losses and $3.0 stayed as profit from continuing operations.
03Who pays it
Who pays Capital One?
Card borrowers
59%
of revenue
Interest on credit card balances: $40,813 million in FY2025, at an average yield of 17.95%.
Car buyers and other consumer borrowers
11%
of revenue
Interest on Consumer Banking loans, mostly auto loans: $7,604 million in FY2025.
Merchants, through card fees
9%
of revenue
Discount and interchange fees, net, charged when its cards and networks are used: $6,443 million in FY2025.
Business borrowers
8%
of revenue
Interest on Commercial Banking loans: $5,585 million in FY2025.
Customers paying account and card fees
4%
of revenue
Service charges and other customer-related fees: $2,849 million in FY2025.
Investments and other
9%
of revenue
Interest on investment securities ($3,218 million) and cash ($2,457 million) plus other noninterest income ($1,264 million), less a negative $981 million 'Other' loan interest line, in FY2025.
- Card borrowers59%
- Car buyers and other consumer borrowers11%
- Merchants, through card fees9%
- Business borrowers8%
- Customers paying account and card fees4%
- Investments and other9%
How spread out the customers are
Capital One does not disclose revenue by named customer; it lends mainly to consumers. Shares are of the $69,252 million that came in during FY2025 (interest income plus noninterest income), a Cityfort calculation from the FY2025 10-K.
04Why it makes money
Why does Capital One make money?
Card loans earn far more interest than deposits cost, and credit losses take a large part of the gap
In FY2025 card loans yielded 17.95% on average, while interest-bearing deposits cost 3.21%. That gap gives Capital One a wide net interest margin. Card loans also have more defaults, so the provision for credit losses took $29.8 of every $100 that came in, including the $8,767 million initial allowance for acquired Discover loans.
Net interest margin
6.2%7.8%
FY2021 to FY2025
- Collect deposits from savers
- Lend on cards, car loans and to businesses
- Earn interest and card fees
- Pay depositors and cover unpaid loans
- Keep the rest as profit
↺ Step 5 feeds back into step 1.
05Business segments · FY2025
Which businesses make up Capital One?
Credit Card
74%US, UK and Canada cards and personal loans. Net income from continuing operations was $645 million in FY2025, after the Discover allowance build, and $2,859 million in Q3 FY2026.
Revenue $39.6B
Consumer Banking
20%Deposits, auto loans and the Global Payment Network. Net income was $1,225 million in FY2025 and $560 million in Q3 FY2026.
Revenue $10.4B
Commercial Banking
7%Loans, deposits and treasury services for companies. Net income was $1,043 million in FY2025 and $313 million in Q3 FY2026; the Other segment lost $193 million in Q3 FY2026.
Revenue $3.7B
How the mix changed
- Credit Card
- Consumer Banking
- Commercial Banking
Revenue by segment, FY2023 to FY2025.
US$
See the numbers
06The numbers · Consolidated · US$
How has Capital One done?
Net interest income
$42.9BFY2025
Net interest income rose from $24,171 million in FY2021 to $42,878 million in FY2025 and was $12,886 million in Q3 FY2026.
* FY2021: reserve release; FY2025: Discover from May 18, 2025; Q2 FY2025: Discover allowance build.
US$ · interest earned minus interest paid
See the yearly numbers
See the quarterly numbers
Net income
$2.2BFY2025
Net income for common stockholders was a loss of $4,340 million in Q2 FY2025, when the Discover allowance was recorded, and $3,422 million in Q3 FY2026.
* FY2021: reserve release; FY2025: Discover from May 18, 2025.
US$ · after the provision for credit losses and tax
See the yearly numbers
See the quarterly numbers
Net interest margin
7.84%FY2025
The net interest margin rose from 6.21% in FY2021 to 7.84% in FY2025 and was 8.41% in Q3 FY2026.
% · net interest income as a share of the assets that earn interest, as reported by the company
See the numbers
Loans written off (net charge-offs)
3.3%FY2025
Net charge-offs rose from 0.88% of average loans in FY2021 to 3.30% in FY2025 and were 2.73% in Q3 FY2026, when the allowance was 4.92% of loans.
* FY2021: reserve release; FY2025: Discover from May 18, 2025; Q2 FY2025: Discover allowance build.
% of average loans · loans written off as unlikely to be repaid, minus amounts later recovered, as reported
See the yearly numbers
See the quarterly numbers
See all yearly numbers
Diluted EPS for common stockholders, including discontinued operations; FY2025 EPS from continuing operations was $3.36.
Net interest income = interest earned on loans and securities minus interest paid to depositors and lenders. Revenue (net of interest expense) = net interest income + noninterest income (fees and other income). Provision for credit losses = money set aside for loans that may not be repaid. Net income is the amount for common stockholders. Fiscal years are the company's own (Fiscal year ends December 31).
- Consolidated US GAAP figures in US$ million. Net income is the amount for common stockholders, after preferred dividends.
- Discover joined on May 18, 2025, so FY2025 and later quarters include its loans, deposits and network.
- Net interest margin is net interest income ÷ average interest-earning assets (annualized for quarters); the efficiency ratio is noninterest expense ÷ total net revenue; net charge-offs are a % of average loans held for investment, as the company reports them.
- CET1 is under the Basel III standardized approach; as a Category III bank, Capital One leaves accumulated other comprehensive income (AOCI) out of regulatory capital.
- ROA and ROE leave out discontinued operations, as the company defines them. ROTCE is the company's own (non-GAAP) measure.
- Quarters from Q3 FY2025 come from the Q3 FY2026 financial supplement, which says figures are preliminary until the 10-Q; Q3 FY2026 matches the 10-Q.
Learn: What is net interest income and margin? NII and NIM at real US banks · How to read a US earnings release: Nvidia's Q2 fiscal 2027 · What a margin means: dollars kept per $100
Sources (6)
07Who runs it
Who runs Capital One, and did they deliver?
Richard D. Fairbank
Founder, Chairman and Chief Executive Officer · since 1994
Founded Capital One in 1987; CEO since the November 1994 listing and Chairman since February 1995. 2025 total pay was $64,971,137, including a Discover-related special award worth about $30.0 million; $34,971,081 without it. The median employee earned $123,454, a ratio of 526 to 1 (283 to 1 without the award).
Andrew M. Young
Chief Financial Officer · since 2021
CFO since March 2021; joined Capital One in June 1996.
Matthew W. Cooper
General Counsel and Corporate Secretary; President, Discover Integration
Frank LaPrade
Chief Enterprise Services Officer and Chief of Staff to the CEO
Received a special award of 11,041 restricted stock units, worth about $2.0 million, on Apr 7, 2026 for completing the Brex purchase.
08What could go wrong
What could go wrong for Capital One?
- Concentration
Most loans are credit card loans
Card loans were $276.4 billion, 59.7% of loans held for investment at Sep 30, 2026 (Cityfort calculation from the Q3 FY2026 financial supplement). Net charge-offs were 3.30% of average loans in FY2025, up from 0.88% in FY2021; card net charge-offs were 4.01% in Q3 FY2026.
Watch The net charge-off rate and the allowance for credit losses in each quarterly release.
- Execution
Discover integration
The FY2025 10-K lists the integration's cost, timing, benefits and demands on management as a risk. Discover integration expenses were $1.1 billion in FY2025 and $338 million in Q3 FY2026.
Watch Integration expenses, listed as an adjusting item in each earnings release.
- Pricing
Deposit and funding costs
Interest expense rose from $1,598 million in FY2021 to $15,818 million in FY2025. Noninterest-bearing deposits were 5.8% of deposits at Sep 30, 2026 (Cityfort calculation from the Q3 FY2026 financial supplement), and interest-bearing deposits cost 2.94% in Q3 FY2026.
Watch The rate paid on interest-bearing deposits and the net interest margin each quarter.
- Regulation
Capital rules and payouts
With a 4.5% stress capital buffer, Capital One's CET1 minimum plus buffer is 9.0%; its ratio was 13.8% at Sep 30, 2026. The 10-K lists capital and liquidity rules that could limit dividends and buybacks as a risk.
Watch The stress capital buffer and CET1 ratio in each 10-Q.
- Legal
Lawsuits and regulators
The Q3 FY2026 10-Q puts reasonably possible losses above reserves for legal and regulatory matters at up to about $300 million. Open matters include the interchange fee suits, an SEC investigation of the Discover card product misclassification and federal agency requests about fair access to banking.
Watch The legal proceedings note in each 10-Q, and the Nov 16, 2026 interchange settlement hearing.
- Competition
Payment network acceptance
The 10-K lists merchant acceptance of the Global Payment Network and its network licensees as a risk. The network handled $190.9 billion of volume in Q3 FY2026.
Watch Global Payment Network volume in each financial supplement.
09Both sides
What do supporters and critics point to?
What supporters point to
- Net interest income rose from $24,171 million in FY2021 to $42,878 million in FY2025, with Discover included from May 18, 2025.
- Net income was $3,539 million in Q3 FY2026, up from $3,192 million in Q3 FY2025.
- The net charge-off rate was 2.73% in Q3 FY2026, down from 3.16% in Q3 FY2025.
- The CET1 capital ratio was 13.8% at Sep 30, 2026, against a 9.0% minimum plus stress capital buffer.
- Global Payment Network volume was $190.9 billion in Q3 FY2026, up from $153.1 billion in Q3 FY2025.
What critics point to
- Net income for common stockholders fell from $11,965 million in FY2021 to $2,181 million in FY2025.
- Net charge-offs were 3.30% of average loans in FY2025, up from 0.88% in FY2021.
- Noninterest-bearing deposits fell from $38,043 million at the end of FY2021 to $27,385 million at the end of FY2025, while total deposits grew.
- Discover integration expenses were $1.1 billion in FY2025 and $338 million in Q3 FY2026.
- The Q3 FY2026 10-Q puts reasonably possible legal and regulatory losses above reserves at up to about $300 million.
10What to watch next
What should you watch next at Capital One?
Next event
Q4 FY2026 results
Date not announced yet.
Credit losses
Net charge-offs were 2.73% of average loans in Q3 FY2026 and 3.30% in FY2025. Each quarterly release updates the rate and the allowance.
Discover integration costs
Integration expenses were $338 million in Q3 FY2026. Each earnings release lists them as an adjusting item.
Buybacks and capital
$6,244 million was left under the buyback program at Sep 30, 2026, with the CET1 ratio at 13.8%.
11Key dates
What are the key dates for Capital One?
| Event | Date | Source |
|---|---|---|
| Final approval hearing on the interchange injunctive-class settlementPreliminary approval was granted on Jun 9, 2026. | Form 10-Q, Q3 2026 (quarter ended Sep 30, 2026) | |
| CEO's Discover-related special stock award vests153,351 restricted stock units granted on Jun 3, 2025, worth about $30.0 million at grant. | Form 8-K filed Jun 5, 2025 (Item 5.02: Discover integration RSU awards); 2026 proxy statement (DEF 14A) | |
| Discover student loan consent order endsDecember 2030, as stated in the FY2025 10-K; the filing gives the month only. | Not yet stated | Form 10-K, fiscal year 2025 (ended Dec 31, 2025) |
12Key facts
Key facts about Capital One
- What does Capital One do?
- Capital One Financial is a US bank holding company that issues credit cards, makes car loans, lends to businesses and takes deposits. Since buying Discover on May 18, 2025, Capital One also runs the Discover payment network. It had $462.5 billion of loans at Sep 30, 2026.
- How does Capital One make money?
- Capital One makes most of its money from interest on loans. In FY2025, Capital One earned $42.9 billion of net interest income (interest earned minus interest paid) and $10.6 billion of noninterest income, mostly card fees paid by merchants, for total net revenue of $53.4 billion.
- Is Capital One profitable?
- Yes. Capital One reported net income of $2,453 million in FY2025 ($2,181 million for common stockholders), down from $4,750 million in FY2024, after an $8,767 million initial allowance for acquired Discover loans. Capital One's net income was $3,539 million in Q3 FY2026.
- What is Capital One's revenue by segment?
- In FY2025, Capital One's Credit Card segment earned $39.6 billion of total net revenue (74.0%), Consumer Banking $10.4 billion (19.5%) and Commercial Banking $3.7 billion (6.8%), out of $53.4 billion.
- Who are Capital One's customers?
- Capital One lends mainly to consumers through credit cards and car loans, and also to companies with revenue of $20 million to $2 billion. Capital One's 2026 proxy says it serves over 100 million customers; it does not disclose revenue by named customer.
- Who owns Capital One?
- Capital One has one class of common stock. The 2026 proxy lists The Vanguard Group with 10.2% and BlackRock with 7.1%, from older Schedule 13GA filing by anyone who owns more than 5% of a company's shares and does not seek control. Learn more filings; Capital One's directors and executive officers as a group held 0.78% at Feb 18, 2026.
- How big is Capital One's credit card business?
- Capital One's credit card loans were $276.4 billion at Sep 30, 2026, 59.7% of its loans held for investment. Capital One says it was the largest US credit card issuer by outstanding card loans at Dec 31, 2025.
- How big is Capital One's auto loan business?
- Capital One's auto loans were $92.9 billion at Sep 30, 2026. Capital One's Consumer Banking segment, which holds auto loans and most deposits, earned $10.4 billion of total net revenue in FY2025.
- Does Capital One own a payment network?
- Yes. Since buying Discover on May 18, 2025, Capital One runs the Global Payment Network: the Discover Network, the PULSE debit network and Diners Club. Capital One's network handled $190.9 billion of volume in Q3 FY2026.
- What is Capital One's CET1 capital ratio?
- Capital One's common equity tier 1 (CET1) capital ratio was 13.8% at Sep 30, 2026, under the Basel III standardized approach, compared with 14.3% at Dec 31, 2025.
Terms on this page
- Allowance for credit losses
- CET1 ratio
- Earnings per share (EPS)
- Efficiency ratio
- Market cap
- Net charge-offs
- Net interest income and margin
- P/E ratio
- Stock buyback
Each explains the term in plain English, with the same number from other companies on Cityfort.
Go deeper
More detail from the same filings. Open any section.
13What it sells
13What it sells
What does Capital One sell?
Credit cards
Cards for consumers, small businesses and companies in the US, plus cards in the UK and Canada and personal loans. Brex corporate cards joined on Apr 7, 2026. Card loans were $276.4 billion at Sep 30, 2026.
Auto loans
Loans to car buyers across the US, held in the Consumer Banking segment: $92.9 billion at Sep 30, 2026.
Deposit accounts
Checking and savings accounts for people and businesses. Consumer Banking held $431.1 billion of deposits and Commercial Banking $31.1 billion at Sep 30, 2026.
Commercial banking
Real estate and business loans, deposits and treasury services for companies with revenue of $20 million to $2 billion. Commercial loans were $92.1 billion at Sep 30, 2026.
Global Payment Network
The Discover Network, the PULSE debit network and Diners Club, bought with Discover. It handled $190.9 billion of volume in Q3 FY2026.
Think of it like this
Like a shop that buys money from savers and rents it to borrowers at a higher price.
What it does
- Does: Lends on credit cards, car loans and to businesses
- Does: Takes deposits from people and businesses
- Does: Runs the Discover, PULSE and Diners Club networks
What it does not do
- Does not: Report an investment banking or asset management segment
- Does not: Lend much outside the US: UK and Canada card loans were $8.1 billion of $462.5 billion at Sep 30, 2026
- Does not: Keep the Discover Home Loan business, which it sold on Nov 24, 2025
14How the money flows
14How the money flows · FY2025
How does money flow through Capital One?
Money in
- Interest earned on loans, securities and cash$58.7B
- Card fees, customer fees and other noninterest income$10.6B
The company
Capital One
$69.3B came in
Money out
- Interest paid to depositors and lenders$15.8B
- Employees (salaries and benefits)$12.5B
- Marketing, technology, offices and other costs$18.0B
- Provision for credit losses$20.7B
- Income tax$193M
- Income from continuing operations$2.1B
- Savers keep deposits with Capital One, $475.8 billion at the end of FY2025, and it also borrows from bond investors.
- It lends that money on cards, car loans and to businesses, earning $58.7 billion of interest in FY2025.
- Merchants' card fees, customer fees and other income added $10.6 billion.
- Interest paid of $15.8 billion, staff and other costs, and $20.7 billion set aside for credit losses came out.
- That left $2,088 million from continuing operations; the sold home loan business added $365 million, for net income of $2,453 million.
15Competitors and what protects it
15Competitors and what protects it
Who does Capital One compete with?
American Express
NYSE: AXP
Named in Capital One's FY2025 10-K as a credit card competitor; card customers choose on price, credit limit, rewards and service, the 10-K says.
What protects the business
Each strength is scored 1 (weak) to 5 (strong) for the business, with the reason. It is not a rating of the share.
- Card lending scale4 of 5
Capital One says it was the largest US credit card issuer by outstanding card loans at Dec 31, 2025; card loans were $276.4 billion at Sep 30, 2026.
- Own payment network3 of 5
Since May 18, 2025 it owns the Discover Network, PULSE and Diners Club, which handled $190.9 billion of volume in Q3 FY2026; the 10-K lists merchant acceptance as a risk.
- Deposit funding3 of 5
Deposits of $480.7 billion funded $462.5 billion of loans at Sep 30, 2026; the rate paid on interest-bearing deposits was 2.94% in Q3 FY2026.
Weak spot
Credit losses on card loans
Card net charge-offs were 4.01% of average card loans in Q3 FY2026, against 1.59% for auto loans; the provision for credit losses took $29.8 of every $100 that came in during FY2025, including the $8,767 million initial allowance for acquired Discover loans.
16Where growth could come from
16Where growth could come from
Where could Capital One's growth come from?
Richard Fairbank, the CEO, said in the Q3 FY2026 earnings release (Oct 20, 2026) that the Discover integration "continues to go well". The release gives no outlook for revenue or earnings.
Discover payment network
Working$190.9B volume, Q3 FY2026
Global Payment Network volume rose from $153.1 billion in Q3 FY2025, up 24.7% (Cityfort calculation from the Q3 FY2026 financial supplement).
Status: Working, on track against what the company said.
Card spending
Working$254.7B purchase volume, Q3 FY2026
Credit Card purchase volume rose from $230.4 billion in Q3 FY2025, up 10.5% (Cityfort calculation from the Q3 FY2026 financial supplement).
Status: Working, on track against what the company said.
Auto loans
Working$92.9B at Sep 30, 2026
Auto loans rose $3.6 billion, or 4%, in Q3 FY2026.
Status: Working, on track against what the company said.
Brex corporate cards
NewBought Apr 7, 2026
Paid about $2.6 billion in cash and 10.6 million shares, about $4.5 billion in total, per the Q3 FY2026 10-Q. Brex integration expenses were $47 million in Q3 FY2026.
Status: New, recently announced.
Status compares progress with what the company itself said it would do: Working = on track against what the company said; Mixed = partly on track; Behind = behind the company's own plan; New = recently announced; Early = too early to judge.
17The company's own measures (non-GAAP)
17The company's own measures · FY2025 and Q3 FY2026
What do Capital One's own measures show?
Official (GAAP): Diluted EPS, FY2025
$4.03
Company's own measure: Adjusted diluted EPS, FY2025
$19.61
Leaves out the $8,767 million initial allowance for acquired Discover loans, Discover integration expenses, acquisition amortization, legal reserve builds, the gain on selling the home loan business and the FDIC special assessment.
Official (GAAP): Diluted EPS, Q3 FY2026
$5.61
Company's own measure: Adjusted diluted EPS, Q3 FY2026
$6.69
Leaves out, before tax, acquisition amortization ($483 million), Discover integration expenses ($338 million) and Brex integration expenses ($47 million).
Official (GAAP): Efficiency ratio, Q3 FY2026
54.2%
Company's own measure: Adjusted efficiency ratio, Q3 FY2026
48.8%
Noninterest expense ÷ total net revenue, with the same items left out of expense.
Official (GAAP): Return on average common equity, FY2025
2.0%
Company's own measure: Return on average tangible common equity, FY2025
3.2%
Divides by common equity less goodwill and intangible assets, net of related deferred tax, as the company defines it.
Official (GAAP): Return on average common equity, Q3 FY2026
12.6%
Company's own measure: Return on average tangible common equity, Q3 FY2026
21.1%
The same definition, annualized for the quarter.
Official (GAAP): Book value per share, end of FY2025
$181.76
Company's own measure: Tangible book value per share, end of FY2025
$107.72
Common equity less goodwill and intangible assets, per share; the Discover purchase added goodwill and intangibles.
These are the company's own measures, defined by the company. They are not comparable across companies, and they are not added together. Each sits beside the nearest official (GAAP) figure.
Learn: Non-GAAP measures: what a company's "adjusted" numbers leave out
18Financial strength: capital, loan losses, deposits
18Financial strength · FY2025
How strong is Capital One's balance sheet?
- Loans made$453.6B
- Deposits taken$475.8B
- of which pay no interest$27.4B
Loans were 95.3% of deposits at the end of FY2025 (Cityfort calculation from the reported totals: loans ÷ deposits).
Noninterest-bearing deposits, such as many checking accounts, were 5.8% of deposits (Cityfort calculation: noninterest-bearing deposits ÷ total deposits).
- CET1 capital ratio
- 14.3%
- common equity capital as a share of risk-weighted assets (standardized approach); regulators set a minimum
- Allowance for credit losses
- $23.4B
- money set aside for expected loan losses: 5.16% of loans
- Net charge-offs
- $13.1B
- loans written off, minus recoveries: 3.3% of average loans
- Efficiency ratio
- 57.08%
- $ of noninterest expense per $100 of revenue (net interest income + noninterest income)
- Return on assets
- 0.35%
- net income as % of average total assets
- Return on equity
- 2.03%
- net income as % of average common equity
- Return on tangible common equity
- 3.16%
- the company's own measure (non-GAAP): equity without goodwill and other intangibles
Figures at the end of FY2025, consolidated, as reported by the company in its 10-K and earnings release; see the dates on each source.
Learn: What are net charge-offs? Loans written off, with real US companies · What is the allowance for credit losses? Loss reserves at US banks · What is the CET1 ratio? A bank's core capital, with real US companies · What is a bank efficiency ratio? Costs vs revenue, with real US banks · How to read a 10-K in 10 minutes
19Who owns it
19Who owns it · ownership as of Feb 18, 2026
Who owns Capital One?
- Officers and directors (as a group), shares
- 0.8%
Share classes
Holders of 5% or more
From the company's proxy statement (DEF 14A), later Schedule 13G filings and the share counts on its latest annual or quarterly report. Each holder row shows the date of its own filing.
Insider trades · Form 4 data as of Nov 6, 2026
What did Capital One's insiders report trading?
Capital One's insiders made 103 Form 4A filing an insider must make within two business days of buying or selling the company's shares. Learn more filings in the 12 months to Nov 6, 2026.
They reported no purchases and 71 sales (387,438 shares) in the open market or privately (codes P and S).
69 of the 71 sales were on forms with the Rule 10b5-1 plan box checked.
The same filings report 124 other share transactions (F: 66, A: 43, M: 13, D: 2).
They also report 15 transactions in options, stock units or other derivatives.
Insiders are a company's officers, directors and owners of more than 10% of a class of its shares. Most changes in their holdings must be reported to the SEC on a Form 4 within two business days. Source: SEC Form 4 filings on EDGAR.
- P
- a purchase in the open market or privately
- S
- a sale in the open market or privately
- A
- a grant, award or other acquisition from the company under Rule 16b-3
- D
- shares handed back to the company under Rule 16b-3
- F
- shares withheld or handed over to pay an exercise price or tax when an award is received, exercised or vests
- M
- exercise or conversion of an option or other derivative, exempt under Rule 16b-3
Code meanings: General Instruction 8 of Form 4 (SEC).
The latest 25 of 195 transactions
Shares: A = acquired, D = disposed of. A price the filing gives only in a footnote shows as “See filing”. The 10b5-1 box is checked when at least one trade on the form was made under a Rule 10b5-1 plan. A Form 4/A replaces the form it amends. See all of Capital One's Form 4 filings on EDGAR.
Learn: How to read a proxy statement (DEF 14A): Nvidia's 2026 proxy · Form 4 insider filings: who files, the codes and the footnotes · Rule 10b5-1 trading plans: how insiders pre-schedule their trades
20What it does with profit
20What it does with profit
What does Capital One do with its profit?
Dividend per share
$2.60FY2025
Dividend paid for each share, by financial year.
$ per share
See the numbers
Buyback · Sep 30, 2026
First nine months of FY2026: $7.9 billion of repurchases; in Q3 FY2026 it bought 12.68 million shares at an average of $209.63.
$7.9B
Buyback · Dec 31, 2025
FY2025: repurchases of common stock.
$3.8B
21Governance signals
21Governance signals
What do Capital One's governance filings show?
- Auditor
- Ernst & Young LLP, since 1994
- Auditor changes
- None in the period covered
- Audit qualifications
- None reported
- Related-party dealings
- The 2026 proxy reports two related-person matters ratified by the board's Governance and Nominating Committee: about $6.8 million paid in 2025 to the law firm McGuireWoods, where General Counsel Matthew Cooper's brother-in-law was a partner, and about $204,000 of 2025 pay to the spouse of executive Ravi Raghu, who works at Capital One.
- Credit rating
- Moody's, S&P and Fitch, as stated in Capital One's Q3 FY2026 10-Q Baa1 (Moody's), BBB+ (S&P) and A- (Fitch) for senior unsecured debt (Stable at all three as of Oct 22, 2026), Oct 22, 2026
A credit rating describes the company's ability to repay debt. It is not a rating of the share.
Flags to know about
regulatory · Apr 30, 2026
Discover card product misclassification
Discover placed certain card accounts in its highest merchant pricing tier by mistake and reserved $1.2 billion. A merchant class settlement received final approval on May 20, 2026. The Federal Reserve's Apr 18, 2025 consent order carried a civil money penalty, paid before the merger closed. The SEC is investigating, and Capital One says it is cooperating. A shareholder suit alleging securities claims was refiled; Capital One moved to dismiss on Apr 30, 2026.
regulatory · Jun 17, 2026
360 Savings account suits
Savings account holders sued in 2023, alleging breach of contract over a new, higher-rate savings product; the New York Attorney General sued in 2025 on similar allegations. A settlement with a $425 million fund, already reserved, and a higher 360 Savings rate received final approval on Apr 20, 2026. An individual objector appealed on Jun 17, 2026.
regulatory · Jun 9, 2026
Interchange fee litigation
Since 2005, merchants have sued Visa, Mastercard and several issuing banks, including Capital One, alleging a conspiracy to fix interchange fees. A settlement with the injunctive relief class received preliminary approval on Jun 9, 2026; the final approval hearing is set for Nov 16, 2026.
regulatory
Fair access to banking
Capital One is responding to demands and requests from federal agencies about "fair access to banking", and to a civil suit filed by the Donald J. Trump Revocable Trust and affiliated companies, pending in federal court in the Southern District of Florida.
other · Nov 17, 2025
FDIC special assessment dispute
Capital One's bank sued the FDIC on Sep 10, 2025 over a special assessment, and the FDIC filed a counterclaim on Nov 17, 2025. The 10-Q puts reasonably possible additional fees at about $150 million.
regulatory
Discover student loan consent order
A December 2020 Consumer Financial Protection Bureau consent order on Discover's student loans stays in effect until December 2030, as the FY2025 10-K states.
other
Insider share policy
The 2026 proxy says named executive officers may not hedge Capital One stock or use it as collateral for loans.
22What the market paid
22What the market paid · price as of Nov 5, 2026
What did the market pay for Capital One on Nov 5, 2026?
Price as of Nov 5, 2026 (shown for education; prices change daily).
Price as of Nov 5, 2026: Capital One closed at $203.84, from Nasdaq's historical price table for COF; the shares are listed on the NYSE. Market value of about $122.6 billion (Cityfort calculation from the Nov 5, 2026 closing price and the Q3 FY2026 10-Q) = $203.84 × 601,533,153 shares at Sep 30, 2026. P/E is price ÷ earnings per share: 12.0 on $16.94 of diluted EPS over the four quarters to Sep 30, 2026 (Cityfort calculation from the Nov 5, 2026 closing price and the Q3 FY2026 financial supplement). P/B is price ÷ book value per share: 1.17 on $174.95, which is common equity of $105,237 million ÷ 601,533,153 shares (Cityfort calculation from the Q3 FY2026 financial supplement and 10-Q). Dividend yield is 1.57%: $0.80 × 4 = $3.20 a year ÷ the price.
- Share price
- $203.84
- Market value (market cap)
- $122.6B
- P/E
- 12×
- P/B
- 1.2×
More price-based ratios · as of Nov 5, 2026
Each ratio divides a number from the company's filings by the market value or share price on Nov 5, 2026. Prices change daily, so these ratios do too.
Price to sales (P/S)
1.9×
$122.6B market value ÷ $63.0B revenue (four quarters to Sep 30, 2026) = 1.9×
Cityfort calculation from the Nov 5, 2026 closing price and the Q4 FY2025 to Q3 FY2026 10-Qs and earnings releases. Source: COF historical prices, Oct 6 to Nov 5, 2026 (Nasdaq.com historical table; COF is listed on the NYSE); Form 10-Q, Q3 2026 (quarter ended Sep 30, 2026); Q3 2026 financial supplement (Form 8-K, Exhibit 99.2)
How price ratios work
Shares used for the market value: 601.53 million ($203.84 × 601.53 million shares ≈ $122.6B). Source: Form 10-Q, Q3 2026 (quarter ended Sep 30, 2026); Form 10-K, fiscal year 2025 (ended Dec 31, 2025); 2026 proxy statement (DEF 14A)
Source: COF historical prices, Oct 6 to Nov 5, 2026 (Nasdaq.com historical table; COF is listed on the NYSE); Form 10-Q, Q3 2026 (quarter ended Sep 30, 2026); Q3 2026 financial supplement (Form 8-K, Exhibit 99.2)
23How it got here
23How it got here
How did Capital One get here?
1987
Milestone
Founded
Richard Fairbank founded Capital One, as the 2026 proxy states.
1994
Milestone
Listed company formed
Capital One Financial Corporation was established in Delaware in 1994 and listed in November 1994, with Fairbank as CEO.
2025
Business-model change
Bought Discover
Discover merged into Capital One on May 18, 2025, adding its card loans, deposits and payment network. Discover holders got 1.0192 Capital One shares each; the price was $51.8 billion.
2025
Crisis
Loss in Q2 FY2025
A net loss of $4,277 million, after an $8,767 million initial allowance for acquired Discover loans.
2025
Milestone
Sold Discover Home Loans
Sold the Discover Home Loan business on Nov 24, 2025 for $8.8 billion in cash, with a $483 million gain before tax.
2026
Milestone
Bought Brex
Completed the purchase of Brex, a corporate card business, on Apr 7, 2026 for about $2.6 billion in cash and 10.6 million shares.
Sources (6)
- 2026 proxy statement (DEF 14A)
- Form 10-K, fiscal year 2025 (ended Dec 31, 2025)
- Q3 2026 financial supplement (Form 8-K, Exhibit 99.2)
- Q3 2025 financial supplement (Form 8-K, Exhibit 99.2)
- Form 8-K filed Apr 7, 2026 (Items 3.02 and 5.02: Brex acquisition completed)
- Form 10-Q, Q3 2026 (quarter ended Sep 30, 2026)
24Sources and changes
Where every number on this page comes from
Sources (12 documents)
- S1Form 10-K, fiscal year 2025 (ended Dec 31, 2025) · Capital One Financial Corporation (SEC EDGAR) · Tier 1: company or exchange filing · Feb 19, 2026
- S2Form 10-K, fiscal year 2023 (ended Dec 31, 2023) · Capital One Financial Corporation (SEC EDGAR) · Tier 1: company or exchange filing · Feb 23, 2024
- S3Form 10-K, fiscal year 2022 (ended Dec 31, 2022) · Capital One Financial Corporation (SEC EDGAR) · Tier 1: company or exchange filing · Feb 24, 2023
- S4Form 10-Q, Q3 2026 (quarter ended Sep 30, 2026) · Capital One Financial Corporation (SEC EDGAR) · Tier 1: company or exchange filing · Nov 3, 2026
- S5Q3 2026 earnings release (Form 8-K, Exhibit 99.1) · Capital One Financial Corporation (SEC EDGAR) · Tier 1: company or exchange filing · Oct 20, 2026
- S6Q3 2026 financial supplement (Form 8-K, Exhibit 99.2) · Capital One Financial Corporation (SEC EDGAR) · Tier 1: company or exchange filing · Oct 20, 2026
- S7Q3 2025 financial supplement (Form 8-K, Exhibit 99.2) · Capital One Financial Corporation (SEC EDGAR) · Tier 1: company or exchange filing · Oct 21, 2025
- S9Q4 2025 financial supplement (Form 8-K, Exhibit 99.2) · Capital One Financial Corporation (SEC EDGAR) · Tier 1: company or exchange filing · Jan 22, 2026
- S102026 proxy statement (DEF 14A) · Capital One Financial Corporation (SEC EDGAR) · Tier 1: company or exchange filing · Mar 25, 2026
- S11Form 8-K filed Apr 7, 2026 (Items 3.02 and 5.02: Brex acquisition completed) · Capital One Financial Corporation (SEC EDGAR) · Tier 1: company or exchange filing · Apr 7, 2026
- S13Form 8-K filed Jun 5, 2025 (Item 5.02: Discover integration RSU awards) · Capital One Financial Corporation (SEC EDGAR) · Tier 1: company or exchange filing · Jun 5, 2025
- S14COF historical prices, Oct 6 to Nov 5, 2026 (Nasdaq.com historical table; COF is listed on the NYSE) · Nasdaq, Inc. · Tier 1: company or exchange filing · Nov 6, 2026
Changes to this page (v1 · Nov 6, 2026)
- v1 · Nov 6, 2026First version, through Q3 FY2026 (quarter ended Sep 30, 2026). (first version)
Numbers come only from tier 1 and tier 2 sources. Read how we research.
Disclaimer
For learning only. Cityfort is not a registered investment adviser or broker-dealer and does not recommend buying or selling any security. Prices shown are dated and may be out of date.
Investing in securities involves risk, including loss of capital. Before making any investment decision, do your own research and consider consulting a registered investment adviser or other qualified professional.
Cityfort, its owners and contributors may or may not hold securities of companies covered. Cityfort is not paid by any company it covers. Content is not an offer or solicitation to buy or sell any security, including in any initial public offering.
Read the positions policyRead the full disclaimerHide the full disclaimer
Cityfort publishes general educational content that explains how listed companies work. Cityfort is not registered with the US Securities and Exchange Commission or any state securities regulator as an investment adviser, and is not a broker-dealer or a member of FINRA. Cityfort does not provide investment, tax or legal advice, recommendations, ratings, price targets or any opinion on whether to buy, sell or hold any security. Nothing on the site is tailored to any person's circumstances.
All information is taken from publicly available sources, mainly company filings with the SEC, which are listed on each page with dates. We work to keep it accurate and correct errors publicly, but we do not guarantee that it is complete, accurate or up to date. Any market price or price-based ratio shown is dated, may be out of date by the time you read it, and is included only to explain concepts.
Statements by company management, including forward-looking statements and guidance, are reported as the company's statements, with their date and source; they are not our forecasts. Adjusted (non-GAAP) figures are the company's own measures and are shown next to the official (GAAP) figures.