Financials · NYSE: BNY
BNY: how the business works
BNY, a New York bank in business since 1784, held and serviced $59.3 trillion of other people's investments at Dec 31, 2025 and earned $5,306 million for its common shareholders in FY2025.
By Hardik Bhandare · Checked against filings: . Editorial policy. Corrections
Follow BNY
Email me when BNY's page is updated after earnings.
We'll send a confirmation email first. See our privacy policy.
The Bank of New York Mellon Corporation · New York, New York · Founded 1784
Updated for Q3 FY2026 · checked
- Total revenue, FY2025
- $20.1B
- Net income to common shareholders, FY2025
- $5.3B
- Assets under custody and/or administration, Sep 30, 2026
- $63.4 trillion
- Assets under management, Sep 30, 2026
- $2.2 trillion
- Full-time employees, Dec 31, 2025
- 48,100
The short version
BNY in 5 points
1 · What it sells
BNY holds, clears and services investments for financial firms and manages money for clients, with $59.3 trillion of assets under custody and/or administration at Dec 31, 2025.
2 · Who pays it
In FY2025, institutions paid 48.5% of BNY's segment revenue through Securities Services, brokers, advisers, banks and companies 34.9% through Market and Wealth Services, and fund investors and wealthy families 16.3%.
3 · What it keeps from $100
Of every $100 that came in during FY2025, BNY paid $50.7 in interest and kept $13.6 as net income; its pre-tax operating margin was 35% as BNY reports it, and its return on equity (ROE) was 13.9%, or 14.1% excluding items BNY calls notable.
4 · Where the operating profit comes from
In FY2025 Market and Wealth Services earned $3,424 million before tax, Securities Services $3,219 million and Investment and Wealth Management $543 million, while Other lost $162 million.
5 · The one thing to watch
BNY's CET1 capital ratio was 11.9% at Dec 31, 2025 and 11.0% at Sep 30, 2026; BNY's medium-term target (3 to 5 years), given on Jan 13, 2026, is about 11%.
Sources: From BNY's FY2025 10-K, its Jan 13, 2026 results presentation and its Q3 FY2026 financial supplement · checked
01Where $100 of a bank's money goes · FY2025
Where does $100 of BNY's money go?
BNY · FY2025
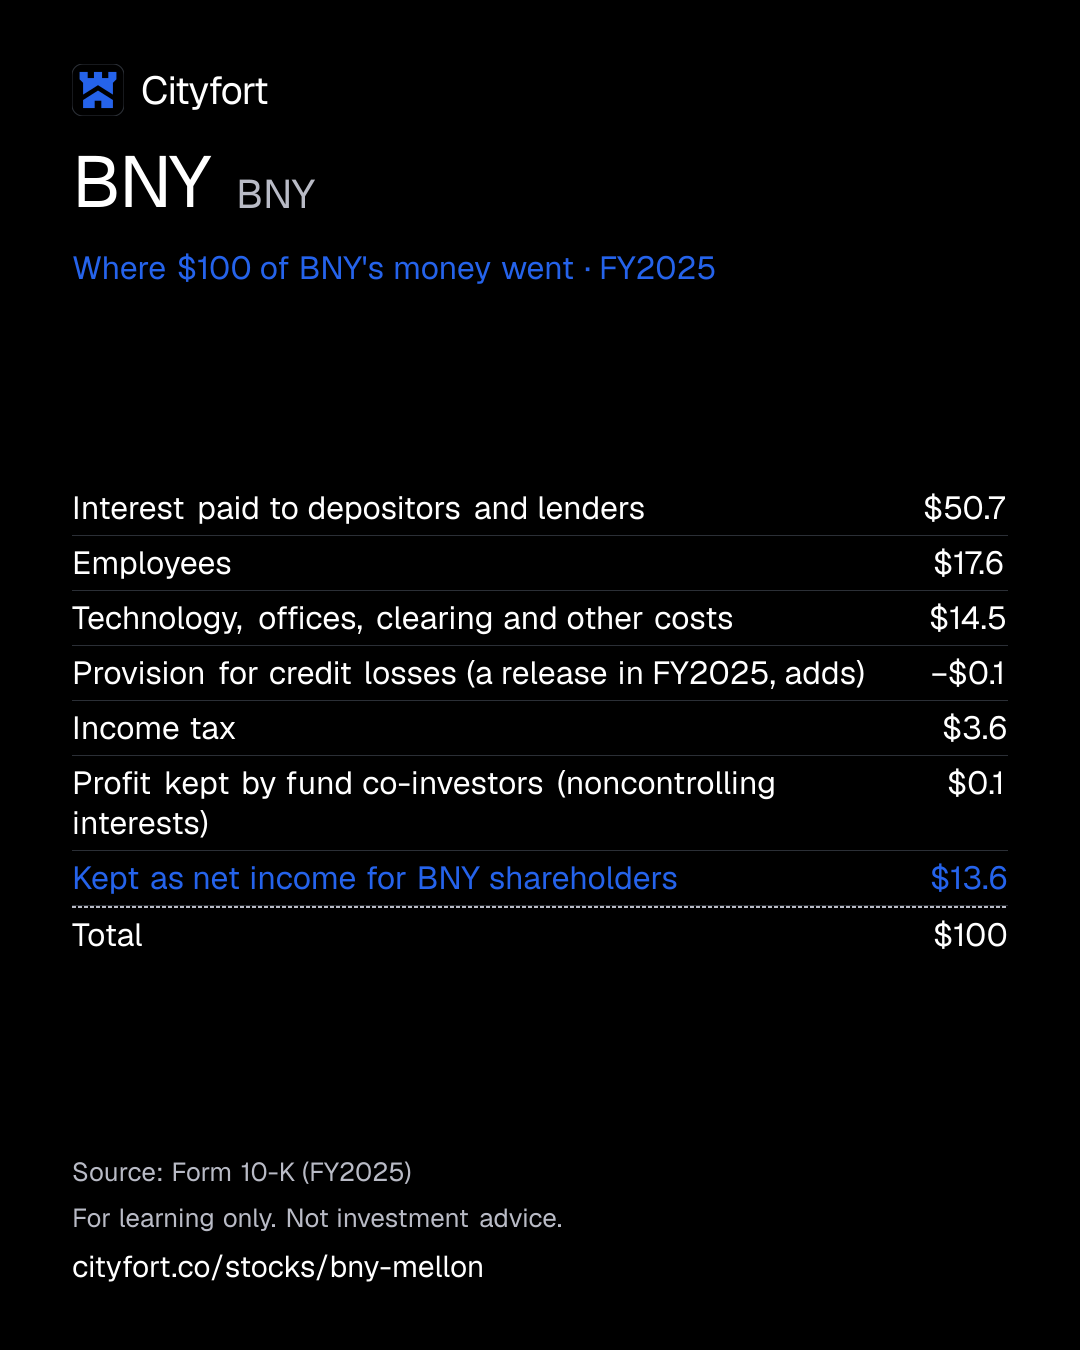
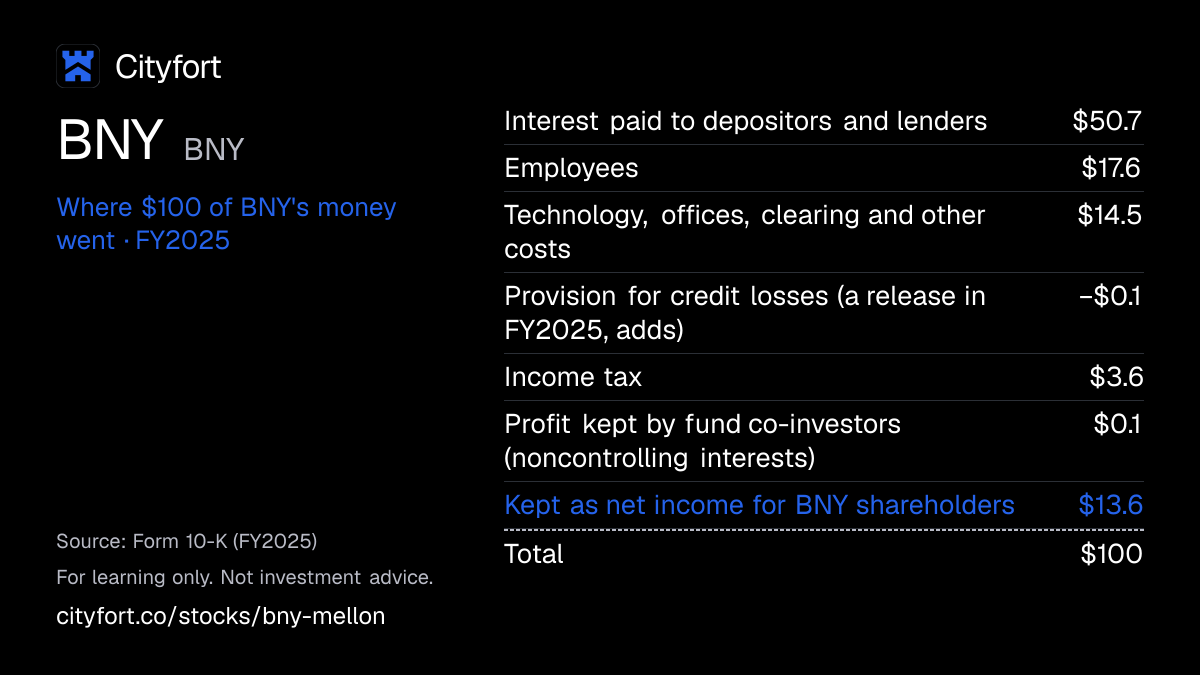
Receipt for every $100
| Interest paid to depositors and lenders | $50.7 |
|---|---|
| Employees | $17.6 |
| Technology, offices, clearing and other costs | $14.5 |
| Provision for credit losses (a release in FY2025, adds) | −$0.1 |
| Income tax | $3.6 |
| Profit kept by fund co-investors (noncontrolling interests) | $0.1 |
| Kept as net income for BNY shareholders | $13.6 |
| Total | $100 |
Each line = amount ÷ total money in × 100. Lines may not add to exactly $100 because of rounding.
How this is worked out
Cityfort calculation from the FY2025 10-K. Of every $100 that came in during FY2025 (interest income $25,626 million plus fee and other revenue $15,136 million = $40,762 million): each line = line ÷ $40,762 million × 100. The receipt counts interest income before interest expense, so its profit share differs from net income ÷ total revenue (27.6%).
Save this receipt as an image
Embed this receipt or the key numbers
Paste this code into a blog or website to show the card you choose, with a link back to this page.
Each week: the next company due to report earnings, explained in 5 points.
No tips. Unsubscribe anytime.
We'll send a confirmation email. See our privacy policy.
02The business in one line
What does BNY do?
Funds, pension plans, brokers and bond issuers pay BNY fees to hold, clear and service their investments, and BNY earns interest on the cash they leave with it. Most of that money goes on interest paid to depositors, staff and technology.
- In FY2025 fee and other revenue was $15,136 million and net interest income $4,944 million, for total revenue of $20,080 million.
- Of every $100 that came in during FY2025, counting interest income before interest paid, $50.7 went out as interest, $17.6 went on staff and $13.6 was kept as net income.
03Who pays it
Who pays BNY?
Asset managers, pension funds, insurers and central banks
48.5%
of revenue
Pay custody, fund accounting, securities lending and trustee fees in the Securities Services segment: $9,730 million in FY2025, 48.5% of segment revenue.
Brokers, wealth advisers, banks and companies
34.9%
of revenue
Pay for Pershing clearing, payments, and US Treasury clearing and collateral services in Market and Wealth Services: $7,000 million in FY2025, 34.9%.
Investors in BNY funds and wealthy families
16.3%
of revenue
Pay management, performance and advice fees in Investment and Wealth Management: $3,258 million in FY2025, 16.3%.
- Asset managers, pension funds, insurers and central banks48.5%
- Brokers, wealth advisers, banks and companies34.9%
- Investors in BNY funds and wealthy families16.3%
How spread out the customers are
BNY does not disclose revenue from its largest clients. Its 10-K names clients only by type: central banks and sovereigns, financial institutions, asset managers, insurers, companies and wealthy families. Shares are of FY2025 segment revenue of $20,046 million (Cityfort calculation from the FY2025 10-K).
04How it makes money
How does BNY make money?
BNY earns small fees on a very large pool of client assets, plus interest on client cash.
Fees are charged on the value and activity of assets BNY holds or manages, so they move with markets and client volumes. Client cash is invested, and the gap between interest earned and paid is net interest income. From FY2023 to FY2025 total revenue rose 13.5% while noninterest expense fell 1.8%.
Pre-tax operating margin (as BNY reports it)
24%35%
FY2023 to FY2025
- Clients hand BNY their securities and cash to hold
- BNY charges fees on assets held, trades cleared and money moved
- Client cash is invested at central banks and in bonds
- Interest earned above interest paid adds net interest income
- Costs are mostly people and technology, so extra revenue can lift the margin
↺ Step 5 feeds back into step 1.
05Business segments · FY2025
Which businesses make up BNY?
Securities Services
48.5%Custody, fund services and trustee work for institutions (Asset Servicing and Issuer Services). Pre-tax income shown as profit.
Revenue $9.7B ($9,730M) · Operating profit $3.2B ($3,219M)
Market and Wealth Services
34.9%Pershing, Payments and Trade, and Clearance and Collateral Management; the highest pre-tax margin (49%).
Revenue $7.0B ($7,000M) · Operating profit $3.4B ($3,424M)
Investment and Wealth Management
16.3%Fund management firms and wealth advice for families.
Revenue $3.3B ($3,258M) · Operating profit $543M
Other
0.3%Corporate treasury and securities portfolio, tax-credit investments and business exits. Segment totals exclude income of noncontrolling interests, so they sum to $20,046 million, not $20,080 million.
Revenue $58M · Operating profit −$162M
How the mix changed
- Securities Services
- Market and Wealth Services
- Investment and Wealth Management
- Other
Revenue by segment, FY2023 to FY2025.
US$
See the numbers
06The numbers · Consolidated · US$
How has BNY done?
Net interest income
$4.9BFY2025
Net interest income rose from $2,618 million in FY2021 to $4,944 million in FY2025, which was 24.6% of FY2025 total revenue.
US$ · interest earned minus interest paid
See the yearly numbers
See the quarterly numbers
Net income
$5.3BFY2025
Net income to common shareholders fell from $3,552 million in FY2021 to $2,345 million in FY2022, a year with a $680 million goodwill impairment, then rose to $5,306 million in FY2025.
US$ · after the provision for credit losses and tax
See the yearly numbers
See the quarterly numbers
Net interest margin
1.33%FY2025
The net interest margin, net interest income as a share of average interest-earning assets, rose from 0.68% in FY2021 to 1.33% in FY2025 and was 1.43% in Q3 FY2026.
% · net interest income as a share of the assets that earn interest, as reported by the company
See the numbers
Loans written off (net charge-offs)
0.02%FY2025
Net charge-offs were $16 million in FY2025, 0.02% of average loans, and the allowance for loan losses was 0.30% of total loans.
% of average loans · loans written off as unlikely to be repaid, minus amounts later recovered, as reported
See the numbers
See all yearly numbers
† Restated by the company. Net income in the yearly and quarterly rows is net income applicable to common shareholders, after preferred dividends ($243 million in FY2025), the figure diluted EPS uses.
Net interest income = interest earned on loans and securities minus interest paid to depositors and lenders. Revenue (net of interest expense) = net interest income + noninterest income (fees and other income). Provision for credit losses = money set aside for loans that may not be repaid. Net income is the amount for common stockholders. Fiscal years are the company's own (Fiscal year ends Dec 31 (the calendar year)).
- Loans are total loans and the allowance is the allowance for loan losses, as BNY divides them; the total allowance for credit losses, including lending-related commitments, was $344 million at Dec 31, 2025.
- Net charge-offs are the totals in BNY's allowance for credit losses table; FY2023 shows -$3 million because recoveries exceeded charge-offs that year.
- FY2022 and FY2023 are shown as restated in the FY2024 10-K (FY2022 CET1 11.1%, 11.2% as first reported); FY2021 is as reported in the FY2021 10-K.
- Net income in this table is net income applicable to common shareholders, after preferred dividends, in both the yearly and quarterly rows.
Learn: What is net interest income and margin? NII and NIM at real US banks · How to read a US earnings release: Nvidia's Q2 fiscal 2027 · What a margin means: dollars kept per $100 · Fiscal years that don't end in December: Nvidia's FY2027 explained
Sources (8)
- Form 10-K for FY2021, Exhibit 13.1 Financial Section (2021 Annual Report)
- Form 10-K for FY2022, Exhibit 13.1 Financial Section (2022 Annual Report)
- Form 10-K FY2024, Annual Report part (MD&A, financial statements, notes)
- Form 10-K FY2025, Annual Report part (MD&A, financial statements, notes)
- Form 10-K for FY2023, Exhibit 13.1 Financial Section (2023 Annual Report)
- 8-K Ex. 99.2 financial supplement 3Q25
- 8-K Ex. 99.2 financial supplement 4Q25
- 8-K Ex. 99.2 financial supplement 3Q26
07Who runs it
Who runs BNY, and did they deliver?
Robin Vince
Chairman, President and CEO · since 2022
CEO since September 2022 and Chairman since September 2025.
Dermot McDonogh
Senior EVP and Chief Financial Officer · since 2023
CFO since February 2023; earlier at Goldman Sachs International.
Jose Minaya
Global Head of BNY Investments and Wealth · since 2024
Joined from Nuveen, where he was CEO.
Rajashree Datta
Senior EVP and Chief Risk Officer · since 2025
CRO since April 2025; earlier at Goldman Sachs.
Joseph J. Echevarria
Lead Independent Director · since 2025
Board Chairman from September 2019 to August 2025; a retired Deloitte CEO.
What they said, and what happened
3 delivered · 1 too early to tell
Said on Jun 12, 2026
BNY announced it would redeem all of its Series H preferred stock.
DeliveredWhat happened
The Q3 FY2026 10-Q lists the Series H redemption among the changes in preferred stock in 2026.
Said on Aug 20, 2026
BNY announced it would redeem all of its Series F preferred stock.
DeliveredWhat happened
The Q3 FY2026 10-Q says the Series F shares were all redeemed in September 2026.
Said on Jul 31, 2026
The board approved a quarterly dividend of $0.63 per share, expected to be paid Aug 7, 2026.
DeliveredWhat happened
The Q3 FY2026 10-Q says the increased dividend was paid on Aug 7, 2026.
Said on Jan 13, 2026
BNY kept a medium-term target of a CET1 ratio of about 11%.
Too early to tellWhat happened
The CET1 ratio was 11.0% at Sep 30, 2026, according to the 10-Q; the target covers 3 to 5 years.
Sources (7)
08What could go wrong
What could go wrong for BNY?
- Demand
Fees depend on markets and client activity
Fee and other revenue was 75.4% of FY2025 total revenue. The 10-K says fee revenue could fall with slower market activity, weak markets or underperformance.
Watch Assets under custody and/or administration in each earnings release ($63.4 trillion at Sep 30, 2026, preliminary).
- Pricing
Lower interest rates would cut interest income
The 10-K says a fall in short-term rates or a flat or inverted yield curve has hurt net interest income before. Net interest income was 24.6% of FY2025 total revenue.
Watch Net interest margin (1.43% in Q3 FY2026).
- Technology
Operational errors or cyber incidents
BNY sits in the middle of trade settlement and US Treasury clearing. The 10-K says processing errors, delays or a cybersecurity incident could materially hurt its business and reputation.
Watch 8-K filings on incidents and the technology cost line ($2,147 million in FY2025).
- Regulation
Capital rules limit growth and payouts
The 10-K says US capital rules could restrict growth or capital returns. The CET1 ratio fell from 11.9% at Dec 31, 2025 to 11.0% at Sep 30, 2026; BNY's medium-term target (3 to 5 years), given on Jan 13, 2026, is about 11%.
Watch The CET1 ratio in each quarterly supplement.
- Legal
Legal claims
BNY puts reasonably possible losses at up to $630 million above its accruals, from suits including mortgage-securities trustee claims, Stanford-related claims against Pershing and the Postalis cases in Brazil.
Watch The legal proceedings note in each 10-Q and 10-K.
- Competition
Fund outflows in investment management
Clients pulled a net $93 billion from long-term strategies in 2025, partly offset by $56 billion of cash inflows. Investment and Wealth Management had a pre-tax margin of 17% in FY2025.
Watch Assets under management and net flows in each earnings release.
- Execution
Transformation may not pay off
The 10-K says BNY may not realize some or all of the expected benefits of its move to a platforms operating model.
Watch Noninterest expense growth against revenue growth (8% vs 12% in Q3 FY2026, as BNY reported).
09Supporters vs. critics
What do supporters and critics point to?
What supporters point to
- Assets under custody and/or administration rose from $47.8 trillion at Dec 31, 2023 to $59.3 trillion at Dec 31, 2025, and were a preliminary $63.4 trillion at Sep 30, 2026.
- Total revenue rose every year, from $15,931 million in FY2021 to $20,080 million in FY2025, while noninterest expense fell 1.8% from FY2023 to FY2025.
- Net charge-offs were $16 million in FY2025, 0.02% of average loans, and loans were $80.6 billion of $472.3 billion of total assets.
- The board raised the quarterly dividend 19%, from $0.53 to $0.63, in July 2026, and BNY repurchased about $3.5 billion of common stock in FY2025.
What critics point to
- Fee and other revenue was 75.4% of FY2025 total revenue, and the 10-K says fee revenue could fall with slower market activity or weak markets.
- A net $37 billion flowed out of assets BNY manages in 2025, and Investment and Wealth Management revenue fell from $3,389 million in FY2024 to $3,258 million in FY2025.
- The CET1 ratio fell from 11.9% at Dec 31, 2025 to 11.0% at Sep 30, 2026; BNY's medium-term target (3 to 5 years), given on Jan 13, 2026, is about 11%.
- BNY estimates reasonably possible legal losses of up to $630 million above its accruals, from suits including mortgage-securities trustee claims and the Postalis cases in Brazil.
10What to watch next
What should you watch next at BNY?
Next event
Q4 FY2026 results
Date not announced yet.
CET1 ratio against the about-11% target
BNY's CET1 ratio was 11.0% at Sep 30, 2026, according to its 10-Q. In its Jan 13, 2026 results presentation, BNY said its medium-term target, over 3 to 5 years, was about 11%.
Net interest income and rates
Net interest income was $1,423 million in Q3 FY2026, up 15.1% from $1,236 million a year earlier. The 10-K says lower short-term rates have hurt it before.
Fund flows in Investment and Wealth Management
A net $37 billion flowed out of assets BNY manages in 2025. Each earnings release reports assets under management and net flows.
New medium-term targets
CEO Robin Vince said on Jan 13, 2026 that BNY was setting new medium-term financial targets. The Q4 FY2026 results will be the first full year since then.
11Key facts
Key facts about BNY
- What does BNY do?
- The Bank of New York Mellon Corporation (BNY) is a New York bank that mostly serves other financial firms. It holds and keeps records of their investments, clears their trades, moves their payments and manages money, with $59.3 trillion of client assets under custody and/or administration at Dec 31, 2025.
- How does BNY make money?
- BNY had total revenue of $20,080 million in FY2025: $15,136 million (75.4%) from fees and other revenue, and $4,944 million (24.6%) from net interest income, the interest it earns on client cash minus the interest it pays.
- Who are BNY's customers?
- BNY's customers are asset managers, pension funds, insurers, central banks, brokers, wealth advisers, banks, companies and wealthy families. In FY2025 Securities Services brought in 48.5% of BNY's segment revenue, Market and Wealth Services 34.9% and Investment and Wealth Management 16.3%.
- How big is BNY?
- BNY had total revenue of $20,080 million and net income to common shareholders of $5,306 million in FY2025. It had $472.3 billion of total assets and 48,100 full-time employees at Dec 31, 2025.
- Is BNY mainly a lender?
- No. BNY's loans were $80.6 billion of its $472.3 billion of total assets at Dec 31, 2025. Its net charge-offs, loans written off minus recoveries, were $16 million in FY2025, 0.02% of average loans.
- How has BNY's profit changed?
- BNY's net income to common shareholders fell from $3,552 million in FY2021 to $2,345 million in FY2022, a year with a $680 million goodwill impairment, then rose to $5,306 million in FY2025.
- How much capital does BNY hold?
- BNY's CET1 ratio, its core equity capital as a share of risk-weighted assets, was 11.9% at Dec 31, 2025 and 11.0% at Sep 30, 2026, according to its 10-Q.
- Who owns BNY?
- BNY has one class of common stock with one vote per share. Its 2026 proxy lists The Vanguard Group with 10.54% (as of Feb 28, 2025) and BlackRock with 9.35% (as of Dec 31, 2023); directors and executive officers held about 0.17% on Feb 18, 2026.
Sources (7)
- Form 10-K FY2025, Annual Report part (MD&A, financial statements, notes)
- Form 10-K FY2025 (cover, Items 1-4, 9A-16)
- Form 10-K for FY2021, Exhibit 13.1 Financial Section (2021 Annual Report)
- Form 10-K FY2024, Annual Report part (MD&A, financial statements, notes)
- 8-K Ex. 99.2 financial supplement 3Q26
- Form 10-Q Q3 2026 (quarter ended Sep 30, 2026)
- DEF 14A 2026 proxy statement
Terms on this page
- Allowance for credit losses
- CET1 ratio
- Dividend payout ratio
- Earnings per share (EPS)
- Efficiency ratio
- Market cap
- Net charge-offs
- Net interest income and margin
- P/E ratio
- Stock buyback
Each explains the term in plain English, with the same number from other companies on Cityfort.
Go deeper
More detail from the same filings. Open any section.
12What it sells
12What it sells
What does BNY sell?
Asset Servicing (custody)
Holds securities for pension funds, fund managers and insurers, settles their trades and keeps the records. FY2025 revenue: $7,516 million.
Issuer Services
Acts as trustee and paying agent for bond issuers ($14.8 trillion of debt serviced) and runs 1,614 depositary receipt programs. FY2025 revenue: $2,214 million.
Pershing
Clears trades and holds client assets for brokers and wealth advisers, with $3.0 trillion of assets at Dec 31, 2025. FY2025 revenue: $2,928 million.
Clearance and Collateral Management
BNY is the primary provider of US government securities clearance and a custodian for tri-party repo, a kind of secured short-term lending. FY2025 revenue: $2,071 million.
Payments and Trade
Moves money and trade-finance payments for banks and companies. FY2025 revenue: $2,001 million.
Investment and Wealth Management
Seven specialist fund firms, including Newton, Walter Scott and ARX, manage $2.2 trillion; wealth offices in 30+ locations advise families with $350 billion of client assets. FY2025 revenue: $3,258 million.
Think of it like this
Like a coat check for investments: clients hand over their securities, BNY keeps them safe and counted, and charges a fee on what it holds.
What it does
- Does: Held $59.3 trillion of client assets under custody and/or administration at Dec 31, 2025
- Does: Managed $2.2 trillion of investments for clients at Dec 31, 2025
- Does: Takes deposits from institutional clients: $331.9 billion at Dec 31, 2025
- Does: Trades foreign exchange in more than 100 currencies
What it does not do
- Does not: Does not own the $59.3 trillion it holds in custody: those assets belong to its clients
- Does not: Is not mainly a lender: loans were $80.6 billion of its $472.3 billion of total assets at Dec 31, 2025
13How the money flows
13How the money flows · FY2025
How does money flow through BNY?
Money in
- Interest earned on central bank deposits, securities and loans$25.6B
- Fees and other revenue$15.1B
The company
BNY
$40.8B came in
Money out
- Interest paid to depositors and lenders$20.7B
- Employees$7.2B
- Technology, offices, clearing and other costs$5.9B
- Provision for credit losses (a release in FY2025, adds)−$32M
- Income tax$1.5B
- Profit kept by fund co-investors (noncontrolling interests)$34M
- Net income to BNY shareholders$5.5B
- Clients pay fees to have their investments held, cleared, serviced and managed: $15.1 billion in FY2025.
- BNY places client deposits with central banks and in bonds and loans, earning $25.6 billion of interest.
- It paid $20.7 billion of that back as interest to depositors and lenders.
- Pay of $7.2 billion was the largest cost after interest; technology, offices and other costs took $5.9 billion.
- After $1.5 billion of income tax, $5.5 billion was left for BNY shareholders, $243 million of it paid as preferred dividends.
14What it needs to run
14What it needs to run
What does BNY need to run?
Client deposits
Clients left $331.9 billion on deposit at Dec 31, 2025, $60.0 billion of it in accounts that pay no interest. This cash funds most of the balance sheet.
Technology
Software and equipment cost $2,147 million in FY2025, the largest noninterest expense after staff. The 10-K says system errors, delays or cyber incidents could hurt the business.
People
48,100 full-time employees at Dec 31, 2025, about 60% of them outside the US. Staff expense was $7,159 million in FY2025.
Capital and bank licenses
Its main banks are The Bank of New York Mellon (a New York state-chartered bank), BNY Mellon, N.A. and BNY SA/NV in Brussels. US capital rules set minimum capital levels for each of them.
15Where it sells
15Where it sells · FY2025
Where does BNY sell?
- United States64.7%
- Europe, Middle East and Africa22.7%
- Asia-Pacific6.9%
- Other international5.6%
16Competitors and what protects it
16Competitors and what protects it
Who does BNY compete with?
State Street Corporation
NYSE: STT
In BNY's 2026 proxy peer group, which BNY picks for a similar business mix (asset servicing, asset management, clearing) and as firms seen as competitors for clients and talent.
Northern Trust Corporation
Also in BNY's 2026 proxy peer group of firms with a comparable mix of businesses.
JPMorgan Chase
NYSE: JPM
Named in the same 2026 proxy peer group; BNY's 10-K lists custody, clearing and cash management as areas where it meets other financial firms.
BlackRock
NYSE: BLK
In the 2026 proxy peer group; the 10-K says BNY's investment business competes with other asset managers.
What protects the business
Each strength is scored 1 (weak) to 5 (strong) for the business, with the reason. It is not a rating of the share.
- Scale4 of 5
$59.3 trillion of assets under custody and/or administration at Dec 31, 2025, up from $47.8 trillion two years earlier.
- Role in market plumbing4 of 5
The 10-K describes BNY as the primary provider of US government securities clearance and a tri-party repo custodian.
- Client cash3 of 5
$60.0 billion of the $331.9 billion of deposits at Dec 31, 2025 paid no interest.
- Track record3 of 5
With its subsidiaries, BNY has been in business since 1784.
Weak spot
Fund outflows
A net $37 billion flowed out of assets BNY manages in 2025, and Investment and Wealth Management revenue fell from $3,389 million in FY2024 to $3,258 million in FY2025.
17Where growth could come from
17Where growth could come from
Where could BNY's growth come from?
In its Jan 13, 2026 results presentation, BNY said its medium-term (3 to 5 year) targets for the Tier 1 leverage ratio and the CET1 ratio stayed at 5.5–6% and about 11%. CEO Robin Vince said the same day that BNY was setting new medium-term financial targets.
Platforms operating model
WorkingOver 70% of staff moved in by end-2025
BNY said over 70% of employees worked in its new platforms operating model at the end of 2025, and that it generated about $550 million of efficiency savings in 2025.
Status: Working, on track against what the company said.
Net interest income
Working$1,423M in Q3 FY2026 vs $1,236M
Net interest income rose 15.1% from Q3 FY2025, and the net interest margin rose from 1.31% to 1.43%.
Status: Working, on track against what the company said.
Securities Services fees
Working$2,820M in Q3 FY2026 vs $2,447M
Segment revenue rose 15.2% from Q3 FY2025 on the recast basis of the Q3 FY2026 supplement.
Status: Working, on track against what the company said.
Investment and Wealth Management
Mixed$37B net outflows in 2025
Segment revenue fell 3.9% in FY2025, then was $857 million in Q3 FY2026, up from $824 million a year earlier.
Status: Mixed, partly on track.
AI platform (Eliza)
Early134 digital employees live
BNY said in January 2026 that it had launched Eliza 2.0, had 160 enterprise AI solutions in production and that 99% of employees use Eliza.
Status: Early, too early to judge.
Status compares progress with what the company itself said it would do: Working = on track against what the company said; Mixed = partly on track; Behind = behind the company's own plan; New = recently announced; Early = too early to judge.
18The company's own measures (non-GAAP)
18The company's own measures · FY2025
What do BNY's own measures show?
Official (GAAP): Return on common equity (ROE)
13.9%
Company's own measure: Return on tangible common equity (ROTCE)
26.1%
ROTCE leaves goodwill and intangible assets, net of deferred tax liabilities, out of equity.
Official (GAAP): Return on tangible common equity (ROTCE)
26.1%
Company's own measure: ROTCE excluding notable items
26.4%
Also leaves out items BNY calls notable, such as severance and disposal gains or losses.
Official (GAAP): Return on common equity (ROE)
13.9%
Company's own measure: ROE excluding notable items
14.1%
Leaves out the items BNY calls notable.
These are the company's own measures, defined by the company. They are not comparable across companies, and they are not added together. Each sits beside the nearest official (GAAP) figure.
Learn: Non-GAAP measures: what a company's "adjusted" numbers leave out
19Financial strength: capital, loan losses, deposits
19Financial strength · FY2025
How strong is BNY's balance sheet?
- Loans made$80.6B
- Deposits taken$331.9B
- of which pay no interest$60.0B
Loans were 24.3% of deposits at the end of FY2025 (Cityfort calculation from the reported totals: loans ÷ deposits).
Noninterest-bearing deposits, such as many checking accounts, were 18.1% of deposits (Cityfort calculation: noninterest-bearing deposits ÷ total deposits).
- CET1 capital ratio
- 11.9%
- common equity capital as a share of risk-weighted assets; regulators set a minimum
- Allowance for credit losses
- $245M
- money set aside for expected loan losses: 0.3% of loans
- Net charge-offs
- $16M
- loans written off, minus recoveries: 0.02% of average loans
- Efficiency ratio
- 65.0%
- $ of noninterest expense per $100 of revenue (net interest income + noninterest income)
- Return on equity
- 13.9%
- net income as % of average common equity
- Return on tangible common equity
- 26.1%
- the company's own measure (non-GAAP): equity without goodwill and other intangibles
Figures at the end of FY2025, consolidated, as reported by the company in its 10-K and earnings release; see the dates on each source.
Learn: What are net charge-offs? Loans written off, with real US companies · What is the allowance for credit losses? Loss reserves at US banks · What is the CET1 ratio? A bank's core capital, with real US companies · What is a bank efficiency ratio? Costs vs revenue, with real US banks · How to read a 10-K in 10 minutes
20Who owns it
20Who owns it · ownership as of Feb 18, 2026
Who owns BNY?
- Officers and directors (as a group), shares
- 0.2%
Share classes
Holders of 5% or more
From the company's proxy statement (DEF 14A), later Schedule 13G filings and the share counts on its latest annual or quarterly report. Each holder row shows the date of its own filing.
Learn: How to read a proxy statement (DEF 14A): Nvidia's 2026 proxy · Form 4 insider filings: who files, the codes and the footnotes
21What it does with profit
21What it does with profit
What does BNY do with its profit?
Dividend per share
$2.00FY2025
Dividend paid for each share, by financial year.
$ per share
See the numbers
Buyback · Dec 31, 2025
Repurchased about $3.5 billion of common stock in FY2025, at an average price of $96.12.
$3.5B
Buyback · Sep 30, 2026
Repurchased $937 million of common stock in Q3 FY2026; $8,774 million remained under the $10.0 billion authorization of April 2026.
$937M
22Governance signals
22Governance signals
What do BNY's governance filings show?
- Auditor
- KPMG LLP, since 2007
- Auditor changes
- None in the period covered
- Audit qualifications
- None reported
- Related-party dealings
- This version of the page does not summarize the related-person transactions section of the 2026 proxy. The proxy states that BNY policies bar executive officers and directors from hedging BNY securities or using them as collateral for loans.
- Credit rating
- Moody's, S&P, Fitch and Morningstar DBRS (long-term senior debt of the parent company, as stated in BNY's Q3 FY2026 10-Q) Aa3 (Moody's) / A (S&P) / AA- (Fitch) / AA (DBRS) (outlook Stable (Moody's, S&P, DBRS); Positive (Fitch, changed from Stable in October 2026)), Sep 30, 2026
A credit rating describes the company's ability to repay debt. It is not a rating of the share.
Flags to know about
other
Legal matters with possible losses
BNY estimates reasonably possible losses of up to $630 million above its accruals for the legal matters it describes. They include suits by mortgage-securities investors alleging the trustee had wider duties, claims by alleged buyers of R. Allen Stanford certificates of deposit against Pershing, and suits by the Brazilian pension fund Postalis.
23What the market paid
23What the market paid · price as of Sep 30, 2026
What did the market pay for BNY on Sep 30, 2026?
Price as of Sep 30, 2026 (shown for education; prices change daily).
Price as of Sep 30, 2026: BNY closed at $144.63, and its market capitalization was $97.3 billion, both as stated in the Q3 FY2026 financial supplement. P/E is price ÷ earnings per share: 16.0 on diluted EPS of $9.05 for the four quarters to Sep 30, 2026 (Cityfort calculation from the Q3 FY2026 financial supplement). P/B is price ÷ book value per share: 2.48 on $58.43 at Sep 30, 2026 (Cityfort calculation from the Q3 FY2026 financial supplement).
- Share price
- $144.63
- Market value (market cap)
- $97.3B
- P/E
- 16×
- P/B
- 2.5×
More price-based ratios · as of Sep 30, 2026
Each ratio divides a number from the company's filings by the market value or share price on Sep 30, 2026. Prices change daily, so these ratios do too.
Price to sales (P/S)
4.4×
$97.3B market value ÷ $22.0B revenue (four quarters to Sep 30, 2026) = 4.4×
Cityfort calculation from the Sep 30, 2026 closing price and the Q4 FY2025 to Q3 FY2026 8-Ks. Source: 8-K Ex. 99.2 financial supplement 3Q26
How price ratios workDividend yield
1.38%
$2.00 dividends per share (FY2025) ÷ $144.63 share price = 1.38%
Cityfort calculation from the FY2025 10-K and the Sep 30, 2026 closing price. Source: 8-K Ex. 99.2 financial supplement 3Q26; Form 10-K FY2025, Annual Report part (MD&A, financial statements, notes)
What dividend yield means
Shares used for the market value: 672.9 million ($144.63 × 672.9 million shares ≈ $97.3B). Source: Form 10-Q Q3 2026 (quarter ended Sep 30, 2026); DEF 14A 2026 proxy statement
24How it got here
24How it got here
How did BNY get here?
1784
Milestone
In business since 1784
BNY, with its subsidiaries, traces its business back to 1784.
2007
Business-model change
Bank of New York and Mellon merge
The Bank of New York Company and Mellon Financial Corporation merged into today's company; KPMG has audited it since.
2022
Crisis
$680 million goodwill impairment
A goodwill write-down helped cut net income to common shareholders to $2,345 million in FY2022 (restated).
2022
Milestone
Robin Vince becomes CEO
Vince became President and CEO in September 2022, after six months as CEO-elect.
2023
Crisis
FDIC special assessment
Bank assessment charges reached $788 million in FY2023, including an FDIC special assessment, against $36 million in FY2024.
2025
Business-model change
Most staff move to the platforms model
BNY said over 70% of employees worked in its new platforms operating model by the end of 2025.
2026
Milestone
$10.0 billion buyback authorization
The board approved a new $10.0 billion share repurchase authorization in April 2026.
2026
Milestone
Ticker changes from BK to BNY
The stock began trading on the NYSE as BNY on May 21, 2026, replacing BK.
Sources (7)
- Form 10-K FY2025 (cover, Items 1-4, 9A-16)
- DEF 14A 2026 proxy statement
- Form 10-K FY2024, Annual Report part (MD&A, financial statements, notes)
- Form 10-K FY2025, Annual Report part (MD&A, financial statements, notes)
- 8-K Ex. 99.3 quarterly update presentation 4Q25
- Form 10-Q Q3 2026 (quarter ended Sep 30, 2026)
- BNY Announces Planned Change of Stock Ticker Symbol to "BNY"
25Sources and changes
Where every number on this page comes from
Sources (22 documents)
- S1Form 10-K FY2025 (cover, Items 1-4, 9A-16) · SEC EDGAR · Tier 1: company or exchange filing · Feb 25, 2026
- S2Form 10-K FY2025, Annual Report part (MD&A, financial statements, notes) · SEC EDGAR · Tier 1: company or exchange filing · Feb 25, 2026
- S3Form 10-K FY2024 (cover, Items 1-4) · SEC EDGAR · Tier 1: company or exchange filing · Feb 27, 2025
- S4Form 10-K FY2024, Annual Report part (MD&A, financial statements, notes) · SEC EDGAR · Tier 1: company or exchange filing · Feb 27, 2025
- S5Form 10-Q Q3 2026 (quarter ended Sep 30, 2026) · SEC EDGAR · Tier 1: company or exchange filing · Oct 30, 2026
- S6Form 10-Q Q2 2026 · SEC EDGAR · Tier 1: company or exchange filing · Jul 31, 2026
- S8DEF 14A 2026 proxy statement · SEC EDGAR · Tier 1: company or exchange filing · Mar 5, 2026
- S98-K Ex. 99.1 earnings release 3Q26 · SEC EDGAR · Tier 1: company or exchange filing · Oct 15, 2026
- S108-K Ex. 99.2 financial supplement 3Q26 · SEC EDGAR · Tier 1: company or exchange filing · Oct 15, 2026
- S188-K Ex. 99.1 earnings release 4Q25 · SEC EDGAR · Tier 1: company or exchange filing · Jan 13, 2026
- S198-K Ex. 99.2 financial supplement 4Q25 · SEC EDGAR · Tier 1: company or exchange filing · Jan 13, 2026
- S208-K Ex. 99.3 quarterly update presentation 4Q25 · SEC EDGAR · Tier 1: company or exchange filing · Jan 13, 2026
- S228-K Ex. 99.2 financial supplement 3Q25 · SEC EDGAR · Tier 1: company or exchange filing · Oct 16, 2025
- S348-K Item 8.01 Series F preferred redemption · SEC EDGAR · Tier 1: company or exchange filing · Aug 20, 2026
- S378-K Item 8.01 Series H preferred redemption · SEC EDGAR · Tier 1: company or exchange filing · Jun 12, 2026
- S40BNY Announces Planned Change of Stock Ticker Symbol to "BNY" · BNY (company newsroom) · Tier 3: context only · May 11, 2026
- S41Form 10-K for FY2023 (XBRL financial data) · SEC EDGAR · Tier 1: company or exchange filing · Feb 28, 2024
- S42Form 10-K for FY2022 (XBRL financial data) · SEC EDGAR · Tier 1: company or exchange filing · Feb 27, 2023
- S43Form 10-K for FY2021 (XBRL financial data) · SEC EDGAR · Tier 1: company or exchange filing · Feb 25, 2022
- S44Form 10-K for FY2021, Exhibit 13.1 Financial Section (2021 Annual Report) · SEC EDGAR · Tier 1: company or exchange filing · Feb 25, 2022
- S45Form 10-K for FY2022, Exhibit 13.1 Financial Section (2022 Annual Report) · SEC EDGAR · Tier 1: company or exchange filing · Feb 27, 2023
- S46Form 10-K for FY2023, Exhibit 13.1 Financial Section (2023 Annual Report) · SEC EDGAR · Tier 1: company or exchange filing · Feb 28, 2024
Changes to this page (v1 · Nov 20, 2026)
- v1 · Nov 20, 2026First version. (first version)
Numbers come only from tier 1 and tier 2 sources. Read how we research.
Disclaimer
For learning only. Cityfort is not a registered investment adviser or broker-dealer and does not recommend buying or selling any security. Prices shown are dated and may be out of date.
Investing in securities involves risk, including loss of capital. Before making any investment decision, do your own research and consider consulting a registered investment adviser or other qualified professional.
Cityfort, its owners and contributors may or may not hold securities of companies covered. Cityfort is not paid by any company it covers. Content is not an offer or solicitation to buy or sell any security, including in any initial public offering.
Read the positions policyRead the full disclaimerHide the full disclaimer
Cityfort publishes general educational content that explains how listed companies work. Cityfort is not registered with the US Securities and Exchange Commission or any state securities regulator as an investment adviser, and is not a broker-dealer or a member of FINRA. Cityfort does not provide investment, tax or legal advice, recommendations, ratings, price targets or any opinion on whether to buy, sell or hold any security. Nothing on the site is tailored to any person's circumstances.
All information is taken from publicly available sources, mainly company filings with the SEC, which are listed on each page with dates. We work to keep it accurate and correct errors publicly, but we do not guarantee that it is complete, accurate or up to date. Any market price or price-based ratio shown is dated, may be out of date by the time you read it, and is included only to explain concepts.
Statements by company management, including forward-looking statements and guidance, are reported as the company's statements, with their date and source; they are not our forecasts. Adjusted (non-GAAP) figures are the company's own measures and are shown next to the official (GAAP) figures.