Financials · NYSE: BLK
BlackRock: how the business works
BlackRock manages money for savers, pension funds and other investors, $15.5 trillion at Sep 30, 2026, and earned $24.2 billion of revenue in FY2025.
By Hardik Bhandare · Checked against filings: . Editorial policy. Corrections
Follow BlackRock
Email me when BlackRock's page is updated after earnings.
We'll send a confirmation email first. See our privacy policy.
BlackRock, Inc. · New York, New York
Updated for Q3 FY2026 · checked
- Revenue, FY2025
- $24.2B
- Net income attributable to BlackRock, FY2025
- $5.55B
- Assets under management, Sep 30, 2026
- $15.49 trillion
- Net inflows from clients, FY2025
- $698B
- Employees, Dec 31, 2025
- About 24,900
The short version
BlackRock in 5 points
1 · What it sells
BlackRock manages $15.5 trillion for clients through iShares ETFs, index, active, private markets and cash funds, and sells Aladdin software, with FY2025 revenue of $24.2 billion.
2 · Who pays it
In FY2025, ETF investors paid 45% of BlackRock's long-term base fees, retail investors 25%, institutions with active mandates 24% and institutions with index mandates 6%.
3 · What it keeps from $100
Of every $100 that came in during FY2025, BlackRock kept $21.86 as net income, helped by $1.2 billion of non-operating investment gains, interest and dividends, while operating income was 29.1% of revenue as reported and 44.1% on its adjusted measure.
4 · Where the operating profit comes from
BlackRock reports one segment, and base fees and securities lending brought $19.2 billion of its $24.2 billion FY2025 revenue, with private markets at 12% of base fees on 2% of average assets.
5 · The one thing to watch
Changes in the value of payments owed for the GIP and HPS purchases added $564 million to costs in Q3 FY2026, after a $549 million gain in Q1 FY2026.
Sources: From BlackRock's FY2025 10-K and its Q1 FY2026 and Q3 FY2026 earnings releases · checked
See the full receipt and the management scorecard below
01Where the money goes · FY2025
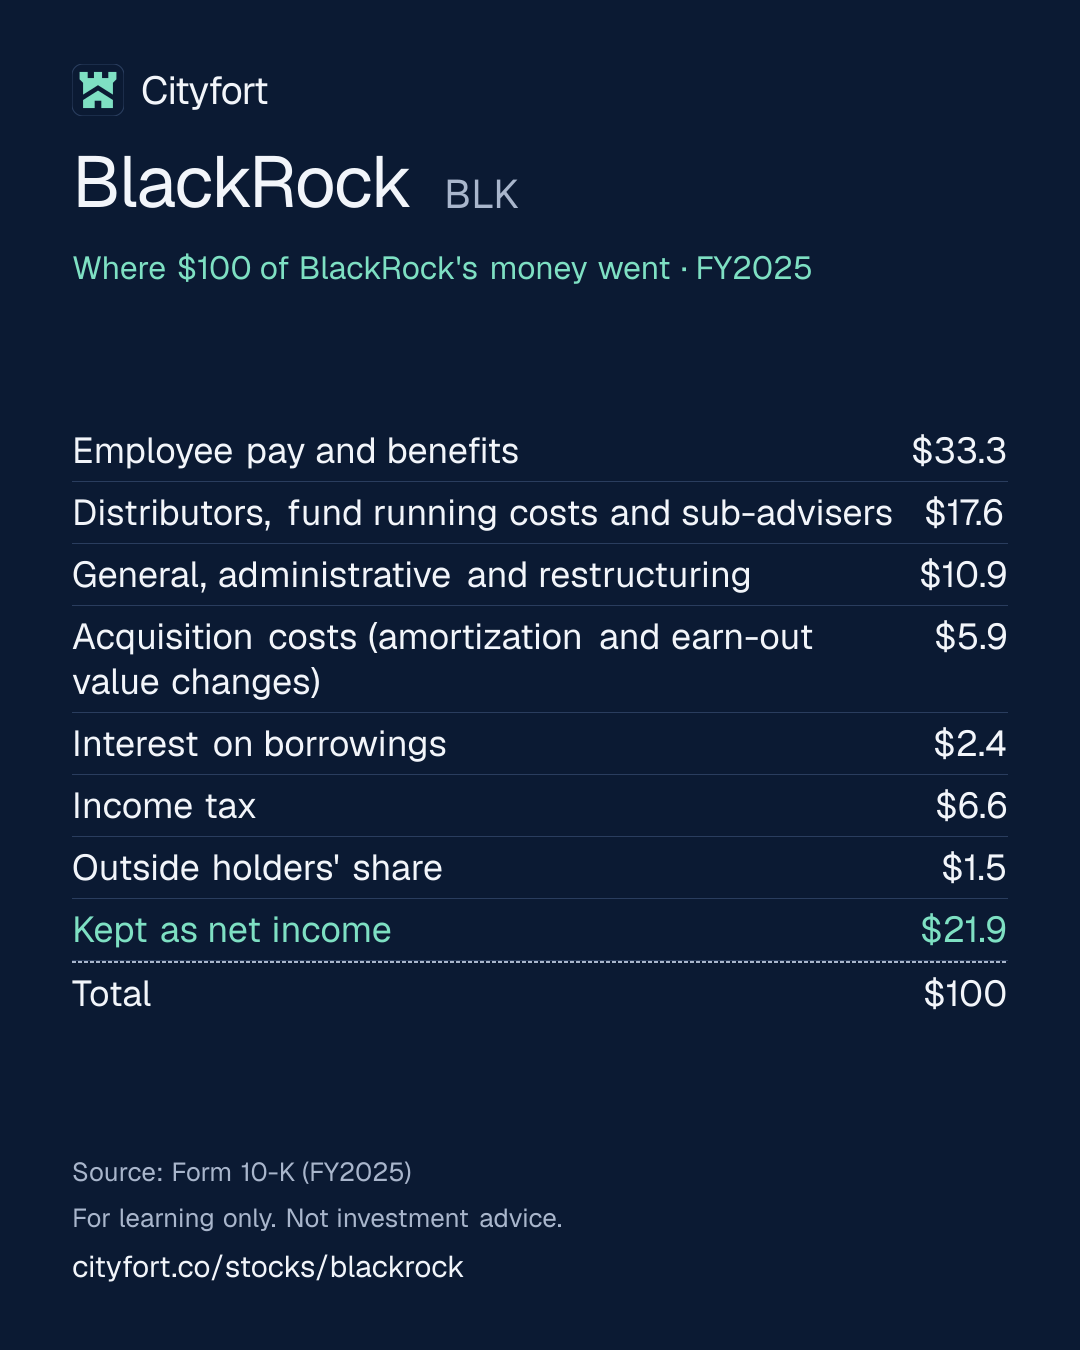
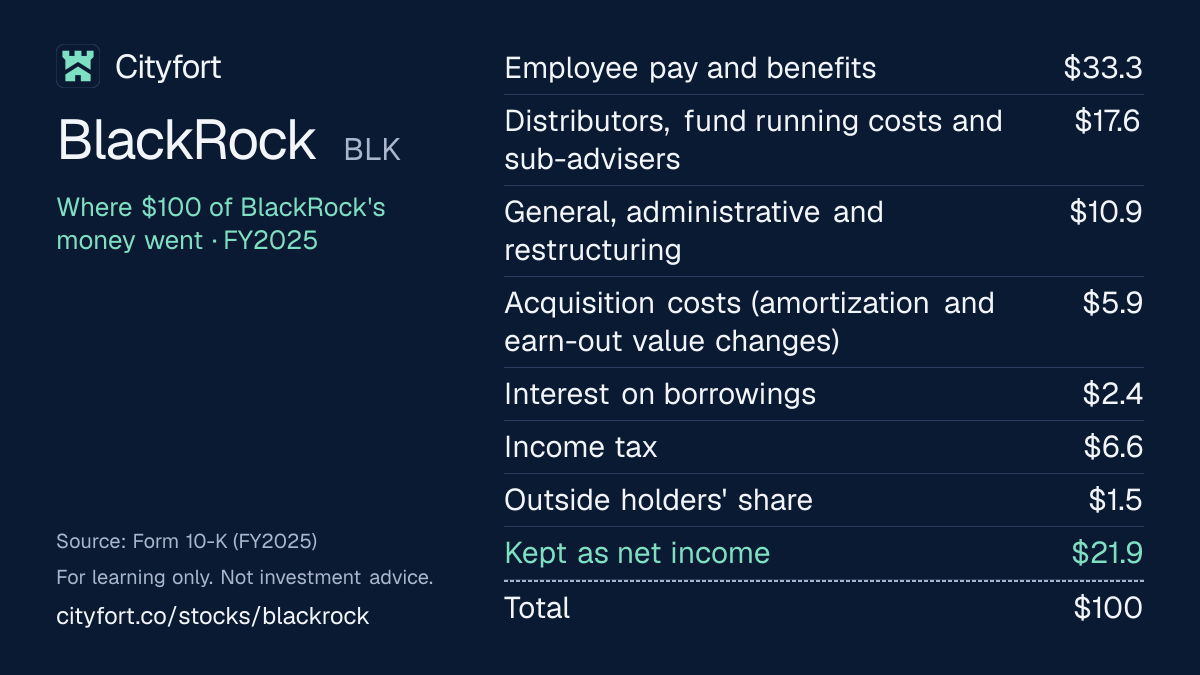
Where does $100 of BlackRock's money go?
BlackRock · FY2025
Receipt for every $100
| Employee pay and benefits | $33.3 |
|---|---|
| Distributors, fund running costs and sub-advisers | $17.6 |
| General, administrative and restructuring | $10.9 |
| Acquisition costs (amortization and earn-out value changes) | $5.9 |
| Interest on borrowings | $2.4 |
| Income tax | $6.6 |
| Outside holders' share | $1.5 |
| Kept as net income | $21.9 |
| Total | $100 |
Each line = amount ÷ total money in × 100. Lines may not add to exactly $100 because of rounding.
How this is worked out
Cityfort calculation from the FY2025 10-K: each line ÷ the $25.4 billion that came in (revenue of $24.2 billion plus $1.2 billion of investment gains, interest and dividends) × 100. Net income of $21.86 per $100 includes those non-operating gains. Operating income was 29.1% of revenue as reported, after $1.5 billion of acquisition costs, and 44.1% on BlackRock's own adjusted measure.
Save this receipt as an image:
1080 × 1350 PNG for Instagram, LinkedIn1200 × 675 PNG for X
Embed this receipt
Paste this code into a blog or website to show the receipt, with a link back to this page:
Each week: one company explained in 5 points, picked by earnings date.
Free, no tips, unsubscribe anytime.
We'll send a confirmation email. See our privacy policy.
02The business in one line
What does BlackRock do?
Investors pay BlackRock a small yearly fee on the money it manages for them; staff pay took $33.25 of every $100 that came in during FY2025, and $21.86 was left as net income.
- Base fees on iShares ETFs, index and active funds, private markets and cash funds, plus securities lending, were $19.2 billion of FY2025 revenue of $24.2 billion.
- BlackRock also sells Aladdin portfolio software and Preqin data: technology services and subscription revenue was $1.98 billion in FY2025.
03Who pays it
Who pays BlackRock?
ETF investors (iShares)
45%
of revenue
People and institutions who buy iShares ETFs: 45% of FY2025 long-term base fees and securities lending, on 42% of long-term assets at Dec 31, 2025. Shares here leave out cash management (6% of base fees) and non-base revenue.
Retail investors (outside ETFs)
25%
of revenue
Individuals investing through mutual funds and wealth platforms: 25% of long-term base fees on 10% of long-term assets. Their assets were 67% in the Americas, 28% in Europe, the Middle East and Africa, and 5% in Asia-Pacific.
Institutions, active mandates
24%
of revenue
Pension funds, insurers and other institutions that hire BlackRock to pick investments, including private markets: 24% of long-term base fees on 19% of long-term assets.
Institutions, index mandates
6%
of revenue
Institutions with index accounts: 6% of long-term base fees on 29% of long-term assets. Pension plans held $3.9 trillion with BlackRock, 62% of long-term institutional assets, and insurers $720 billion.
Technology clients
Not disclosed
Clients paying for Aladdin technology services and Preqin data: $1.98 billion of revenue in FY2025, 8.2% of total revenue. Not part of the base-fee split above.
- ETF investors (iShares)45%
- Retail investors (outside ETFs)25%
- Institutions, active mandates24%
- Institutions, index mandates6%
How spread out the customers are
BlackRock does not report revenue by client. Its 10-K names clients ending or not renewing advisory contracts as a risk. In Q2 FY2025, one institutional client took $52 billion of lower-fee index assets out in a partial redemption.
04Why it makes money
Why does BlackRock make money?
BlackRock charges a small fee on each dollar it manages, so its revenue moves with markets and with how much money clients add.
Base fees and securities lending were $19.2 billion of FY2025 revenue of $24.2 billion. Fee rates differ by product: non-ETF index funds held 29% of average assets but brought 7% of base fees, while private markets held 2% and brought 12%. Operating income per $100 of revenue fell from $38.5 in FY2021 to $29.1 in FY2025 as acquisition costs rose.
Operating income per $100 of revenue
$38.5$29.1
FY2021 to FY2025
- Clients put money into iShares ETFs, index, active, private markets and cash funds
- BlackRock charges a yearly fee, a percentage of the assets
- Market gains and new inflows raise assets, and fees with them
- Aladdin software and Preqin data add subscription revenue
- Staff, distributors and fund costs take most of the revenue
- What is left pays dividends, buybacks and acquisitions
↺ Step 6 feeds back into step 1.
05Business segments · FY2025 (BlackRock reports one operating segment; these are its revenue types)
Which businesses make up BlackRock?
Base fees and securities lending
79%Yearly fees on assets in its funds and accounts, plus securities lending. Up from $16.1 billion in FY2024 after the GIP and HPS purchases.
Revenue $19.2B
Technology services and subscriptions
8%Aladdin software and, from March 2025, Preqin data. Up 24% in FY2025.
Revenue $2.0B
Performance fees
6%Fees tied to fund returns: private markets $695 million and liquid alternatives $558 million in FY2025.
Revenue $1.4B
Distribution fees
6%Fees for distributing funds. Distribution and servicing costs paid out were $2.46 billion in FY2025.
Revenue $1.4B
Advisory and other
1%Advisory work and other revenue.
Revenue $277M
How the mix changed
- Base fees and securities lending
- Technology services and subscriptions
- Performance fees
- Distribution fees
- Advisory and other
Revenue by segment, FY2021 to FY2025.
US$
See the numbers
06The numbers · Consolidated · US$
How has BlackRock done?
Revenue
$24.2BFY2025
Revenue fell 7.7% in FY2022, when assets under management fell 14%, then rose to $24.2 billion in FY2025, and was $7.75 billion in Q3 FY2026, 19% more than a year earlier.
US$
See the numbers
Net profit
$5.6BFY2025
Net income attributable to BlackRock fell 12.8% to $5.55 billion in FY2025 while revenue rose 18.7%, after $720 million of noncash increases in payments owed for the GIP and HPS purchases and $775 million of intangible amortization.
US$
See the numbers
Profit kept per $100 of revenue
$22.9FY2025
Net income per $100 of revenue was $29.0 to $31.2 from FY2021 to FY2024 and $22.9 in FY2025, and quarterly operating margin swung from 23.7% in Q4 FY2025 to 42.0% in Q1 FY2026 with noncash changes in those payments.
$ of profit per $100 of revenue (net margin)
See the numbers
Free cash flow
$3.6BFY2025
Free cash flow, a Cityfort calculation from the FY2023 and FY2025 10-Ks (cash from operations minus spending on property and equipment), fell from $4.70 billion in FY2024 to $3.55 billion in FY2025; stock-based compensation was $1.31 billion.
US$ · cash from operations minus spending on plants and equipment
See the numbers
See all yearly numbers
EBITDA here = operating income plus depreciation and amortization (from the cash flow statement). Fiscal years are the company's own (December 31. BlackRock's fiscal year matches the calendar year: FY2025 ended Dec 31, 2025, and Q3 FY2026 ended Sep 30, 2026.). Net profit is the share belonging to the company's owners. Total net income differs from net profit to the company's owners: Total net income includes $262 million belonging to outside investors in funds BlackRock consolidates and $127 million to holders of units issued for the HPS purchase. Diluted EPS counts those units as shares.
Download BlackRock's yearly and quarterly numbers (CSV, with source ids)
Learn: Stock-based compensation and dilution: pay that becomes shares
Sources (10)
- Form 10-K, fiscal year 2023 (ended Dec 31, 2023), filed by the former parent (now BlackRock Finance, Inc.)
- Form 10-K, fiscal year 2025 (ended Dec 31, 2025)
- Q4 2025 earnings release (Form 8-K, Exhibit 99.1)
- Q4 2024 earnings release (Form 8-K, Exhibit 99.1)
- Q1 2026 earnings release (Form 8-K, Exhibit 99.1)
- Q1 2025 earnings release (Form 8-K, Exhibit 99.1)
- Q2 2026 earnings release (Form 8-K, Exhibit 99.1)
- Q2 2025 earnings release (Form 8-K, Exhibit 99.1)
- Q3 2026 earnings release (Form 8-K, Exhibit 99.1)
- Q3 2025 earnings release (Form 8-K, Exhibit 99.1)
07Who runs it
Who runs BlackRock, and did they deliver?
Laurence D. Fink
Chairman and Chief Executive Officer
His 2025 pay, as reported in the 2026 proxy, was $37,749,569, mostly stock awards ($24.6 million), against $30,768,546 in 2024. The proxy gives a CEO pay ratio of 245 to 1. He held 250,119 shares, under 1%.
Robert S. Kapito
President
2025 pay of $25,742,506, as reported in the 2026 proxy.
Adebayo Ogunlesi
Director
Founder of Global Infrastructure Partners, bought in October 2024. He held 1,794,477 shares, 1.16%, at Mar 31, 2026.
Gregg R. Lemkau
Director · since 2026
Joined the board on Jan 27, 2026, taking it to 19 members, 16 of them independent.
What they said, and what happened
2 too early to tell
Said on Feb 25, 2026
BlackRock's FY2025 10-K states an ambition to raise $400 billion in private markets by 2030.
Too early to tellWhat happened
Private markets net inflows were $15.3 billion in Q3 FY2026. The documents collected give no running total against the $400 billion.
Said on Feb 25, 2026
BlackRock's FY2025 10-K says it plans an H-Series family of private markets funds for wealth clients in 2026.
Too early to tellWhat happened
The Q3 FY2026 10-Q, the latest filing collected, was filed on Nov 4, 2026; the year has not ended.
08What could go wrong
What could go wrong for BlackRock?
- Demand
Market declines cut fees
Most revenue is a percentage of assets managed, so falling markets reduce it. In 2022, assets fell 14%, from $10.0 trillion to $8.6 trillion, and revenue fell 7.7%. The 10-K names market declines as a risk.
Watch Assets under management each quarter: $15.49 trillion at Sep 30, 2026.
- Competition
Competition and fee pressure
The 10-K says increased competition may cause assets, revenue and earnings to decline. Non-ETF index funds held 29% of average assets in FY2025 but brought 7% of base fees.
Watch Organic base fee growth: 11% annualized in Q3 FY2026.
- Execution
Acquisitions and earn-out swings
The 10-K names the risk that the GIP, Preqin and HPS purchases do not deliver expected benefits. Changes in the value of payments still owed for GIP and HPS added $564 million to costs in Q3 FY2026, after a $549 million gain in Q1 FY2026.
Watch Each quarter's change in the value of contingent consideration; the liability was $5.9 billion at Sep 30, 2026.
- Other
Performance fees swing
The 10-K says performance fees make revenue and earnings more volatile. They were $60 million in Q1 FY2025 and $754 million in Q4 FY2025.
Watch Performance fees each quarter: $630 million in Q3 FY2026.
- Technology
Aladdin's reliance on cloud providers
Microsoft Azure and Amazon Web Services host Aladdin. The 10-K says Aladdin must keep its competitive position and depends on third parties.
Watch Technology revenue and annual contract value growth: 12% in Q3 FY2026.
- Regulation
Regulation, scrutiny and lawsuits
BlackRock is regulated around the world, and a subsidiary is subject to US banking rules. The 10-K names commentary about its scale and environmental and social scrutiny as risks. Thirteen state attorneys general have sued it, alleging antitrust violations.
Watch The legal note in each 10-Q and 10-K.
- Other
Securities lending guarantees
BlackRock promises some lending clients to cover a borrower default. At Sep 30, 2026, $441 billion of securities on loan carried this promise, backed by $474 billion of collateral.
Watch The indemnified amount and collateral in each 10-Q.
- Debt
Debt from acquisitions
Borrowings rose from $7.9 billion at Dec 31, 2023 to $12.7 billion at Sep 30, 2026, after notes issued to fund the GIP and Preqin purchases. Interest cost $614 million in FY2025.
Watch Borrowings against cash: net cash of $137 million at Sep 30, 2026.
Sources (6)
- Form 10-K, fiscal year 2025 (ended Dec 31, 2025)
- Form 10-K, fiscal year 2023 (ended Dec 31, 2023), filed by the former parent (now BlackRock Finance, Inc.)
- Q3 2026 earnings release (Form 8-K, Exhibit 99.1)
- Form 10-Q, Q3 2026 (quarter ended Sep 30, 2026)
- Q1 2026 earnings release (Form 8-K, Exhibit 99.1)
- Q4 2025 earnings release (Form 8-K, Exhibit 99.1)
09Both sides
What do supporters and critics point to?
What supporters point to
- Revenue rose from $17.9 billion in FY2023 to $24.2 billion in FY2025, and Q3 FY2026 revenue was 19% higher than a year earlier.
- Clients added a net $698 billion in FY2025 and $869 billion in the 12 months to Sep 30, 2026.
- Organic base fee growth was 11% annualized in Q3 FY2026.
- Private markets base fees rose from $1.20 billion in FY2024 to $2.35 billion in FY2025.
- Cash of $12.9 billion exceeded borrowings of $12.7 billion at Sep 30, 2026.
What critics point to
- Net income attributable to BlackRock fell 12.8% in FY2025 while revenue rose 18.7%.
- Goodwill and intangible assets of $62.3 billion exceeded shareholders' equity of $58.1 billion at Sep 30, 2026.
- Payments owed for acquisitions swing profit: a $549 million gain in Q1 FY2026 and a $564 million cost in Q3 FY2026, both left out of the adjusted figures.
- FY2025 dividends, distributions and buybacks came to $5.30 billion, 149% of free cash flow.
- Thirteen state attorneys general have sued BlackRock, State Street and Vanguard, alleging antitrust violations tied to coal supply.
10What to watch next
What should you watch next at BlackRock?
Next event
Q4 and full-year FY2026 results
Date not announced yet.
Payments owed for GIP and HPS
Changes in their value added $564 million to costs in Q3 FY2026 after a $549 million gain in Q1 FY2026. The liability was $5.9 billion at Sep 30, 2026.
Organic base fee growth
BlackRock's measure was 11% annualized in Q3 FY2026 and 10% for the 12 months to Sep 30, 2026.
Private markets fundraising
Net inflows were $15.3 billion in Q3 FY2026, against the FY2025 10-K's stated ambition of $400 billion by 2030.
The states' antitrust lawsuit
Updates in the legal note of each 10-Q and 10-K.
11Key facts
Key facts about BlackRock
- What does BlackRock do?
- BlackRock, Inc. is an asset manager: it invests money for individuals, pension funds, insurers and other clients through iShares exchange-traded funds (ETFs), index and active funds, private markets funds and cash funds. It managed $15.49 trillion at Sep 30, 2026. It also sells Aladdin, its investment software. Revenue was $24.2 billion in FY2025.
- How does BlackRock make money?
- BlackRock's business model is charging a yearly fee as a percentage of the money it manages. In FY2025, base fees and securities lending were $19.2 billion, 79.2% of its $24.2 billion revenue; technology services and subscriptions were $1.98 billion, performance fees $1.42 billion and distribution fees $1.36 billion. BlackRock kept $21.86 of every $100 that came in as net income.
- Who are BlackRock's customers?
- In FY2025, ETF investors paid 45% of BlackRock's long-term base fees and securities lending, retail fund investors 25%, institutions with active mandates 24% and institutions with index mandates 6%. Pension plans held $3.9 trillion with BlackRock at Dec 31, 2025, 62% of its long-term institutional assets.
- Is BlackRock profitable?
- Yes. BlackRock's net income attributable to the company was $5.55 billion in FY2025, down 12.8% from $6.37 billion in FY2024, while revenue rose 18.7% to $24.2 billion. Diluted EPS was $35.31. In the first nine months of 2026, net income attributable to BlackRock was $5.79 billion.
- What is BlackRock's revenue by segment?
- BlackRock reports one operating segment, asset management. By type, its FY2025 revenue of $24.2 billion was base fees and securities lending $19.2 billion, technology services and subscriptions $1.98 billion, performance fees $1.42 billion, distribution fees $1.36 billion, and advisory and other $277 million.
- Who owns BlackRock?
- BlackRock, Inc. has one class of common stock, with 154.4 million shares on Oct 31, 2026, and its FY2025 10-K says it has no single majority shareholder. The 2026 proxy lists funds managed by BlackRock's own subsidiaries with 6.17% and the Kuwait Investment Authority with 5.14%. Directors and executive officers held 1.92% at Mar 31, 2026.
- How much does iShares bring BlackRock?
- BlackRock's iShares ETFs held $5.5 trillion at Dec 31, 2025. In FY2025, equity ETFs brought $6.04 billion of base fees, fixed income ETFs $1.53 billion, and digital asset, commodity and multi-asset ETFs $502 million. ETF investors added a net $527 billion during 2025.
- How much do private markets bring BlackRock?
- BlackRock's private markets base fees were $2.35 billion in FY2025, up from $1.20 billion in FY2024, after it bought Global Infrastructure Partners and HPS Investment Partners. Private markets also earned $695 million of performance fees. They were 2% of BlackRock's average assets under management but 12% of its base fees.
- How much does Aladdin bring BlackRock?
- BlackRock's technology services and subscription revenue, mostly from its Aladdin investment software, was $1.98 billion in FY2025, up 24%, including about $210 million from Preqin. It was $588 million in Q3 FY2026.
Terms on this page
- Capital expenditures (capex)
- Debt-to-equity
- Earnings per share (EPS)
- EBITDA
- Free cash flow
- Market cap
- Net debt
- Net margin
- P/E ratio
- Revenue vs net income
Each explains the term in plain English, with the same number from other companies on Cityfort.
Go deeper
More detail from the same filings. Open any section.
12What it sells
12What it sells
What does BlackRock sell?
iShares ETFs ($8.1B of base fees, FY2025)
Exchange-traded funds that track stock, bond and other indexes. Equity ETFs brought $6.04 billion of base fees, fixed income ETFs $1.53 billion, and digital asset, commodity and multi-asset ETFs $502 million. ETF assets were $5.5 trillion at Dec 31, 2025.
Non-ETF index funds and accounts ($1.32B)
Index funds and accounts outside ETFs. In FY2025 they held 29% of BlackRock's average assets but brought only 7% of its base fees.
Active funds ($6.19B)
Funds where managers pick investments: equity $2.17 billion of base fees, fixed income $2.02 billion, multi-asset $1.33 billion and liquid alternatives $669 million in FY2025.
Private markets ($2.35B)
Infrastructure funds from Global Infrastructure Partners (GIP), private credit from HPS Investment Partners, and other private investments. Assets were $323 billion at Dec 31, 2025, and private markets also earned $695 million of performance fees in FY2025.
Cash management ($1.25B)
Money market and other cash funds, holding $1.08 trillion at Dec 31, 2025.
Aladdin and Preqin technology ($1.98B revenue)
Aladdin is BlackRock's investment technology platform; Preqin, bought in March 2025, provides private markets data. Technology services and subscription revenue grew 24% in FY2025.
Securities lending ($705M)
Lending securities held in client funds to other firms for a fee. The revenue is counted inside base fees.
What it does
- Does: Charges fees as a percentage of the assets it manages for clients
- Does: Earns performance fees, mostly from private markets and liquid alternatives funds
- Does: Sells Aladdin technology services and Preqin data subscriptions
- Does: Lends securities from client funds and guarantees some of those loans against borrower default
What it does not do
- Does not: Does not take deposits or make loans to consumers: it is an asset manager, not a bank
- Does not: Does not have a single majority shareholder, its FY2025 10-K says
- Does not: Does not name its competitors in its FY2025 10-K
- Does not: Does not report revenue by where clients live: its regional split follows the BlackRock company that books the revenue
13How the money flows
13How the money flows · FY2025
How does money flow through BlackRock?
Money in
- Base fees and securities lending$19.2B
- Technology services and subscriptions$2.0B
- Performance fees$1.4B
- Distribution fees$1.4B
- Advisory and other$277M
- Investment gains, interest and dividends$1.2B
The company
BlackRock
$25.4B came in
Money out
- Employee pay and benefits$8.4B
- Distributors, fund running costs and sub-advisers$4.5B
- General, administrative and restructuring$2.8B
- Acquisition costs: intangible amortization and earn-out value changes$1.5B
- Interest on borrowings$614M
- Income tax and outside holders' share$2.1B
- Net income attributable to BlackRock$5.6B
- Clients paid BlackRock $24.2 billion in FY2025, $19.2 billion of it as base fees and securities lending on the money it manages.
- Gains, interest and dividends on BlackRock's own investments added $1.2 billion.
- Pay for about 24,900 employees took $8.4 billion. Distributors, fund running costs and sub-advisers took $4.5 billion.
- Other running costs took $2.8 billion, and noncash costs from its acquisitions $1.5 billion. Interest took $614 million.
- Tax took $1.7 billion and outside holders $389 million, leaving $5.55 billion for BlackRock's shareholders.
14What it needs to run
14What it needs to run
What does BlackRock need to run?
People
About 24,900 employees at Dec 31, 2025, up from about 21,100 a year earlier and about 19,800 at the end of 2022; about 60% work outside the US. Pay and benefits were $8.4 billion in FY2025.
Distributors
Firms that sell and service its funds. Distribution and servicing costs were $2.46 billion in FY2025.
Cloud hosting for Aladdin
The FY2025 10-K says Microsoft Azure and Amazon Web Services host Aladdin, and names reliance on third parties as a risk.
Borrowing capacity
Long-term notes of $12.9 billion at maturity value at Dec 31, 2025, a commercial paper program of up to $5 billion, and a bank credit line raised to $6.3 billion and extended to Mar 31, 2031.
15Where it sells
15Where it sells · FY2025, by the location of the BlackRock company that books the revenue, not where clients are
Where does BlackRock sell?
- Americas66%
- Europe30%
- Asia-Pacific5%
16Where growth could come from
16Where growth could come from
Where could BlackRock's growth come from?
BlackRock's FY2025 10-K, filed Feb 25, 2026, states an ambition to raise $400 billion in private markets by 2030, and plans an "H-Series" family of private markets funds for wealth clients in 2026. The documents collected give no numeric revenue or earnings guidance.
iShares ETFs
Working$135 billion of ETF net inflows, Q3 FY2026
ETF investors added a net $527 billion in 2025 and $135 billion in Q3 FY2026. ETFs paid 45% of long-term base fees in FY2025.
Status: Working, on track against what the company said.
Private markets
Working$15.3 billion of net inflows, Q3 FY2026
Private markets base fees rose from $1.20 billion in FY2024 to $2.35 billion in FY2025 after the GIP and HPS purchases. About $91 billion was committed by clients but not yet counted in assets at Dec 31, 2025.
Status: Working, on track against what the company said.
Organic base fee growth
Working11% annualized, Q3 FY2026
BlackRock's measure of base-fee growth from client flows was 6% in Q1 FY2025, 12% in Q4 FY2025, 8% in Q1 and Q2 FY2026 and 11% in Q3 FY2026. The CEO called Q2's 8% "well in excess of our target"; the release does not state the target.
Status: Working, on track against what the company said.
Aladdin and Preqin technology
Working$588 million of revenue, Q3 FY2026
Technology revenue was $588 million in Q3 FY2026, against $515 million a year earlier. Annual contract value growth was 12%, against 31% in Q4 FY2025, which included Preqin.
Status: Working, on track against what the company said.
Private markets funds for wealth clients
NewH-Series funds planned for 2026
The FY2025 10-K says BlackRock plans an H-Series family of funds and wider distribution of HPS's non-traded business development companies to wealth clients.
Status: New, recently announced.
Status compares progress with what the company itself said it would do: Working = on track against what the company said; Mixed = partly on track; Behind = behind the company's own plan; New = recently announced; Early = too early to judge.
Sources (6)
17The company's own measures (non-GAAP)
17The company's own measures · FY2025 and Q3 FY2026 (quarter ended Sep 30, 2026)
What do BlackRock's own measures show?
Official (GAAP): Operating income, FY2025
$7.0B
Company's own measure: As adjusted operating income, FY2025
$9.6B
BlackRock leaves out acquisition-related costs (intangible amortization, changes in the value of contingent payments, retention pay and deal costs), market moves on a deferred cash pay plan, restructuring, a $109 million charitable contribution in FY2025 and some tax items.
Official (GAAP): Operating income, FY2025
7,045.0%
Company's own measure: As adjusted operating margin, FY2025
44.1%
Same exclusions, divided by revenue less distribution fees and part of base fees, so the base differs from GAAP. The GAAP operating margin was 29.1%.
Official (GAAP): Diluted EPS, FY2025
$35.31
Company's own measure: As adjusted diluted EPS, FY2025
$48.09
Same exclusions. From Q3 2025 it assumes all HPS units are exchanged for shares.
Official (GAAP): Operating income, Q3 FY2026
$2.3B
Company's own measure: As adjusted operating income, Q3 FY2026
$3.3B
Same definition. The GAAP figure includes a $564 million noncash increase in contingent payments owed for the GIP and HPS purchases.
Official (GAAP): Diluted EPS, Q3 FY2026
$10.57
Company's own measure: As adjusted diluted EPS, Q3 FY2026
$15.93
Same definition. A year earlier, as adjusted EPS was $11.55 and diluted EPS $8.43.
Official (GAAP): Base fees and securities lending, Q3 FY2026
6,036.0%
Company's own measure: Organic base fee growth, Q3 FY2026 (annualized)
11%
BlackRock's own measure of organic base-fee growth, annualized, as stated in its earnings release. It was 9% for FY2025 and 10% for the 12 months to Sep 30, 2026.
Official (GAAP): Technology services and subscription revenue, Q3 FY2026
588.0%
Company's own measure: Technology annual contract value growth, Q3 FY2026
12%
BlackRock's stated year-on-year growth in technology annual contract value (ACV); it does not give the dollar value. FY2025 growth was 31% including Preqin and 16% without it.
These are the company's own measures, defined by the company. They are not comparable across companies, and they are not added together. Each sits beside the nearest official (GAAP) figure.
Learn: Non-GAAP measures: what a company's "adjusted" numbers leave out
18Financial strength and debt
18Financial strength · Sep 30, 2026
How much debt does BlackRock have?
- Total debt$12.7B
- Cash and investments$12.9B
- Net cash (cash minus debt)$137M
- Net worth (shareholders' money)$58.1B
- Debt to equity
- 0.22×
- $ of debt for every $1 of shareholders' money
- Cash includes cash held by funds BlackRock consolidates: $428 million at Dec 31, 2025. It leaves out $15.4 billion of investments at Sep 30, 2026.
- Goodwill and intangible assets, mostly from acquisitions, were $62.3 billion at Sep 30, 2026, more than BlackRock shareholders' equity of $58.1 billion (Cityfort calculation from the Q3 FY2026 10-Q).
- BlackRock also owed $5.9 billion of contingent consideration, future payments for the GIP and HPS purchases, at Sep 30, 2026.
- Total assets of $177.9 billion include pension assets held in separate accounts and collateral held for clients, which are matched by equal liabilities.
- The next notes due are $700 million in March 2027 and $800 million in July 2027.
19Who owns it
19Who owns it · ownership as of Mar 31, 2026
Who owns BlackRock?
- Officers and directors (as a group), shares
- 1.9%
Share classes
Holders of 5% or more
From the company's proxy statement (DEF 14A), later Schedule 13G filings and the share counts on its latest annual or quarterly report. Each holder row shows the date of its own filing.
Insider trades · Form 4 data as of Nov 6, 2026
What did BlackRock's insiders report trading?
BlackRock's insiders made 98 Form 4A filing an insider must make within two business days of buying or selling the company's shares. Learn more filings in the 12 months to Nov 6, 2026.
They reported no purchases and 33 sales (175,216 shares) in the open market or privately (codes P and S).
None of the sales were on forms with the Rule 10b5-1 plan box checked.
The same filings report 105 other share transactions (A: 80, F: 10, G: 10, M: 4, J: 1).
They also report 4 transactions in options, stock units or other derivatives.
Insiders are a company's officers, directors and owners of more than 10% of a class of its shares. Most changes in their holdings must be reported to the SEC on a Form 4 within two business days. Source: SEC Form 4 filings on EDGAR.
- P
- a purchase in the open market or privately
- S
- a sale in the open market or privately
- A
- a grant, award or other acquisition from the company under Rule 16b-3
- F
- shares withheld or handed over to pay an exercise price or tax when an award is received, exercised or vests
- M
- exercise or conversion of an option or other derivative, exempt under Rule 16b-3
- G
- a bona fide gift
- J
- another acquisition or disposition, described in a footnote
Code meanings: General Instruction 8 of Form 4 (SEC).
The latest 25 of 138 transactions
Shares: A = acquired, D = disposed of. A price the filing gives only in a footnote shows as “See filing”. The 10b5-1 box is checked when at least one trade on the form was made under a Rule 10b5-1 plan. A Form 4/A replaces the form it amends. See all of BlackRock's Form 4 filings on EDGAR.
Learn: How to read a proxy statement (DEF 14A): Nvidia's 2026 proxy · Form 4 insider filings: who files, the codes and the footnotes · Rule 10b5-1 trading plans: how insiders pre-schedule their trades
20What it does with profit
20What it does with profit
What does BlackRock do with its profit?
Dividend per share
$20.84FY2025
Dividend paid for each share, by financial year.
$ per share
See the numbers
Buyback · Dec 31, 2021
FY2021: paid $1.49 billion for its own shares.
$1.5B
Buyback · Dec 31, 2022
FY2022: paid $2.33 billion for its own shares.
$2.3B
Buyback · Dec 31, 2023
FY2023: paid $1.88 billion for its own shares.
$1.9B
Buyback · Dec 31, 2024
FY2024: paid $1.93 billion for its own shares.
$1.9B
Buyback · Dec 31, 2025
FY2025: paid $1.95 billion for its own shares and HPS units.
$2.0B
21Governance signals
21Governance signals
What do BlackRock's governance filings show?
- Auditor
- Deloitte & Touche LLP
- Auditor changes
- None in the period covered
- Audit qualifications
- None reported
- Related-party dealings
- The 2026 proxy says BlackRock pays the lease and trip costs of a private aircraft that director Adebayo Ogunlesi uses for business travel, under a lease taken over with GIP: $6.0 million in 2025. Deloitte's fees were $40.9 million in 2025, of which $28.6 million for the audit.
- Credit rating
- Moody's and S&P (expected ratings named in a BlackRock note term sheet filed with the SEC) Aa3 (Moody's) / AA- (S&P) (Negative (Moody's), stable (S&P), as of Mar 25, 2025), Mar 25, 2025
A credit rating describes the company's ability to repay debt. It is not a rating of the share.
Flags to know about
regulatory
State attorneys general antitrust lawsuit
Thirteen state attorneys general sued BlackRock, State Street and Vanguard in federal court in Texas, alleging antitrust violations tied to coal supply; four states add consumer-protection claims. A motion to dismiss was largely denied in 2025. BlackRock says it does not anticipate a material effect and cannot estimate a loss.
other
Chairman and CEO are the same person
Laurence Fink is both Chairman and CEO. The FY2025 10-K says more than 80% of the board is independent.
other
Executive Carry Program
Adopted Jan 13, 2026: senior executives other than the CEO may receive a share of the carried interest (profit share) from flagship private markets funds.
other
New parent company in 2024
On Oct 1, 2024, a new holding company became the parent and took the name BlackRock, Inc.; each old share became one new share. Filings for FY2023 and earlier sit under the old parent's SEC number, now BlackRock Finance, Inc.
disclosure
What BlackRock does not report
It gives technology annual contract value only as a growth rate, not in dollars, and its regional revenue follows the booking company, not where clients are. Its securities lending revenue is not split out for FY2021 and FY2022.
Sources (8)
- 2026 proxy statement (DEF 14A)
- Free writing prospectus: pricing term sheet, EUR 1.0 billion 3.750% Notes due 2035
- Form 10-Q, Q3 2026 (quarter ended Sep 30, 2026)
- Form 10-K, fiscal year 2025 (ended Dec 31, 2025)
- Form 8-K, Item 5.02: Executive Carry Program
- Form 8-K12B: GIP closing and new holding company as successor issuer (Oct 1, 2024)
- EDGAR filing index, BlackRock, Inc. (CIK 0002012383)
- Form 10-K, fiscal year 2023 (ended Dec 31, 2023), filed by the former parent (now BlackRock Finance, Inc.)
22What the market paid
22What the market paid · price as of Nov 5, 2026
What did the market pay for BlackRock on Nov 5, 2026?
Price as of Nov 5, 2026 (shown for education; prices change daily).
Price as of Nov 5, 2026: $1,170.67, the Nov 5, 2026 closing price from Nasdaq's historical price table; BlackRock's shares list on the NYSE. Times 154.4 million shares (Oct 31, 2026), that is a market value of about $180.8 billion (Cityfort calculation from the Nov 5, 2026 closing price and the Q3 FY2026 10-Q cover). Counting the 7.6 million exchangeable HPS units too, it is about $189.7 billion. P/E is price ÷ earnings per share: 26.6 on diluted EPS of $43.98 for the four quarters to Sep 30, 2026 (Cityfort calculation from the Q4 FY2025 to Q3 FY2026 earnings releases), which include noncash swings in payments owed for acquisitions. Price to book is 3.11 on shareholders' equity of $58.1 billion at Sep 30, 2026. Dividend yield is 1.96% on four quarterly dividends of $5.73.
- Share price
- $1,170.67
- Market value (market cap)
- $180.8B
- P/E
- 26.6×
- P/B
- 3.1×
More price-based ratios · as of Nov 5, 2026
Each ratio divides a number from the company's filings by the market value or share price on Nov 5, 2026. Prices change daily, so these ratios do too.
Price to sales (P/S)
6.3×
$180.8B market value ÷ $28.5B revenue (four quarters to Sep 30, 2026) = 6.3×
Cityfort calculation from the Nov 5, 2026 closing price and the Q4 FY2025 to Q3 FY2026 earnings releases. Source: BLK historical prices (Close/Last), Oct 6 to Nov 5, 2026; Form 10-Q, Q3 2026 (quarter ended Sep 30, 2026); Q3 2026 earnings release (Form 8-K, Exhibit 99.1) and 3 more
How price ratios workFree cash flow yield
2.0%
$3.6B free cash flow (FY2025) ÷ $180.8B market value = 2.0%
Cityfort calculation from the FY2025 10-K and the Nov 5, 2026 closing price. Source: BLK historical prices (Close/Last), Oct 6 to Nov 5, 2026; Form 10-Q, Q3 2026 (quarter ended Sep 30, 2026); Q3 2026 earnings release (Form 8-K, Exhibit 99.1) and 4 more
What free cash flow means
Shares used for the market value: 154.42 million ($1,170.67 × 154.42 million shares ≈ $180.8B). Source: Form 10-Q, Q3 2026 (quarter ended Sep 30, 2026); 2026 proxy statement (DEF 14A)
Source: BLK historical prices (Close/Last), Oct 6 to Nov 5, 2026; Form 10-Q, Q3 2026 (quarter ended Sep 30, 2026); Q3 2026 earnings release (Form 8-K, Exhibit 99.1) and 3 more
Sources (8)
- BLK historical prices (Close/Last), Oct 6 to Nov 5, 2026
- Form 10-Q, Q3 2026 (quarter ended Sep 30, 2026)
- Q3 2026 earnings release (Form 8-K, Exhibit 99.1)
- Q2 2026 earnings release (Form 8-K, Exhibit 99.1)
- Q1 2026 earnings release (Form 8-K, Exhibit 99.1)
- Q4 2025 earnings release (Form 8-K, Exhibit 99.1)
- Form 10-K, fiscal year 2025 (ended Dec 31, 2025)
- 2026 proxy statement (DEF 14A)
23How it got here
23How it got here
How did BlackRock get here?
2022
Crisis
Assets fall with markets
Assets under management fell 14% in 2022, to $8.6 trillion, and revenue fell 7.7%.
2024
Milestone
Borrowing for GIP and Preqin
BlackRock sold $3.0 billion of notes in March 2024 to fund part of the cash price for GIP, and $2.5 billion in July 2024 toward the cash price for Preqin.
2024
Business-model change
Global Infrastructure Partners bought, new parent company
On Oct 1, 2024, BlackRock closed the GIP purchase for about $3 billion in cash and 6.9 million shares, and a new holding company became the listed parent.
2024
Milestone
HPS deal agreed
On Dec 3, 2024, BlackRock agreed to buy HPS Investment Partners, a private credit firm, for about 12.1 million units exchangeable into its shares, including deferred and earn-out units.
2025
Business-model change
Preqin bought
On Mar 3, 2025, BlackRock closed its £2.5 billion (about $3.2 billion) cash purchase of Preqin, a private markets data firm.
2025
Business-model change
HPS purchase closed
On Jul 1, 2025, BlackRock closed the HPS purchase, issuing about 8.5 million units valued at $8.5 billion and adding $165 billion of client assets.
2025
Milestone
Net inflows of $698 billion
Clients added a net $698 billion in 2025, which BlackRock called a record, and assets reached $14.0 trillion at Dec 31, 2025.
Sources (7)
- Form 10-K, fiscal year 2025 (ended Dec 31, 2025)
- Form 10-K, fiscal year 2023 (ended Dec 31, 2023), filed by the former parent (now BlackRock Finance, Inc.)
- Form 8-K12B: GIP closing and new holding company as successor issuer (Oct 1, 2024)
- Form 8-K, Item 3.02: agreement to acquire HPS Investment Partners
- Form 8-K, Exhibit 99.1: completion of the Preqin acquisition
- Form 8-K, Exhibit 99.1: completion of the HPS Investment Partners acquisition
- Q4 2025 earnings release (Form 8-K, Exhibit 99.1)
24Sources and changes
Where every number on this page comes from
Sources (25 documents)
- S1Form 10-K, fiscal year 2025 (ended Dec 31, 2025) · BlackRock, Inc. (SEC EDGAR) · Tier 1: company or exchange filing · Feb 25, 2026
- S2Form 10-K, fiscal year 2024 (ended Dec 31, 2024) · BlackRock, Inc. (SEC EDGAR) · Tier 1: company or exchange filing · Feb 25, 2025
- S3Form 10-K, fiscal year 2023 (ended Dec 31, 2023), filed by the former parent (now BlackRock Finance, Inc.) · BlackRock, Inc. (former parent, CIK 1364742) (SEC EDGAR) · Tier 1: company or exchange filing · Feb 23, 2024
- S4Form 10-K, fiscal year 2022 (ended Dec 31, 2022), filed by the former parent (now BlackRock Finance, Inc.) · BlackRock, Inc. (former parent, CIK 1364742) (SEC EDGAR) · Tier 1: company or exchange filing · Feb 24, 2023
- S5Form 10-Q, Q3 2026 (quarter ended Sep 30, 2026) · BlackRock, Inc. (SEC EDGAR) · Tier 1: company or exchange filing · Nov 4, 2026
- S6Q3 2026 earnings release (Form 8-K, Exhibit 99.1) · BlackRock, Inc. (SEC EDGAR) · Tier 1: company or exchange filing · Oct 14, 2026
- S7Q2 2026 earnings release (Form 8-K, Exhibit 99.1) · BlackRock, Inc. (SEC EDGAR) · Tier 1: company or exchange filing · Jul 15, 2026
- S8Q1 2026 earnings release (Form 8-K, Exhibit 99.1) · BlackRock, Inc. (SEC EDGAR) · Tier 1: company or exchange filing · Apr 14, 2026
- S9Q4 2025 earnings release (Form 8-K, Exhibit 99.1) · BlackRock, Inc. (SEC EDGAR) · Tier 1: company or exchange filing · Jan 15, 2026
- S10Q3 2025 earnings release (Form 8-K, Exhibit 99.1) · BlackRock, Inc. (SEC EDGAR) · Tier 1: company or exchange filing · Oct 14, 2025
- S11Q2 2025 earnings release (Form 8-K, Exhibit 99.1) · BlackRock, Inc. (SEC EDGAR) · Tier 1: company or exchange filing · Jul 15, 2025
- S12Q1 2025 earnings release (Form 8-K, Exhibit 99.1) · BlackRock, Inc. (SEC EDGAR) · Tier 1: company or exchange filing · Apr 11, 2025
- S13Q4 2024 earnings release (Form 8-K, Exhibit 99.1) · BlackRock, Inc. (SEC EDGAR) · Tier 1: company or exchange filing · Jan 15, 2025
- S142026 proxy statement (DEF 14A) · BlackRock, Inc. (SEC EDGAR) · Tier 1: company or exchange filing · Apr 10, 2026
- S15Free writing prospectus: pricing term sheet, EUR 1.0 billion 3.750% Notes due 2035 · BlackRock, Inc. (SEC EDGAR) · Tier 1: company or exchange filing · Mar 25, 2025
- S16Form 8-K12B: GIP closing and new holding company as successor issuer (Oct 1, 2024) · BlackRock, Inc. (SEC EDGAR) · Tier 1: company or exchange filing · Oct 1, 2024
- S17Form 8-K, Exhibit 99.1: completion of the HPS Investment Partners acquisition · BlackRock, Inc. (SEC EDGAR) · Tier 1: company or exchange filing · Jul 1, 2025
- S18Form 8-K, Exhibit 99.1: completion of the Preqin acquisition · BlackRock, Inc. (SEC EDGAR) · Tier 1: company or exchange filing · Mar 3, 2025
- S19Form 8-K, Item 5.02: Executive Carry Program · BlackRock, Inc. (SEC EDGAR) · Tier 1: company or exchange filing · Jan 16, 2026
- S20Form 8-K, Item 5.02: election of Gregg R. Lemkau as director · BlackRock, Inc. (SEC EDGAR) · Tier 1: company or exchange filing · Jan 27, 2026
- S21Form 8-K, Item 1.01: Amendment No. 17 to the revolving credit agreement · BlackRock, Inc. (SEC EDGAR) · Tier 1: company or exchange filing · Apr 3, 2026
- S22Prospectus supplement (424B2): common stock issuable on redemption of HPS Subco Units · BlackRock, Inc. (SEC EDGAR) · Tier 1: company or exchange filing · Jun 30, 2026
- S23BLK historical prices (Close/Last), Oct 6 to Nov 5, 2026 · Nasdaq · Tier 1: company or exchange filing · Nov 5, 2026
- S24Form 8-K, Item 3.02: agreement to acquire HPS Investment Partners · BlackRock, Inc. (SEC EDGAR) · Tier 1: company or exchange filing · Dec 3, 2024
- S25EDGAR filing index, BlackRock, Inc. (CIK 0002012383) · SEC EDGAR · Tier 1: company or exchange filing · Nov 6, 2026
Changes to this page (v1 · Nov 6, 2026)
- v1 · Nov 6, 2026First version, through Q3 FY2026 (quarter ended Sep 30, 2026). (first version)
Numbers come only from tier 1 and tier 2 sources. Read how we research.
Disclaimer
For learning only. Cityfort is not a registered investment adviser or broker-dealer and does not recommend buying or selling any security. Prices shown are dated and may be out of date.
Investing in securities involves risk, including loss of capital. Before making any investment decision, do your own research and consider consulting a registered investment adviser or other qualified professional.
Cityfort, its owners and contributors may or may not hold securities of companies covered. Cityfort is not paid by any company it covers. Content is not an offer or solicitation to buy or sell any security, including in any initial public offering.
Read the positions policyRead the full disclaimerHide the full disclaimer
Cityfort publishes general educational content that explains how listed companies work. Cityfort is not registered with the US Securities and Exchange Commission or any state securities regulator as an investment adviser, and is not a broker-dealer or a member of FINRA. Cityfort does not provide investment, tax or legal advice, recommendations, ratings, price targets or any opinion on whether to buy, sell or hold any security. Nothing on the site is tailored to any person's circumstances.
All information is taken from publicly available sources, mainly company filings with the SEC, which are listed on each page with dates. We work to keep it accurate and correct errors publicly, but we do not guarantee that it is complete, accurate or up to date. Any market price or price-based ratio shown is dated, may be out of date by the time you read it, and is included only to explain concepts.
Statements by company management, including forward-looking statements and guidance, are reported as the company's statements, with their date and source; they are not our forecasts. Adjusted (non-GAAP) figures are the company's own measures and are shown next to the official (GAAP) figures.