Consumer Discretionary · NYSE: YUM
Yum! Brands: how the business works
Yum! Brands licenses KFC, Taco Bell and Habit Burger & Grill mostly to franchisees and runs some restaurants itself, with revenue of $8.2 billion in FY2025, before it sold Pizza Hut in 2026.
By Hardik Bhandare · Checked against filings: . Editorial policy. Corrections
Follow Yum! Brands
Email me when Yum! Brands's page is updated after earnings.
We'll send a confirmation email first. See our privacy policy.
Yum! Brands, Inc. · Louisville, Kentucky
Updated for Q3 FY2026 · checked
- Revenue, FY2025
- $8.2B
- Net income, FY2025
- $1.6B
- Restaurants after the Pizza Hut sale (Nov 3, 2026)
- More than 44,000
- Run by franchisees, Dec 31, 2025
- 97%
- Employees, Dec 31, 2025
- About 49,000
The short version
Yum! Brands in 5 points
1 · What it sells
Yum franchises and runs KFC, Taco Bell and Habit Burger & Grill restaurants, more than 44,000 after it sold Pizza Hut in 2026, and had $8.2 billion of revenue in FY2025.
2 · Who pays it
In FY2025, franchisees paid 42.3% of revenue as fees and rent and 21.9% as advertising and other contributions, and diners at company-run restaurants paid 35.9%.
3 · What it keeps from $100
Of every $100 that came in during FY2025, Yum kept $19.0 as net income and its operating profit was $31.3 per $100 of revenue, while Q3 FY2026 net income includes a $1,683 million pre-tax gain on selling Pizza Hut.
4 · Where the operating profit comes from
In FY2025, KFC earned 50.8% of division operating profit, Taco Bell 38.2%, Pizza Hut 11.5% and Habit Burger & Grill −0.4%.
5 · The one thing to watch
Taco Bell U.S. same-store sales fell 4% in Q3 FY2026, after Taco Bell division same-store sales rose 7% in Q2 FY2026.
Sources: From Yum! Brands' FY2025 10-K and Q2 and Q3 FY2026 earnings releases · checked
See the full receipt and the management scorecard below
01Where the money goes · FY2025
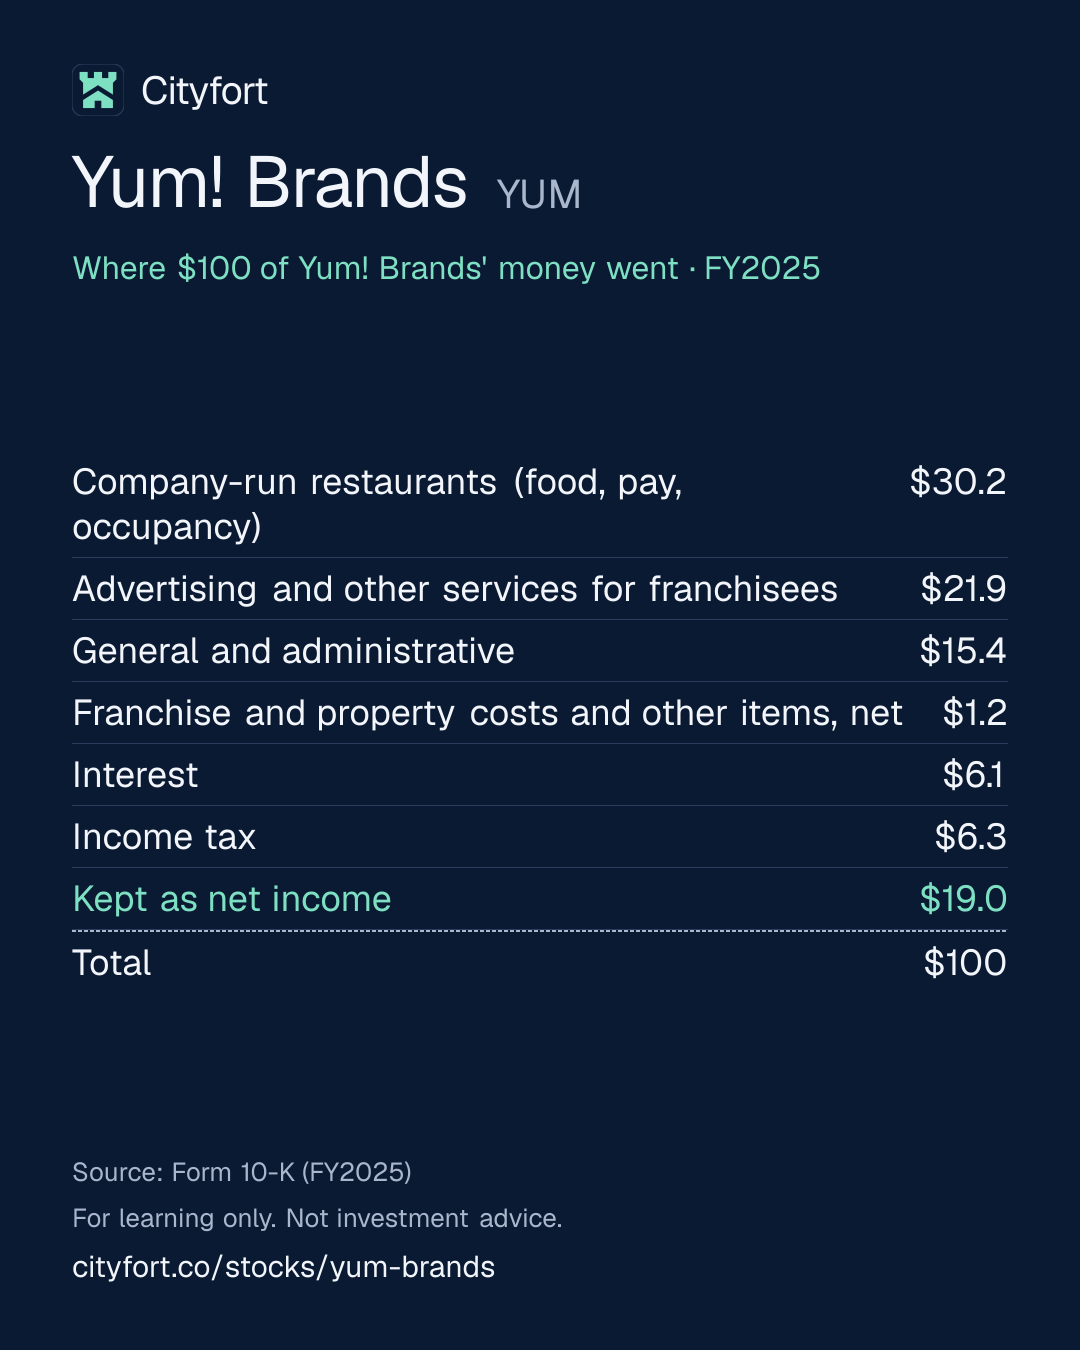
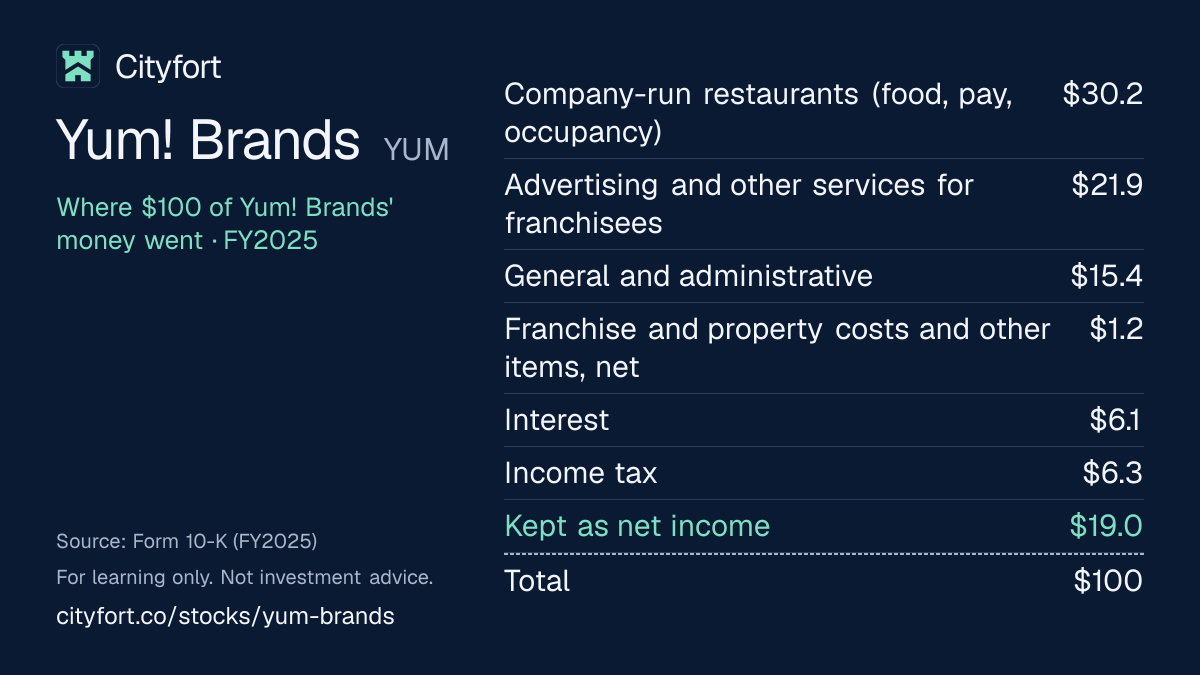
Where does $100 of Yum! Brands' money go?
Yum! Brands · FY2025
Receipt for every $100
| Company-run restaurants (food, pay, occupancy) | $30.2 |
|---|---|
| Advertising and other services for franchisees | $21.9 |
| General and administrative | $15.4 |
| Franchise and property costs and other items, net | $1.2 |
| Interest | $6.1 |
| Income tax | $6.3 |
| Kept as net income | $19.0 |
| Total | $100 |
Each line = amount ÷ total money in × 100. Lines may not add to exactly $100 because of rounding.
How this is worked out
Cityfort calculation from FY2025 10-K. Of every $100 that came in during FY2025 (revenue plus $3 million of net investment and pension income): each line = line ÷ $8,217 million × 100. The franchise, property and other line is the 10-K's total costs and expenses ($5,639 million) minus the three larger cost lines; it is net of $48 million of refranchising gains.
Save this receipt as an image:
1080 × 1350 PNG for Instagram, LinkedIn1200 × 675 PNG for X
Embed this receipt
Paste this code into a blog or website to show the receipt, with a link back to this page:
Each week: one company explained in 5 points, picked by earnings date.
Free, no tips, unsubscribe anytime.
We'll send a confirmation email. See our privacy policy.
02The business in one line
What does Yum! Brands do?
Franchisees pay Yum! Brands fees of typically 3% to 6% of their sales, and diners pay at the restaurants it runs itself; operating profit was $31.3 of every $100 of revenue in FY2025.
- In FY2025 franchisees paid 42.3% of Yum's revenue as franchise fees and rent, and 21.9% as advertising and other contributions that Yum spends for them; company-run restaurants brought in 35.9%.
- Restaurants under Yum's brands sold $68.3 billion in FY2025 (system sales, a company measure), while Yum's own revenue was $8.2 billion.
03Who pays it
Who pays Yum! Brands?
Franchisees: fees and rent
42%
of revenue
Continuing fees based on sales, upfront fees and rent, reported as franchise and property revenues ($3.5 billion).
Franchisees: advertising and other services
22%
of revenue
Franchisees' contributions for advertising and other services ($1.8 billion), which Yum spends for them; a matching $1.8 billion expense sits in costs.
Diners at company-run restaurants
36%
of revenue
Sales at the 1,617 restaurants Yum ran itself at Dec 31, 2025 ($2.9 billion).
- Franchisees: fees and rent42%
- Franchisees: advertising and other services22%
- Diners at company-run restaurants36%
How spread out the customers are
Yum's FY2025 10-K names no customer with 10% or more of revenue. Its largest franchisee is Yum China; Yum's China franchise revenues were $343 million in FY2025, 4.2% of revenue (Cityfort calculation from FY2025 10-K).
04Why it makes money
Why does Yum! Brands make money?
Franchisees pay fees on their sales, and those fees carry few direct costs for Yum.
In FY2025 franchise fees and rent were $3.5 billion against $140 million of franchise and property expenses. Company-run restaurants had $2.9 billion of sales and $2.5 billion of restaurant costs. Advertising contributions ($1.8 billion) were matched by advertising spending ($1.8 billion), so they add revenue but little profit.
Operating profit per $100 of revenue
$32.5$31.3
FY2021 to FY2025
- Yum owns the KFC, Taco Bell and Habit brands and recipes
- Franchisees invest their own money and open restaurants
- Franchisees pay fees of typically 3% to 6% of sales
- Few costs sit against those fees, so most is kept
- Cash pays interest, dividends and buybacks
- More restaurants and higher sales raise the fees
↺ Step 6 feeds back into step 1.
05Business segments · FY2025
Which businesses make up Yum! Brands?
KFC
43%KFC restaurants worldwide, 90% of them outside the U.S. It earned 50.8% of FY2025 division operating profit (Cityfort calculation from FY2025 10-K).
Revenue $3.5B · Operating profit $1.5B
Taco Bell
38%Taco Bell restaurants, 86% of them in the U.S. It earned 38.2% of FY2025 division operating profit.
Revenue $3.1B · Operating profit $1.1B
Pizza Hut
12%Pizza Hut restaurants, sold in August and September 2026. It earned 11.5% of FY2025 division operating profit.
Revenue $1.0B · Operating profit $340M
Habit Burger & Grill
7%Burger restaurants, mostly run by Yum. Its $13 million operating loss was −0.4% of FY2025 division operating profit.
Revenue $570M · Operating profit −$13M
How the mix changed
- KFC
- Taco Bell
- Pizza Hut
- Habit Burger & Grill
Revenue by segment, FY2021 to FY2025.
US$
See the numbers
06The numbers · Consolidated · US$
How has Yum! Brands done?
Revenue
$8.2BFY2025
Revenue rose every year, from $6.6 billion in FY2021 to $8.2 billion in FY2025; FY2024 had a 53rd week, and Pizza Hut is included until its 2026 sale.
US$
See the numbers
Net profit
$1.6BFY2025
Net income was between $1.3 billion and $1.6 billion a year in FY2021–FY2025; Q3 FY2026's $1.6 billion includes a $1,683 million pre-tax gain on selling Pizza Hut, and Q2 FY2026 a $359 million tax benefit tied to the sale.
US$
See the numbers
Profit kept per $100 of revenue
$19.0FY2025
Operating profit was $31.3 per $100 of revenue in FY2025, against $32.5 in FY2021; net income was $19.0 per $100.
$ of profit per $100 of revenue (net margin)
See the numbers
Free cash flow
$1.6BFY2025
Free cash flow (cash from operations minus capital spending) rose from $1.4 billion in FY2024 to $1.6 billion in FY2025.
US$ · cash from operations minus spending on plants and equipment
See the numbers
See all yearly numbers
EBITDA here = operating income plus depreciation and amortization (from the cash flow statement). Fiscal years are the company's own (Dec 31; Yum's fiscal year is the calendar year, so Q3 FY2026 is July–September 2026. FY2024 had a 53rd week for subsidiaries on a weekly calendar.). Net profit is the share belonging to the company's owners.
Download Yum! Brands's yearly and quarterly numbers (CSV, with source ids)
Learn: Fiscal years that don't end in December: Nvidia's FY2027 explained · Stock-based compensation and dilution: pay that becomes shares
Sources (10)
- Form 10-K, fiscal year 2023 (ended Dec 31, 2023)
- Form 10-K, fiscal year 2025 (ended Dec 31, 2025)
- Earnings release, Q4 and full year 2024 (Form 8-K, Ex. 99.1)
- Earnings release, Q1 2025 (Form 8-K, Ex. 99.1)
- Earnings release, Q2 2025 (Form 8-K, Ex. 99.1)
- Earnings release, Q3 2025 (Form 8-K, Ex. 99.1)
- Earnings release, Q4 and full year 2025 (Form 8-K, Ex. 99.1)
- Earnings release, Q1 2026 (Form 8-K, Ex. 99.1)
- Earnings release, Q2 2026 (Form 8-K, Ex. 99.1)
- Earnings release, Q3 2026 (Form 8-K, Ex. 99.1)
07Who runs it
Who runs Yum! Brands, and did they deliver?
Chris Turner
Chief Executive Officer · since 2025
CEO since Oct 1, 2025, succeeding David Gibbs. He was CFO from August 2019 and Chief Franchise Officer from November 2024, and earlier worked at PepsiCo and McKinsey. 2025 total pay was $9.1 million.
What they said, and what happened
1 delivered · 2 too early to tell
Said on Jun 16, 2026
Yum agreed on Jun 16, 2026 to sell Pizza Hut for about $2.7 billion in two transactions.
DeliveredWhat happened
Pizza Hut in mainland China was sold to Yum China for $1.2 billion on Aug 7, 2026, and the rest to LongRange Capital for $1,488 million on Sep 1, 2026, with a possible $75 million earn-out by 2030.
Said on Aug 5, 2026
Yum said in its Q2 FY2026 10-Q that it expects to use the Pizza Hut net proceeds to repay revolving credit borrowings and set aside most of the rest for buybacks.
Too early to tellWhat happened
In the first nine months of 2026 Yum received $2,380 million from the Pizza Hut sales, made net revolver repayments of $300 million and bought back $1,202 million of shares. Cash was $2,108 million at Sep 30, 2026.
Said on Nov 3, 2026
Yum repeated on Nov 3, 2026 its long-term targets, first announced in 2022: on average, 5% unit growth, 7% system sales growth excluding currency and at least 8% core operating profit growth.
Too early to tellWhat happened
Yum describes these as averages over an extended period. Its system sales growth excluding currency was 10%, 4% and 4% in FY2023–FY2025, and core operating profit growth 12%, 9% and 5%.
Sources (8)
- Definitive proxy statement (DEF 14A), 2026 annual meeting
- Form 8-K, Item 7.01, Ex. 99.1: agreements to sell Pizza Hut for $2.7 billion
- Form 8-K, Items 1.01 and 2.01: sale of Pizza Hut China to Yum China completed
- Form 8-K, Items 5.02 and 8.01: sale of Pizza Hut (ex-China) completed
- Form 8-K, Ex. 99.1: Yum! Brands completes sale of Pizza Hut to LongRange Capital
- Form 10-Q, Q2 2026 (quarter ended Jun 30, 2026)
- Earnings release, Q3 2026 (Form 8-K, Ex. 99.1)
- Form 10-K, fiscal year 2025 (ended Dec 31, 2025)
08What could go wrong
What could go wrong for Yum! Brands?
- Debt
Large debt and a shareholders' deficit
Yum owed $11.6 billion at Sep 30, 2026 and held $2.1 billion of cash, with a shareholders' deficit of $6.2 billion. Interest expense was $501 million in FY2025, and $1,668 million of debt falls due in 2027.
Watch Debt maturities and interest expense in each 10-Q and 10-K.
- Demand
Taco Bell U.S. sales fell
Taco Bell U.S. same-store sales fell 4% in Q3 FY2026, after Taco Bell division same-store sales rose 7% in Q2 FY2026. Taco Bell earned 38.2% of FY2025 division operating profit.
Watch Taco Bell U.S. same-store sales in the Q4 FY2026 release.
- Other
Food safety
After a Cyclospora outbreak in July 2026, Taco Bell U.S. removed certain lettuce that its vendor later recalled, the Q2 FY2026 10-Q says. The Q3 FY2026 release lists the outbreak's impact on sales and pace of recovery among its risk factors.
Watch Food safety disclosures in each 10-Q and earnings release.
- Concentration
China through Yum China
China was 26% of KFC system sales in FY2025. Yum China, Yum's largest franchisee, pays a license fee of 3% of system sales in mainland China, and the 10-K says the license agreement can end on certain events.
Watch KFC China system sales growth in each release.
- Execution
A smaller company after the Pizza Hut sale
Pizza Hut earned $340 million, 11.5% of FY2025 division operating profit. Yum's Q3 FY2026 release lists not realizing the expected benefits of the sale as a risk.
Watch Core operating profit growth excluding Pizza Hut, which Yum reported as 1% for Q3 FY2026.
- Currency
Currency moves
90% of KFC restaurants are outside the U.S. The 10-K lists currency moves, including the Chinese renminbi, Australian dollar, British pound and euro, and exchange controls as risks.
Watch The currency effect on division operating profit in each release ($48 million favorable in the first nine months of 2026).
- Legal
Legal and tax matters
An Indian penalty order of about $125 million on Yum's India subsidiary, over alleged violations of operating conditions, is stayed by the Delhi High Court; Yum denies liability. The 10-K also says a challenge to the 2016 Yum China spin-off could bring U.S. tax and China indirect transfer tax.
Watch Legal proceedings and tax notes in each 10-K.
09Both sides
What do supporters and critics point to?
What supporters point to
- Franchisees ran 97% of Yum's 63,285 restaurants at the end of 2025 and pay fees of typically 3% to 6% of their sales.
- Revenue rose every year from $6.6 billion in FY2021 to $8.2 billion in FY2025.
- KFC restaurants rose 7% in the year to Sep 30, 2026, to 35,421.
- Free cash flow was $1.6 billion in FY2025, and dividends declared rose from $2.00 a share in FY2021 to $2.84 in FY2025.
- Net debt fell from $11.2 billion at Dec 31, 2025 to $9.5 billion at Sep 30, 2026, after $2,380 million of Pizza Hut sale proceeds (Cityfort calculation from the FY2025 10-K and the Q3 FY2026 earnings release).
What critics point to
- Shareholders' equity was negative in every year from FY2021 to FY2025, and debt was $11.6 billion at Sep 30, 2026.
- Taco Bell U.S. same-store sales fell 4% in Q3 FY2026.
- Excluding Pizza Hut from both years, Yum said core operating profit grew 1% in Q3 FY2026.
- Operating profit per $100 of revenue fell from $32.5 in FY2021 to $31.3 in FY2025.
- China was 26% of KFC system sales in FY2025, and Yum China pays a license fee of 3% of mainland China system sales.
10What to watch next
What should you watch next at Yum! Brands?
Next event
Q4 FY2026 results
Date not announced yet.
Refinancing of the 2027 subsidiary notes
Yum's Q3 FY2026 10-Q lists $750 million of Subsidiary Senior Unsecured Notes due Jun 1, 2027. Unless at least $500 million is repaid or refinanced 91 days before then, Term Loan A ($484 million) falls due too. Yum said in the 10-Q that it expects to refinance the notes.
Taco Bell U.S. sales
Same-store sales fell 4% in Q3 FY2026. The CEO said in the Nov 3, 2026 earnings release that Taco Bell U.S. has outpaced the quick-service restaurant industry on same-store sales since the end of September.
Use of the Pizza Hut money
Yum bought back $1,202 million of shares in the first nine months of 2026, with a $4 billion authorization running to Jun 30, 2028. Cash was $2,108 million at Sep 30, 2026.
11Key facts
Key facts about Yum! Brands
- What does Yum! Brands do?
- Yum! Brands, Inc. owns the KFC, Taco Bell and Habit Burger & Grill restaurant brands and licenses most restaurants to franchisees. After selling Pizza Hut in August and September 2026, Yum said its system had more than 44,000 restaurants in more than 150 countries and territories. Yum's FY2025 revenue was $8.2 billion.
- How does Yum! Brands make money?
- In FY2025 Yum! Brands' revenue of $8.2 billion came from franchise and property revenues, such as fees of typically 3% to 6% of franchisees' sales (42.3%), sales at company-run restaurants (35.9%) and franchisees' contributions for advertising and other services (21.9%), which Yum spends on their behalf.
- Who are Yum! Brands' customers?
- Yum! Brands has about 1,500 franchisees, who ran 97% of its 63,285 restaurants at Dec 31, 2025. The largest is Yum China, which pays a license fee of 3% of system sales in mainland China; Yum's China franchise revenues were $343 million in FY2025. Diners at company-run restaurants paid 35.9% of FY2025 revenue.
- Is Yum! Brands profitable?
- Yes. Yum! Brands had operating profit of $2.6 billion and net income of $1.6 billion in FY2025, on revenue of $8.2 billion. Q3 FY2026 net income was $1.6 billion, including a $1,683 million pre-tax gain on selling Pizza Hut.
- What is Yum! Brands' revenue by segment?
- In FY2025 Yum! Brands' KFC division had revenue of $3.5 billion (43.1% of division revenue), Taco Bell $3.1 billion (37.7%), Pizza Hut $1.0 billion (12.3%) and Habit Burger & Grill $570 million (6.9%). Yum sold Pizza Hut in August and September 2026.
- Who owns Yum! Brands?
- Yum! Brands is widely held, with one class of common stock and one vote per share. Schedule 13GA filing by anyone who owns more than 5% of a company's shares and does not seek control. Learn more filings show BlackRock with 9.6% (Dec 31, 2024), Vanguard Capital Management with 7.53% (Mar 31, 2026), Capital International Investors with 7.2% (Dec 31, 2025) and JPMorgan Chase with 6.1% (Sep 30, 2026). Directors and executive officers held about 0.13% at Dec 31, 2025, per the 2026 proxy.
- How big is KFC within Yum! Brands?
- KFC had 33,897 restaurants in 149 countries at Dec 31, 2025, 99% franchised and 90% outside the U.S., with system sales of $36.4 billion. Yum! Brands' KFC division had FY2025 revenue of $3.5 billion and operating profit of $1.5 billion.
- How big is Taco Bell within Yum! Brands?
- Taco Bell had 9,030 restaurants at Dec 31, 2025, 93% franchised and 14% outside the U.S., with system sales of $18.4 billion. Yum! Brands' Taco Bell division had FY2025 revenue of $3.1 billion and operating profit of $1.1 billion.
- Did Yum! Brands sell Pizza Hut?
- Yes. Yum! Brands sold Pizza Hut in mainland China to Yum China for $1.2 billion on Aug 7, 2026, and the rest of Pizza Hut to LongRange Capital for $1,488 million on Sep 1, 2026. Pizza Hut had 19,974 restaurants at Dec 31, 2025 and FY2025 division revenue of $1.0 billion.
- What is Habit Burger & Grill?
- Habit Burger & Grill is Yum! Brands' smallest brand: 384 restaurants in 2 countries at Dec 31, 2025, 22% franchised, with system sales of $706 million. Yum's Habit division had FY2025 revenue of $570 million and an operating loss of $13 million.
Sources (10)
- Form 10-K, fiscal year 2025 (ended Dec 31, 2025)
- Earnings release, Q3 2026 (Form 8-K, Ex. 99.1)
- Form 8-K, Items 1.01 and 2.01: sale of Pizza Hut China to Yum China completed
- Form 8-K, Items 5.02 and 8.01: sale of Pizza Hut (ex-China) completed
- Definitive proxy statement (DEF 14A), 2026 annual meeting
- Schedule 13G, Vanguard Capital Management (event Mar 31, 2026)
- Schedule 13G/A, BlackRock, Inc. (event Dec 31, 2024)
- Schedule 13G/A, Capital International Investors (event Dec 31, 2025)
- Schedule 13G/A, JPMorgan Chase & Co. (event Sep 30, 2026)
- Form 8-K, Ex. 99.1: Yum! Brands completes sale of Pizza Hut to LongRange Capital
Terms on this page
- Capital expenditures (capex)
- Dividend payout ratio
- Earnings per share (EPS)
- EBITDA
- Free cash flow
- Interest coverage
- Market cap
- Net debt
- Net margin
- P/E ratio
Each explains the term in plain English, with the same number from other companies on Cityfort.
Go deeper
More detail from the same filings. Open any section.
12What it sells
12What it sells
What does Yum! Brands sell?
KFC (division revenue $3.5B in FY2025)
Fried chicken restaurants: 33,897 at Dec 31, 2025 in 149 countries, 99% franchised, with system sales of $36.4 billion.
Taco Bell ($3.1B)
Mexican-style quick-service restaurants: 9,030 at Dec 31, 2025, 93% franchised and 14% outside the U.S., with system sales of $18.4 billion.
Habit Burger & Grill ($570M)
Burger restaurants: 384 at Dec 31, 2025 in 2 countries, 22% franchised, with system sales of $706 million.
Pizza Hut ($1.0B, sold in 2026)
19,974 restaurants at Dec 31, 2025. Yum sold Pizza Hut in mainland China on Aug 7, 2026 and the rest on Sep 1, 2026.
What it does
- Does: Charges franchisees fees of typically 3% to 6% of their restaurants' sales
- Does: Collects franchisees' advertising contributions and spends them on advertising and other services
- Does: Runs 1,617 restaurants itself (Dec 31, 2025)
- Does: Licenses KFC in mainland China to Yum China for 3% of system sales
What it does not do
- Does not: Does not count franchisees' food sales as revenue: of $68.3 billion of FY2025 system sales, Yum's revenue was $8.2 billion
- Does not: Does not own Pizza Hut since September 2026
13How the money flows
13How the money flows · FY2025
How does money flow through Yum! Brands?
Money in
- Franchise fees and rent$3.5B
- Sales at company-run restaurants$2.9B
- Franchisees' advertising and other contributions$1.8B
- Investment and pension income, net$3M
The company
Yum! Brands
$8.2B came in
Money out
- Company-run restaurants (food, pay, occupancy)$2.5B
- Advertising and other services for franchisees$1.8B
- General and administrative costs$1.3B
- Franchise and property costs and other items, net$95M
- Interest$501M
- Income tax$518M
- Net income$1.6B
- Franchisees paid Yum $3.5 billion of fees and rent in FY2025, plus $1.8 billion for advertising and other services.
- Diners at company-run restaurants paid $2.9 billion, and those restaurants cost $2.5 billion to run.
- Yum spent $1.8 billion on advertising and other services for franchisees, about what they paid in.
- General and administrative costs took $1.3 billion, leaving $2.6 billion of operating profit.
- After $501 million of interest and $518 million of tax, $1.6 billion was left as net income: $19.0 of every $100 that came in.
14What it needs to run
14What it needs to run
What does Yum! Brands need to run?
Franchisees
About 1,500 franchisees pay for the land, buildings and equipment of their restaurants. About 40% of franchised units, including over 17,000 in mainland China, run under master franchise agreements.
People
About 49,000 employees at Dec 31, 2025 (28,000 in the U.S.). Franchised restaurants employ more than 1 million people, according to the FY2025 10-K.
Company-run restaurants
1,617 at Dec 31, 2025, up from 1,051 at the end of 2021. In 2025 Yum bought 128 Taco Bell restaurants in the Southeast U.S. for $666 million.
Borrowed money
At Dec 31, 2025, about 96% of the $11.5 billion of debt excluding the revolving facility and finance leases was at fixed rates, including swaps. Of that $11.5 billion, $4.3 billion was Securitization Notes repaid from the fees of U.S. Taco Bell restaurants.
15Where it sells
15Where it sells · FY2025
Where does Yum! Brands sell?
- United States55%
- United Kingdom12%
- Other countries33%
16Where growth could come from
16Where growth could come from
Where could Yum! Brands' growth come from?
Yum said in its Q3 FY2026 earnings release (Nov 3, 2026) that it targets, on average over an extended period, 5% unit growth, 7% system sales growth excluding currency and at least 8% core operating profit growth. It first announced these targets in 2022.
New KFC restaurants
WorkingKFC units +7%, Q3 FY2026
KFC had 35,421 restaurants at Sep 30, 2026, up 7% in a year, with 878 gross openings in 66 countries in the quarter.
Status: Working, on track against what the company said.
Taco Bell outside the U.S.
WorkingSystem sales +14% excluding currency, Q3 FY2026
Taco Bell International same-store sales rose 5% in Q3 FY2026. Taco Bell had 9,102 restaurants at Sep 30, 2026, up 3%.
Status: Working, on track against what the company said.
Taco Bell U.S.
MixedSame-store sales −4%, Q3 FY2026
Taco Bell U.S. system sales fell 3% in Q3 FY2026. The CEO said in the release that Taco Bell U.S. has outpaced the quick-service restaurant industry on same-store sales since the end of September.
Status: Mixed, partly on track.
Digital orders
WorkingDigital mix 64%, Q3 FY2026
Digital system sales (orders placed mainly through automated technology such as apps and kiosks) were over $9 billion in Q3 FY2026, excluding Pizza Hut. Yum said FY2025 digital mix was nearly 60%.
Status: Working, on track against what the company said.
Saucy test restaurants
Early15 test stores in 2026
KFC's company-run restaurant margin fell to 12.3% from 13.7% in Q3 FY2026, which Yum said was mainly due to 15 lower-margin stores being tested under the Saucy brand.
Status: Early, too early to judge.
Status compares progress with what the company itself said it would do: Working = on track against what the company said; Mixed = partly on track; Behind = behind the company's own plan; New = recently announced; Early = too early to judge.
17The company's own measures (non-GAAP)
17The company's own measures · FY2025 to Q3 FY2026
What do Yum! Brands' own measures show?
Official (GAAP): Diluted EPS, FY2025
$5.55
Company's own measure: EPS excluding Special Items, FY2025 (Yum's measure)
$6.05
Leaves out what Yum calls Special Items: $122 million of operating charges, such as Pizza Hut review costs, and tax items such as a $108 million tax reserve for a Mexican subsidiary.
Official (GAAP): Diluted EPS, Q2 FY2026
$3.08
Company's own measure: EPS excluding Special Items, Q2 FY2026 (Yum's measure)
$1.62
Leaves out a $359 million deferred tax benefit tied to the planned Pizza Hut sale and a $91 million tax benefit from moving intellectual property.
Official (GAAP): Diluted EPS, Q3 FY2026
$5.92
Company's own measure: EPS excluding Special Items, Q3 FY2026 (Yum's measure)
$1.56
Leaves out the $1,683 million pre-tax gain on selling Pizza Hut and $459 million of tax on Special Items, among other items.
Official (GAAP): Operating profit growth, FY2025 (Cityfort calculation from FY2025 10-K)
7.1%
Company's own measure: Core operating profit growth, FY2025 (Yum's measure)
5%
Operating profit growth leaving out Special Items and currency moves.
Official (GAAP): Revenue, FY2025
$8.2B
Company's own measure: System sales, FY2025
$68.3B
Sales at all restaurants under Yum's brands, company-run and franchised, including Pizza Hut. Franchisees' sales are not Yum's revenue; Yum earns fees on them.
Official (GAAP): Revenue growth, FY2025 (Cityfort calculation from FY2025 10-K)
8.8%
Company's own measure: Same-store sales growth, FY2025
3%
Yum's estimate of the change in system sales at restaurants open for a year or more, company-run and franchised, including Pizza Hut.
These are the company's own measures, defined by the company. They are not comparable across companies, and they are not added together. Each sits beside the nearest official (GAAP) figure.
Learn: Non-GAAP measures: what a company's "adjusted" numbers leave out
18Financial strength and debt
18Financial strength · Sep 30, 2026
How much debt does Yum! Brands have?
- Total debt$11.6B
- Cash and investments$2.1B
- Net debt (debt minus cash)$9.5B
- Net worth (shareholders' money)−$6.2B
- Interest cover
- 5.1×
- how many times operating profit covers interest
- Debt is short-term borrowings ($2,141 million) plus long-term debt ($9,459 million) at Sep 30, 2026, including finance leases. Net debt is a Cityfort calculation from the Q3 FY2026 earnings release, and the 4.7 times figure from it and the FY2025 10-K.
- Operating lease liabilities are not counted as debt here: $1,279 million at Dec 31, 2025.
- Shareholders' equity was negative in every year on this page: a deficit of $7.3 billion at Dec 31, 2025 and $6.2 billion at Sep 30, 2026, so debt-to-equity is not shown.
- Yum reported a consolidated net leverage ratio of 5.0 times EBITDA at the end of 2022 and 3.7 times at Sep 30, 2025. Its credit agreement caps total leverage at 5.0 times.
- At Dec 31, 2025, $1,668 million of debt was due in 2027 and $2,019 million in 2028. Interest coverage (FY2025 operating profit ÷ net interest expense) is a Cityfort calculation from the FY2025 10-K.
19Who owns it
19Who owns it · ownership as of Dec 31, 2025
Who owns Yum! Brands?
- Officers and directors (as a group), shares
- 0.1%
Share classes
Holders of 5% or more
From the company's proxy statement (DEF 14A), later Schedule 13G filings and the share counts on its latest annual or quarterly report. Each holder row shows the date of its own filing.
Insider trades · Form 4 data as of Nov 6, 2026
What did Yum! Brands' insiders report trading?
Yum! Brands' insiders made 85 Form 4A filing an insider must make within two business days of buying or selling the company's shares. Learn more filings in the 12 months to Nov 6, 2026.
They reported no purchases and 46 sales (99,109 shares) in the open market or privately (codes P and S).
35 of the 46 sales were on forms with the Rule 10b5-1 plan box checked.
The same filings report 94 other share transactions (M: 43, F: 26, D: 19, A: 6).
They also report 175 transactions in options, stock units or other derivatives.
Insiders are a company's officers, directors and owners of more than 10% of a class of its shares. Most changes in their holdings must be reported to the SEC on a Form 4 within two business days. Source: SEC Form 4 filings on EDGAR.
- P
- a purchase in the open market or privately
- S
- a sale in the open market or privately
- A
- a grant, award or other acquisition from the company under Rule 16b-3
- D
- shares handed back to the company under Rule 16b-3
- F
- shares withheld or handed over to pay an exercise price or tax when an award is received, exercised or vests
- M
- exercise or conversion of an option or other derivative, exempt under Rule 16b-3
Code meanings: General Instruction 8 of Form 4 (SEC).
The latest 25 of 140 transactions
Shares: A = acquired, D = disposed of. A price the filing gives only in a footnote shows as “See filing”. The 10b5-1 box is checked when at least one trade on the form was made under a Rule 10b5-1 plan. A Form 4/A replaces the form it amends. See all of Yum! Brands' Form 4 filings on EDGAR.
Learn: How to read a proxy statement (DEF 14A): Nvidia's 2026 proxy · Form 4 insider filings: who files, the codes and the footnotes · Rule 10b5-1 trading plans: how insiders pre-schedule their trades
Sources (9)
- Form 10-Q, Q3 2026 (quarter ended Sep 30, 2026)
- Definitive proxy statement (DEF 14A), 2026 annual meeting
- Schedule 13G/A, BlackRock, Inc. (event Dec 31, 2024)
- Schedule 13G, Vanguard Capital Management (event Mar 31, 2026)
- Schedule 13G/A, Capital International Investors (event Dec 31, 2025)
- Schedule 13G/A, JPMorgan Chase & Co. (event Sep 30, 2026)
- Schedule 13G, Vanguard Portfolio Management (event Mar 31, 2026)
- Schedule 13G/A, The Vanguard Group (event Mar 13, 2026)
- Schedule 13G/A, T. Rowe Price Investment Management (event Mar 31, 2026)
20What it does with profit
20What it does with profit
What does Yum! Brands do with its profit?
Dividend per share
$2.84FY2025
Dividend paid for each share, by financial year.
$ per share
See the numbers
Buyback · Dec 31, 2025
Bought back shares for $552 million in 2025.
$552M
Buyback · Jun 30, 2026
In June 2026 the board authorized up to $4 billion of further buybacks through Jun 30, 2028; $0.4 billion was left under the May 2024 $2 billion authorization at Jun 30, 2026.
$4.0B
Buyback · Sep 30, 2026
Bought back shares for $1,202 million in the first nine months of 2026, $528 million of it in Q3 (Cityfort calculation from the Q2 FY2026 and Q3 FY2026 earnings releases).
$1.2B
21Governance signals
21Governance signals
What do Yum! Brands' governance filings show?
- Auditor
- KPMG LLP, since 1997
- Auditor changes
- None in the period covered
- Audit qualifications
- None reported
- Related-party dealings
- This version of the page does not summarize the related-person transactions section of the 2026 proxy. Fees paid to KPMG were $9.3 million for 2025, including $7.4 million of audit fees.
- Credit rating
- S&P and Moody's, as stated in Yum's 10-Q BB+ (S&P) and Ba2 (Moody's) (outlook not stated in the filings), Nov 6, 2026
A credit rating describes the company's ability to repay debt. It is not a rating of the share.
Flags to know about
regulatory
India penalty order, stayed by court
In January 2020 India's Directorate of Enforcement ordered a penalty of about $125 million on Yum's India subsidiary and some former directors, mainly over alleged violations of operating conditions set in 1993 and 1994. The Delhi High Court stayed the order in March 2020; Yum denies liability.
disclosure
Pizza Hut not shown as discontinued operations
Yum's results include Pizza Hut until the 2026 sale dates. Q3 FY2026 operating profit of $2,317 million includes a $1,683 million pre-tax gain on the sale; without it, operating profit was $634 million (Cityfort calculation from the Q3 FY2026 earnings release).
other
CEO pay ratio
The 2026 proxy states a CEO pay ratio of 1,167 to 1. The median employee was a part-time Taco Bell U.S. worker paid $15,346.
22What the market paid
22What the market paid · price as of Nov 5, 2026
What did the market pay for Yum! Brands on Nov 5, 2026?
Price as of Nov 5, 2026 (shown for education; prices change daily).
Price as of Nov 5, 2026: Yum closed at $166.09 (Nasdaq historical data; Yum is listed on the NYSE). Times 268.3 million shares (Oct 30, 2026) that is a market value of about $44.6 billion (Cityfort calculation from the Nov 5, 2026 closing price and the Q3 FY2026 10-Q cover). P/E is price ÷ earnings per share: 13.3 on diluted EPS of $12.46 for the 12 months to Sep 30, 2026 (Cityfort calculation from the Q4 FY2025 to Q3 FY2026 earnings releases). That EPS includes the Pizza Hut sale gain and the Q2 FY2026 tax benefit. The declared quarterly dividend of $0.75 adds up to $3.00 a year, 1.8% of that price.
- Share price
- $166.09
- Market value (market cap)
- $44.6B
- P/E
- 13.3×
More price-based ratios · as of Nov 5, 2026
Each ratio divides a number from the company's filings by the market value or share price on Nov 5, 2026. Prices change daily, so these ratios do too.
Price to sales (P/S)
5.1×
$44.6B market value ÷ $8.8B revenue (four quarters to Sep 30, 2026) = 5.1×
Cityfort calculation from the Nov 5, 2026 closing price and the Q4 FY2025 to Q3 FY2026 earnings releases. Source: YUM historical prices, closing price Nov 5, 2026 (Nasdaq historical data); Form 10-Q, Q3 2026 (quarter ended Sep 30, 2026); Earnings release, Q3 2026 (Form 8-K, Ex. 99.1) and 3 more
How price ratios workDividend yield
1.71%
$2.84 dividends per share (FY2025) ÷ $166.09 share price = 1.71%
Cityfort calculation from the FY2025 10-K and the Nov 5, 2026 closing price. Source: YUM historical prices, closing price Nov 5, 2026 (Nasdaq historical data); Form 10-Q, Q3 2026 (quarter ended Sep 30, 2026); Earnings release, Q3 2026 (Form 8-K, Ex. 99.1) and 4 more
What dividend yield meansFree cash flow yield
3.7%
$1.6B free cash flow (FY2025) ÷ $44.6B market value = 3.7%
Cityfort calculation from the FY2025 10-K and the Nov 5, 2026 closing price. Source: YUM historical prices, closing price Nov 5, 2026 (Nasdaq historical data); Form 10-Q, Q3 2026 (quarter ended Sep 30, 2026); Earnings release, Q3 2026 (Form 8-K, Ex. 99.1) and 4 more
What free cash flow means
Shares used for the market value: 268.3 million ($166.09 × 268.3 million shares ≈ $44.6B). Source: Form 10-Q, Q3 2026 (quarter ended Sep 30, 2026); Definitive proxy statement (DEF 14A), 2026 annual meeting
Source: YUM historical prices, closing price Nov 5, 2026 (Nasdaq historical data); Form 10-Q, Q3 2026 (quarter ended Sep 30, 2026); Earnings release, Q3 2026 (Form 8-K, Ex. 99.1) and 3 more
Sources (8)
- YUM historical prices, closing price Nov 5, 2026 (Nasdaq historical data)
- Form 10-Q, Q3 2026 (quarter ended Sep 30, 2026)
- Earnings release, Q3 2026 (Form 8-K, Ex. 99.1)
- Earnings release, Q2 2026 (Form 8-K, Ex. 99.1)
- Earnings release, Q1 2026 (Form 8-K, Ex. 99.1)
- Earnings release, Q4 and full year 2025 (Form 8-K, Ex. 99.1)
- Form 10-K, fiscal year 2025 (ended Dec 31, 2025)
- Definitive proxy statement (DEF 14A), 2026 annual meeting
23How it got here
23How it got here
How did Yum! Brands get here?
2016
Business-model change
Yum China spun off
On Oct 31, 2016 Yum spun off its China business as Yum China, which became its largest franchisee, paying a license fee of 3% of mainland China system sales.
2022
Milestone
Long-term targets set
Yum first announced its long-term targets of 5% unit growth, 7% system sales growth excluding currency and at least 8% core operating profit growth.
2023
Milestone
Exit from Russia
Yum received $121 million from selling its KFC Russia business in FY2023.
2025
Milestone
Bought Taco Bell restaurants
Yum bought 128 Taco Bell restaurants in the Southeast U.S. for $666 million, and company-run restaurants rose from 1,311 to 1,617 in FY2025.
2025
Milestone
New CEO
Chris Turner, CFO since 2019, became CEO on Oct 1, 2025, succeeding David Gibbs.
2025
Business-model change
Pizza Hut review
On Nov 4, 2025 Yum said it was reviewing strategic options for Pizza Hut.
2026
Business-model change
Pizza Hut sold
Yum sold Pizza Hut in mainland China to Yum China on Aug 7, 2026 and the rest to LongRange Capital on Sep 1, 2026, about $2.7 billion in total.
Sources (7)
- Form 10-K, fiscal year 2025 (ended Dec 31, 2025)
- Earnings release, Q3 2026 (Form 8-K, Ex. 99.1)
- Definitive proxy statement (DEF 14A), 2026 annual meeting
- Form 8-K, Ex. 99.2: review of strategic options for Pizza Hut
- Form 8-K, Items 1.01 and 2.01: sale of Pizza Hut China to Yum China completed
- Form 8-K, Items 5.02 and 8.01: sale of Pizza Hut (ex-China) completed
- Form 8-K, Ex. 99.1: Yum! Brands completes sale of Pizza Hut to LongRange Capital
24Sources and changes
Where every number on this page comes from
Sources (28 documents)
- S1Form 10-K, fiscal year 2025 (ended Dec 31, 2025) · Yum! Brands, Inc. (SEC EDGAR) · Tier 1: company or exchange filing · Feb 20, 2026
- S2Form 10-K, fiscal year 2023 (ended Dec 31, 2023) · Yum! Brands, Inc. (SEC EDGAR) · Tier 1: company or exchange filing · Feb 20, 2024
- S3Form 10-K, fiscal year 2022 (ended Dec 31, 2022) · Yum! Brands, Inc. (SEC EDGAR) · Tier 1: company or exchange filing · Feb 27, 2023
- S4Form 10-Q, Q2 2026 (quarter ended Jun 30, 2026) · Yum! Brands, Inc. (SEC EDGAR) · Tier 1: company or exchange filing · Aug 5, 2026
- S6Form 10-Q, Q3 2025 (quarter ended Sep 30, 2025) · Yum! Brands, Inc. (SEC EDGAR) · Tier 1: company or exchange filing · Nov 7, 2025
- S7Earnings release, Q3 2026 (Form 8-K, Ex. 99.1) · Yum! Brands, Inc. (SEC EDGAR) · Tier 1: company or exchange filing · Nov 3, 2026
- S8Earnings release, Q2 2026 (Form 8-K, Ex. 99.1) · Yum! Brands, Inc. (SEC EDGAR) · Tier 1: company or exchange filing · Jul 30, 2026
- S9Earnings release, Q1 2026 (Form 8-K, Ex. 99.1) · Yum! Brands, Inc. (SEC EDGAR) · Tier 1: company or exchange filing · Apr 29, 2026
- S10Earnings release, Q4 and full year 2025 (Form 8-K, Ex. 99.1) · Yum! Brands, Inc. (SEC EDGAR) · Tier 1: company or exchange filing · Feb 4, 2026
- S11Earnings release, Q3 2025 (Form 8-K, Ex. 99.1) · Yum! Brands, Inc. (SEC EDGAR) · Tier 1: company or exchange filing · Nov 4, 2025
- S12Earnings release, Q2 2025 (Form 8-K, Ex. 99.1) · Yum! Brands, Inc. (SEC EDGAR) · Tier 1: company or exchange filing · Aug 5, 2025
- S13Earnings release, Q1 2025 (Form 8-K, Ex. 99.1) · Yum! Brands, Inc. (SEC EDGAR) · Tier 1: company or exchange filing · Apr 30, 2025
- S14Earnings release, Q4 and full year 2024 (Form 8-K, Ex. 99.1) · Yum! Brands, Inc. (SEC EDGAR) · Tier 1: company or exchange filing · Feb 6, 2025
- S15Definitive proxy statement (DEF 14A), 2026 annual meeting · Yum! Brands, Inc. (SEC EDGAR) · Tier 1: company or exchange filing · Apr 3, 2026
- S16Form 8-K, Ex. 99.2: review of strategic options for Pizza Hut · Yum! Brands, Inc. (SEC EDGAR) · Tier 1: company or exchange filing · Nov 4, 2025
- S17Form 8-K, Item 7.01, Ex. 99.1: agreements to sell Pizza Hut for $2.7 billion · Yum! Brands, Inc. (SEC EDGAR) · Tier 1: company or exchange filing · Jun 16, 2026
- S18Form 8-K, Items 1.01 and 2.01: sale of Pizza Hut China to Yum China completed · Yum! Brands, Inc. (SEC EDGAR) · Tier 1: company or exchange filing · Aug 7, 2026
- S19Form 8-K, Items 5.02 and 8.01: sale of Pizza Hut (ex-China) completed · Yum! Brands, Inc. (SEC EDGAR) · Tier 1: company or exchange filing · Sep 1, 2026
- S20Form 8-K, Ex. 99.1: Yum! Brands completes sale of Pizza Hut to LongRange Capital · Yum! Brands, Inc. (SEC EDGAR) · Tier 1: company or exchange filing · Sep 1, 2026
- S21Schedule 13G/A, The Vanguard Group (event Mar 13, 2026) · Yum! Brands, Inc. (SEC EDGAR) · Tier 1: company or exchange filing · Mar 27, 2026
- S22Schedule 13G, Vanguard Capital Management (event Mar 31, 2026) · Yum! Brands, Inc. (SEC EDGAR) · Tier 1: company or exchange filing · Apr 30, 2026
- S23Schedule 13G, Vanguard Portfolio Management (event Mar 31, 2026) · Yum! Brands, Inc. (SEC EDGAR) · Tier 1: company or exchange filing · Apr 29, 2026
- S24Schedule 13G/A, BlackRock, Inc. (event Dec 31, 2024) · Yum! Brands, Inc. (SEC EDGAR) · Tier 1: company or exchange filing · Feb 5, 2025
- S25Schedule 13G/A, Capital International Investors (event Dec 31, 2025) · Yum! Brands, Inc. (SEC EDGAR) · Tier 1: company or exchange filing · Feb 13, 2026
- S26Schedule 13G/A, JPMorgan Chase & Co. (event Sep 30, 2026) · Yum! Brands, Inc. (SEC EDGAR) · Tier 1: company or exchange filing · Oct 16, 2026
- S27Schedule 13G/A, T. Rowe Price Investment Management (event Mar 31, 2026) · Yum! Brands, Inc. (SEC EDGAR) · Tier 1: company or exchange filing · May 15, 2026
- S28YUM historical prices, closing price Nov 5, 2026 (Nasdaq historical data) · Nasdaq · Tier 1: company or exchange filing · Nov 6, 2026
- S30Form 10-Q, Q3 2026 (quarter ended Sep 30, 2026) · Yum! Brands, Inc. (SEC EDGAR) · Tier 1: company or exchange filing · Nov 6, 2026
Changes to this page (v1 · Nov 6, 2026)
- v1 · Nov 6, 2026First version, through Q3 FY2026 (quarter ended Sep 30, 2026) from the Nov 3, 2026 release. Share count, debt terms and credit ratings from the Q3 FY2026 10-Q filed Nov 6, 2026. (first version)
Numbers come only from tier 1 and tier 2 sources. Read how we research.
Disclaimer
For learning only. Cityfort is not a registered investment adviser or broker-dealer and does not recommend buying or selling any security. Prices shown are dated and may be out of date.
Investing in securities involves risk, including loss of capital. Before making any investment decision, do your own research and consider consulting a registered investment adviser or other qualified professional.
Cityfort, its owners and contributors may or may not hold securities of companies covered. Cityfort is not paid by any company it covers. Content is not an offer or solicitation to buy or sell any security, including in any initial public offering.
Read the positions policyRead the full disclaimerHide the full disclaimer
Cityfort publishes general educational content that explains how listed companies work. Cityfort is not registered with the US Securities and Exchange Commission or any state securities regulator as an investment adviser, and is not a broker-dealer or a member of FINRA. Cityfort does not provide investment, tax or legal advice, recommendations, ratings, price targets or any opinion on whether to buy, sell or hold any security. Nothing on the site is tailored to any person's circumstances.
All information is taken from publicly available sources, mainly company filings with the SEC, which are listed on each page with dates. We work to keep it accurate and correct errors publicly, but we do not guarantee that it is complete, accurate or up to date. Any market price or price-based ratio shown is dated, may be out of date by the time you read it, and is included only to explain concepts.
Statements by company management, including forward-looking statements and guidance, are reported as the company's statements, with their date and source; they are not our forecasts. Adjusted (non-GAAP) figures are the company's own measures and are shown next to the official (GAAP) figures.