Consumer Discretionary · NASDAQ: TSCO
Tractor Supply: how the business works
Tractor Supply sells livestock feed, pet food, tools and garden supplies through 2,621 stores in small towns and rural areas of the US, with $15.52 billion of net sales in FY2025.
By Hardik Bhandare · Checked against filings: . Editorial policy. Corrections
Follow Tractor Supply
Email me when Tractor Supply's page is updated after earnings.
We'll send a confirmation email first. See our privacy policy.
Tractor Supply Company · Brentwood, Tennessee · Founded 1938
Updated for Q3 FY2026 · checked
- Net sales, FY2025
- $15.52B
- Net income, FY2025
- $1.10B
- Stores, Sep 26, 2026
- 2,621
- Team members, Oct 2026
- 54,000+
- Founded
- 1938
The short version
Tractor Supply in 5 points
1 · What it sells
Tractor Supply sells livestock feed, pet food, tools, lawn and garden supplies and clothing in 2,621 stores on Sep 26, 2026 and online, with net sales of $15.52 billion in FY2025.
2 · Who pays it
Individual shoppers pay Tractor Supply, and no large customer is named; by product category, FY2025 net sales were 27% Livestock, Equine & Agriculture, 24% Companion Animal, 24% Seasonal & Recreation, 15% Truck, Tool & Hardware and 10% Clothing, Gift & Decor.
3 · What it keeps from $100
Of every $100 of FY2025 net sales, Tractor Supply kept $7.1 as net income, with no large one-off item that year; operating income, before interest and tax, was $1.47 billion.
4 · Where the operating profit comes from
Tractor Supply reports one segment, the retail sale of rural lifestyle products, so all of its $1.47 billion of FY2025 operating income came from its stores and websites.
5 · The one thing to watch
Comparable store sales fell 0.3% in the first nine months of FY2026, and on Jul 23, 2026 Tractor Supply cut its FY2026 range for them to a fall of 1% to flat, from growth of 1% to 3%.
Sources: From Tractor Supply's FY2025 10-K, its Q3 FY2026 10-Q and its earnings releases of Jan 29, Jul 23 and Oct 22, 2026 · checked
01Where the money goes · FY2025
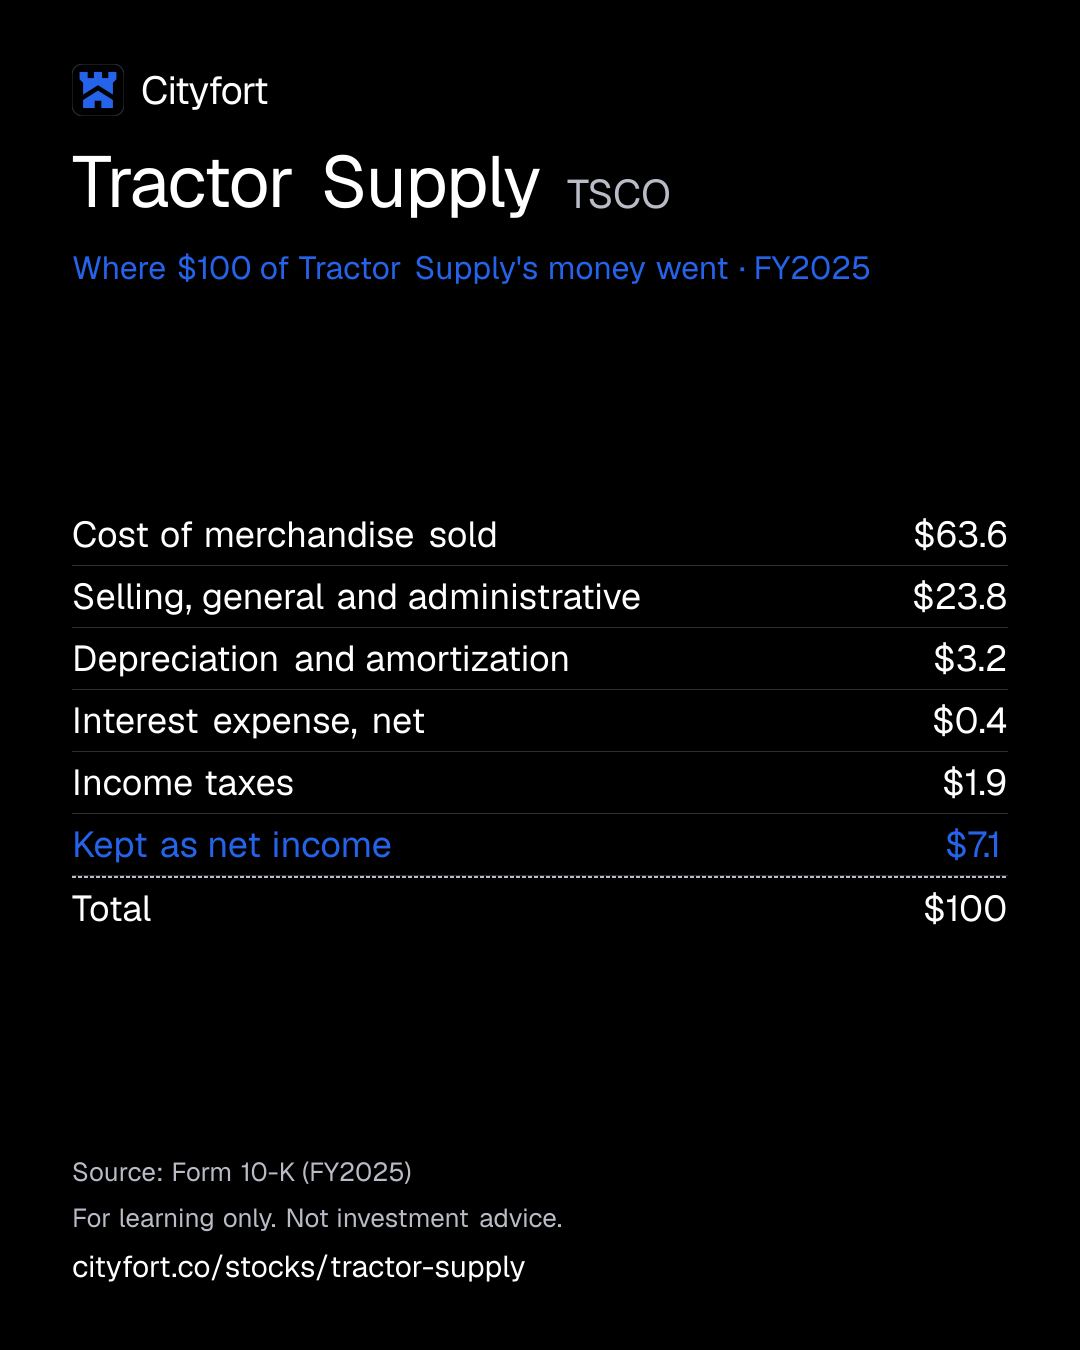
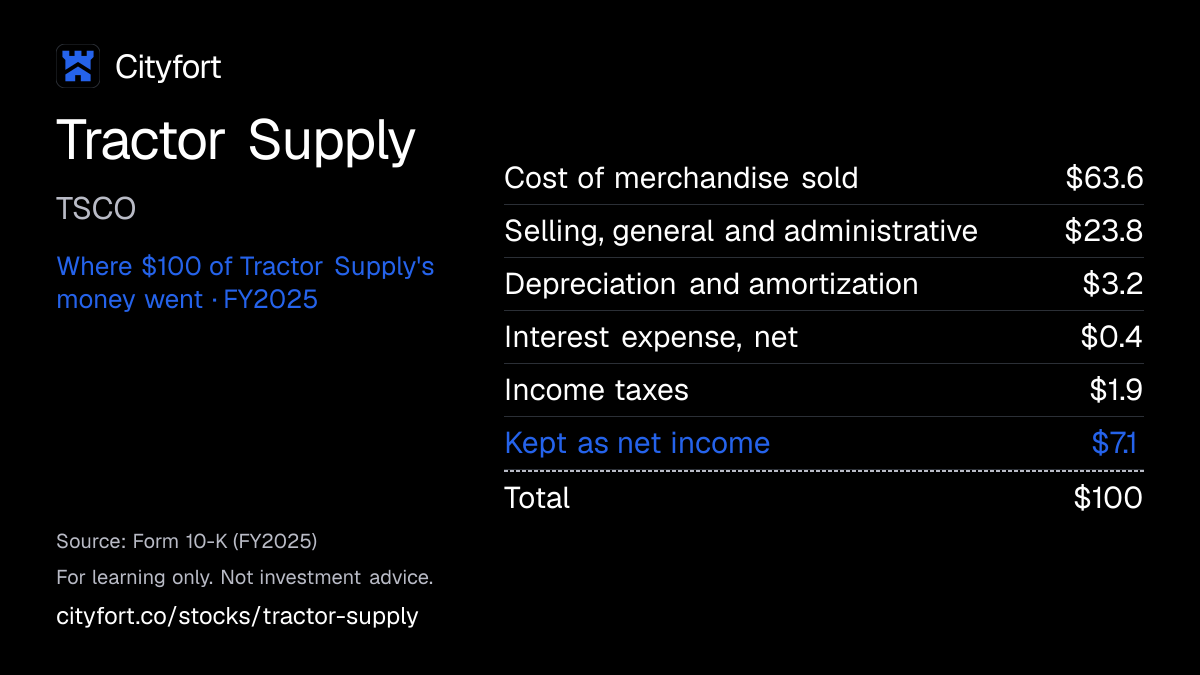
Where does $100 of Tractor Supply's money go?
Tractor Supply · FY2025
Receipt for every $100
| Cost of merchandise sold | $63.6 |
|---|---|
| Selling, general and administrative | $23.8 |
| Depreciation and amortization | $3.2 |
| Interest expense, net | $0.4 |
| Income taxes | $1.9 |
| Kept as net income | $7.1 |
| Total | $100 |
Each line = amount ÷ total money in × 100. Lines may not add to exactly $100 because of rounding.
How this is worked out
Cityfort calculation from the FY2025 10-K. Of every $100 of FY2025 net sales: each line = line ÷ $15.52 billion × 100, rounded, so the lines add to $100.0. Tractor Supply reports interest as one net figure, so net sales is the whole of the money in.
Save this receipt as an image
Embed this receipt or the key numbers
Paste this code into a blog or website to show the card you choose, with a link back to this page.
Each week: the next company due to report earnings, explained in 5 points.
No tips. Unsubscribe anytime.
We'll send a confirmation email. See our privacy policy.
02The business in one line
What does Tractor Supply do?
Rural households and pet owners pay Tractor Supply for feed, pet food, tools and garden goods; in FY2025 about $63.6 of every $100 paid for the goods, and $7.1 was left as net income.
- Shoppers come back for things they use up, such as livestock feed and pet food. Livestock, Equine & Agriculture (27%) and Companion Animal (24%) were the two largest categories of FY2025 net sales.
- Stores, staff and advertising took another $23.8 of every $100 in FY2025. Net income was $1.10 billion that year, against $1.09 billion in FY2022.
03Who pays it
Who pays Tractor Supply?
Rural and small-town households
Share of revenue not disclosed
Recreational farmers, ranchers, homesteaders and others living outside big cities, who buy feed, tools, garden goods and clothing.
Pet owners
24%
of revenue
Buyers of pet food, supplies and medicines in Tractor Supply and Petsense stores and on Allivet.com. Companion Animal was 24% of FY2025 net sales.
Loyalty members
Share of revenue not disclosed
Shoppers in the Neighbor's Club points program, who earn discounts or free services on later purchases.
How spread out the customers are
Tractor Supply sells to individual shoppers and names no large customer. No single vendor was more than 10% of FY2025 purchases.
04How it makes money
How does Tractor Supply make money?
Many small repeat purchases across 2,600 stores
Much of what it sells is used up and bought again: feed, pet food, bird seed, propane. Tractor Supply calls these consumable, usable and edible (C.U.E.) products. About 64 cents of each sales dollar pays for the goods, so a small change in gross margin (the share of sales left after paying for the goods) moves profit.
Net income per $100 of net sales
$7.8$7.1
FY2021 to FY2025
- Open stores in towns outside big cities
- Stock feed, pet food and other items customers use up
- Customers come back for refills
- Buy in bulk from about 425 core vendors through 10 distribution centers
- Sell about 30% of goods under its own or exclusive brands
- Spend the cash on new stores, dividends and buybacks
↺ Step 6 feeds back into step 1.
05The numbers · Consolidated · US$
How has Tractor Supply done?
Revenue
$15.5BFY2025
Net sales rose every year from FY2021 to FY2025, from $12.73 billion to $15.52 billion.
* FY2021: EPS ÷5 for Dec 2024 split.
US$
See the numbers
Net income
$1.1BFY2025
Net income stayed between $1.09 billion and $1.11 billion each year from FY2022 to FY2025; FY2021 EPS is the filed $8.61 divided by 5 for the December 2024 five-for-one split (Cityfort calculation from the FY2021 10-K and FY2025 10-K).
* FY2021: EPS ÷5 for Dec 2024 split.
US$
See the numbers
Net income for every $100 of revenue
$7.1FY2025
Net income per $100 of net sales fell from about $7.8 in FY2021 to about $7.1 in FY2025.
* FY2021: EPS ÷5 for Dec 2024 split.
Net margin: $ of net income per $100 of revenue
See the numbers
Free cash flow
$741MFY2025
Free cash flow (operating cash minus capital spending) rose from $510 million in FY2021 to $741 million in FY2025.
* FY2021: EPS ÷5 for Dec 2024 split.
US$ · cash from operations minus spending on plants and equipment
See the numbers
See all yearly numbers
EBITDA here = operating income plus depreciation and amortization (from the cash flow statement). Fiscal years are the company's own: 52- or 53-week fiscal year ending on the last Saturday of December (FY2025 ended Dec 27, 2025; FY2026 ends Dec 26, 2026). Net income is the share belonging to the company's owners.
Learn: Stock-based compensation and dilution: pay that becomes shares
Sources (16)
- Form 10-K for FY2021
- Annual report on Form 10-K for fiscal 2025 (year ended Dec 27, 2025)
- Form 10-K for FY2022
- Annual report on Form 10-K for fiscal 2024 (year ended Dec 28, 2024)
- Form 10-K for FY2023
- Form 10-Q for Q1 FY2024
- Form 10-Q for Q1 FY2025
- Form 10-Q for Q2 FY2024
- Form 10-Q for Q2 FY2025
- Form 10-Q for Q3 FY2024
- Form 10-Q for Q3 FY2025
- Q4 FY2024 earnings release (8-K Ex. 99.1)
- Q4 FY2025 earnings release (8-K Ex. 99.1)
- Quarterly report 10-Q, Q1 FY2026 (quarter ended Mar 28, 2026)
- Quarterly report 10-Q, Q2 FY2026 (quarter ended Jun 27, 2026)
- Quarterly report 10-Q, Q3 FY2026 (quarter ended Sep 26, 2026)
06Who runs it
Who runs Tractor Supply, and did they deliver?
Harry A. (Hal) Lawton III
President and Chief Executive Officer · since 2020
Earlier President of Macy's, and before that at eBay and Home Depot.
Kurt D. Barton
EVP, Chief Financial Officer and Treasurer · since 2017
CFO since March 2017; executive vice president since February 2019.
Edna K. Morris
Independent Chair of the Board · since 2023
The chair and CEO roles are separate.
J. Seth Estep
EVP, Chief Merchandising Officer
Took on Allivet and VIP Petcare in August 2026.
John P. Ordus
EVP, Chief Stores Officer
Took on Petsense in August 2026, after Robert D. Mills resigned effective Aug 7, 2026.
What they said, and what happened
1 withdrawn · 2 too early to tell
Said on Jan 29, 2026
Tractor Supply guided on Jan 29, 2026 to FY2026 net sales up 4% to 6%, comparable store sales up 1% to 3%, an operating margin of 9.3% to 9.6% and diluted EPS of $2.13 to $2.23.
WithdrawnWhat happened
On Jul 23, 2026 it replaced these with lower ranges: net sales up 2.5% to 3.5%, comparable store sales down 1% to flat and diluted EPS of $1.78 to $1.88. CEO Hal Lawton said "we are not satisfied with our performance".
Said on Jan 29, 2026
Tractor Supply said on Jan 29, 2026 it planned to open about 100 new Tractor Supply stores in FY2026.
Too early to tellWhat happened
It opened 91 in the first nine months of FY2026.
Said on Oct 22, 2026
Tractor Supply said on Oct 22, 2026 it reaffirmed its Jul 23, 2026 FY2026 outlook, including diluted EPS of $1.78 to $1.88.
Too early to tellWhat happened
Diluted EPS was $1.43 in the first nine months of FY2026. The full year ends Dec 26, 2026.
Sources (6)
07What could go wrong
What could go wrong for Tractor Supply?
- Demand
Flat sales at existing stores
Comparable store sales fell 0.3% in the first nine months of FY2026, after a 1.2% rise in FY2025. The 10-K names consumer spending and economic conditions as risks.
Watch Comparable store sales and transaction counts in each quarterly release.
- Pricing
Lower margins
Q3 FY2026 gross margin fell to 36.4% from 37.4%. The company named higher transportation and fuel costs and spending on lower prices for customers.
Watch Gross margin and operating margin, against the FY2026 operating margin of 8.0% to 8.3% that the company said on Oct 22, 2026 it expects.
- Demand
Weather and seasons
Sales and profit are highest in the second and fourth quarters. The 10-K says warm winters, cool springs and storms have shifted or cut sales.
Watch Seasonal category sales and management comments on weather in each release.
- Execution
Pet business changes
It closed 74 Petsense stores and booked $71.7 million of impairment (write-downs of asset values) and restructuring charges in nine months, while adding VIP Petcare in May 2026.
Watch Further impairments, and companion animal sales against the company average.
- Raw-material prices
Imports, tariffs and commodity costs
It imports goods mainly from Asia and Central America, including China. The 10-K lists tariffs and the prices of grain, corn, steel, petroleum and cotton as risks.
Watch Import share of sales and gross margin commentary on tariffs and freight.
- Debt
Higher borrowings
Borrowings rose to $2.25 billion on Sep 26, 2026 from $1.78 billion on Dec 27, 2025, after a $500 million note issue. The 10-K lists a credit rating cut as a risk.
Watch Borrowings in each 10-Q and any rating action by Moody's or S&P.
- Competition
Many kinds of competitors
The 10-K says it competes with general merchandise, home center, pet, discount and online retailers and with regional farm stores.
Watch Comparable store transaction counts, a sign of customer visits.
Sources (5)
08Supporters vs. critics
What do supporters and critics point to?
What supporters point to
- Net sales rose every year from FY2021 to FY2025, from $12.73 billion to $15.52 billion.
- Tractor Supply opened 99 Tractor Supply stores in FY2025 and 91 in the first nine months of FY2026.
- Own and exclusive brands were 30.4% of Q3 FY2026 sales, up from 29.5% a year earlier on the same definition.
- Free cash flow rose from $510 million in FY2021 to $741 million in FY2025.
- FY2025 operating income was 21.2 times net interest expense (Cityfort calculation from the FY2025 10-K).
What critics point to
- Comparable store sales fell 0.3% in the first nine months of FY2026, and on Jul 23, 2026 the company replaced its FY2026 outlook with lower ranges.
- Net income per $100 of net sales fell from $7.83 in FY2021 to $7.06 in FY2025.
- Q3 FY2026 gross margin fell to 36.4% from 37.4% a year earlier.
- Tractor Supply closed 74 Petsense stores and booked $71.7 million of impairment and restructuring charges in the first nine months of FY2026.
- Borrowings rose to $2.25 billion on Sep 26, 2026 from $1.78 billion on Dec 27, 2025, after a $500 million note issue.
09What to watch next
What should you watch next at Tractor Supply?
Next event
Q4 FY2026 results
Date not announced yet.
Sales at existing stores
Comparable store sales fell 0.3% in the first nine months of FY2026. On Oct 22, 2026 Tractor Supply said it expects FY2026 comparable store sales between a fall of 1% and flat.
Margins
Q3 FY2026 gross margin was 36.4%, against 37.4% a year earlier. The company said on Oct 22, 2026 it expects an FY2026 operating margin of 8.0% to 8.3%.
The pet business
Tractor Supply closed 74 Petsense stores and added VIP Petcare in May 2026. Watch for further impairments and how companion animal sales compare with the company average.
Borrowings
Borrowings were $2.25 billion on Sep 26, 2026, up from $1.78 billion on Dec 27, 2025. The 10-K lists a credit rating cut as a risk.
10Key dates
What are the key dates for Tractor Supply?
| Event | Date | Source |
|---|---|---|
| Dividend record date$0.24 a share for holders of record on this date. | 8-K Item 8.01: quarterly dividend declaration $0.24 | |
| Dividend payment$0.24 a share declared on Nov 5, 2026. | 8-K Item 8.01: quarterly dividend declaration $0.24 | |
| Fiscal 2026 endsTractor Supply's fiscal year ends on the last Saturday of December. | Definitive proxy statement DEF 14A, 2026 annual meeting |
11Key facts
Key facts about Tractor Supply
- What does Tractor Supply do?
- Tractor Supply Company runs farm-and-home stores in small towns and rural areas of the US. It sells livestock feed, pet food, tools, lawn and garden supplies and clothing, and had 2,621 stores on Sep 26, 2026.
- How does Tractor Supply make money?
- Tractor Supply makes money by selling goods for more than they cost. In FY2025, of every $100 of net sales, $63.6 paid for the goods sold and $7.1 was left as net income (Cityfort calculation from the FY2025 10-K).
- Who are Tractor Supply's customers?
- Tractor Supply sells to individual shoppers, including recreational farmers, ranchers, homesteaders and pet owners, and names no large customer. Companion Animal products were 24% of Tractor Supply's FY2025 net sales.
- How big is Tractor Supply?
- Tractor Supply had net sales of $15.52 billion and net income of $1.10 billion in FY2025, the year to Dec 27, 2025. It had more than 54,000 team members in October 2026.
- Who owns Tractor Supply?
- Tractor Supply has one class of common stock, with 518.6 million shares outstanding on Oct 24, 2026. Its 2026 proxy lists The Vanguard Group with 12.2% and BlackRock with 9.2%, and directors and executive officers as a group with less than 1%.
- How much does Tractor Supply borrow?
- Tractor Supply had $2.25 billion of borrowings and $198.9 million of cash on Sep 26, 2026, plus $4.43 billion of operating lease liabilities for its mostly leased stores.
- Does Tractor Supply pay a dividend?
- Tractor Supply paid dividends of $0.92 a share in FY2025, up from $0.88 in FY2024, adjusted for the December 2024 5-for-1 split. On Nov 5, 2026 its board declared $0.24 a share, payable Dec 8, 2026.
Sources (5)
Terms on this page
- Capital expenditures (capex)
- Debt-to-equity
- Dividend payout ratio
- Earnings per share (EPS)
- EBITDA
- Free cash flow
- Interest coverage
- Net debt
- Net margin
- Revenue vs net income
Each explains the term in plain English, with the same number from other companies on Cityfort.
Go deeper
More detail from the same filings. Open any section.
12What it sells
12What it sells
What does Tractor Supply sell?
Livestock, Equine & Agriculture
Feed, bedding and other supplies for farm animals and horses: 27% of FY2025 net sales, the largest category.
Companion Animal
Pet food and supplies for dogs, cats and other pets: 24% of FY2025 net sales.
Seasonal & Recreation
Lawn and garden goods such as fertilizer, mulch and weed control, plus other seasonal items: 24% of FY2025 net sales.
Truck, Tool & Hardware
Tools, hardware and truck supplies: 15% of FY2025 net sales.
Clothing, Gift & Decor
Clothing, gifts and home decor: 10% of FY2025 net sales.
Pet pharmacy and vet care
Allivet, an online pet pharmacy bought on Dec 30, 2024, and VIP Petcare, mobile vet clinics bought on May 28, 2026.
What it does
- Does: Sells products that customers use up and buy again, such as livestock feed, pet food, bird seed and propane.
- Does: Sells online at TractorSupply.com, Petsense.com and Allivet.com and through its mobile app.
- Does: Sells its own brands, such as 4health, Producer's Pride and Huskee, beside national brands.
What it does not do
- Does not: Does not list tractors as a product category: its five categories are the ones shown here.
- Does not: Does not operate outside the US: its 2,602 stores on Dec 27, 2025 were in 49 states.
- Does not: Does not make its own-brand goods: outside vendors manufacture them.
13How the money flows
13How the money flows · FY2025
How does money flow through Tractor Supply?
Money in
- Net sales$15.5B
The company
Tractor Supply
$15.5B came in
Money out
- Cost of merchandise sold$9.9B
- Selling, general and administrative (stores, staff, ads)$3.7B
- Depreciation and amortization$494M
- Interest expense, net$69.1M
- Income taxes$302M
- Net income$1.1B
- Shoppers paid Tractor Supply $15.52 billion of net sales in FY2025.
- The goods it sold cost $9.87 billion, leaving $5.65 billion of gross profit.
- Stores, staff, advertising and other running costs took $3.69 billion.
- Wear and tear on stores and equipment took $494 million, leaving $1.47 billion of operating income.
- After $69 million of net interest and $302 million of tax, $1.10 billion was net income.
14What it needs to run
14What it needs to run
What does Tractor Supply need to run?
Leased stores
About 97% of stores are leased. Operating lease liabilities were $4.43 billion on Sep 26, 2026, more than its $2.25 billion of borrowings.
Distribution centers
It owns 10 distribution centers and is building another in Nampa, Idaho. About 81% of Tractor Supply store merchandise went through them in FY2025.
Vendors
It buys from more than 1,100 vendors. About 425 core vendors supplied 90% of FY2025 merchandise purchases.
Imported goods
Imports were 10.4% of Q3 FY2026 sales, sourced mainly from Asia and Central America, which exposes it to tariffs.
Team members
More than 54,000 people worked for it in October 2026. None were covered by collective bargaining agreements at the FY2025 year end.
15Where growth could come from
15Where growth could come from
Where could Tractor Supply's growth come from?
Tractor Supply said on Oct 22, 2026 that it reaffirmed the FY2026 outlook it set on Jul 23, 2026: net sales up 2.5% to 3.5%, comparable store sales down 1% to flat, operating margin of 8.0% to 8.3%, net income of $930 million to $990 million and diluted EPS (earnings per share) of $1.78 to $1.88. Its adjusted (non-GAAPThe company's own "adjusted" numbers, not the official (GAAP) ones. Always read them next to the official figure. Learn more) EPS outlook was $1.90 to $2.00, excluding the Petsense impairment and VIP Petcare acquisition costs.
New Tractor Supply stores
Working91 opened, first nine months of FY2026
It opened 99 Tractor Supply stores in FY2025. Management said on Jan 29, 2026 it planned about 100 in FY2026.
Status: Working, on track against what the company said.
Pet business: Petsense, Allivet and VIP Petcare
Mixed74 Petsense stores closed, Q3 FY2026
It bought VIP Petcare in May 2026 and closed 74 Petsense stores, with $71.7 million of impairment and restructuring charges in nine months. CEO Hal Lawton said on Apr 21, 2026 that companion animal sales trailed the company average.
Status: Mixed, partly on track.
Own and exclusive brands
Working30.4% of sales, Q3 FY2026
The share was 29.5% a year earlier on the same definition, which since FY2025 includes exclusively licensed product lines.
Status: Working, on track against what the company said.
Digital sales
WorkingDouble-digit growth, Q3 FY2026
The Q3 FY2026 release said digital sales grew at a double-digit rate. It gives no dollar figure for them.
Status: Working, on track against what the company said.
Comparable store sales
Behind-0.3%, first nine months of FY2026
Management guided on Jan 29, 2026 to growth of 1% to 3% for FY2026. On Jul 23, 2026 it cut the range to a fall of 1% to flat.
Status: Behind, behind the company's own plan.
Status compares progress with what the company itself said it would do: Working = on track against what the company said; Mixed = partly on track; Behind = behind the company's own plan; New = recently announced; Early = too early to judge.
Sources (6)
16The company's own measures (non-GAAP)
16The company's own measures · FY2025 and Q3 FY2026
What do Tractor Supply's own measures show?
Official (GAAP): Net sales growth, FY2025
4.3%
Company's own measure: Comparable store sales growth, FY2025
1.2%
Sales at stores open at least one year, plus all online sales, compared with a year earlier, as Tractor Supply defines it. Net sales growth also includes new stores and Allivet.
Official (GAAP): Net sales growth, Q3 FY2026
5.1%
Company's own measure: Comparable store sales growth, Q3 FY2026
0.4%
Same definition. Average ticket rose 0.7% and the number of transactions fell 0.3%.
Official (GAAP): Operating income, first nine months of FY2026
$1.0B
Company's own measure: Adjusted operating income, first nine months of FY2026
$1.1B
Leaves out $81.2 million: Petsense inventory, goodwill and other impairment and restructuring charges, and VIP Petcare acquisition costs.
Official (GAAP): Diluted EPS, first nine months of FY2026
$1.4M
Company's own measure: Adjusted diluted EPS, first nine months of FY2026
1.6 $ per share
Same adjustments as adjusted operating income, after tax.
Official (GAAP): Net sales, FY2025
15,524.0%
Company's own measure: Owned Brands and Exclusive Product Categories, share of sales, FY2025
30.0%
Sales of its own brands and exclusively licensed product lines as a share of total sales. The definition widened in FY2025 and earlier years were recast.
These are the company's own measures, defined by the company. They are not comparable across companies, and they are not added together. Each sits beside the nearest official (GAAP) figure.
Learn: Non-GAAP measures: what a company's "adjusted" numbers leave out
17Financial strength and debt
17Financial strength · Sep 26, 2026
How much debt does Tractor Supply have?
- Total debt$2.3B
- Cash and investments$199M
- Net debt (debt minus cash)$2.1B
- Net worth (shareholders' money)$2.7B
- Debt to equity
- 0.85×
- $ of debt for every $1 of shareholders' money
- Interest cover
- 21.2×
- how many times operating profit covers interest
- Net debt of $2.05 billion is borrowings of $2.25 billion minus $198.9 million of cash (Cityfort calculation from the Q3 FY2026 10-Q). Leases are not included.
- Borrowings: $750 million of 5.25% notes due 2033, $650 million of 1.75% notes due 2030, $500 million of 5.20% notes issued in August 2026, $150 million of 3.70% notes due 2029 and $200 million drawn on a $1.30 billion revolving credit line.
- Interest coverage of 21.2 is FY2025 operating income of $1.47 billion ÷ net interest expense of $69.1 million (Cityfort calculation from the FY2025 10-K).
- Debt to equity of 0.85 is borrowings ÷ stockholders' equity of $2.66 billion on Sep 26, 2026 (Cityfort calculation from the Q3 FY2026 10-Q).
- Borrowings as years of operating cash flow: $2.25 billion ÷ FY2025 operating cash flow of $1.64 billion (Cityfort calculation from the Q3 FY2026 10-Q and the FY2025 10-K).
18Who owns it
18Who owns it · ownership as of Mar 16, 2026
Who owns Tractor Supply?
- Officers and directors (as a group), shares
- 0.6%
Share classes
Holders of 5% or more
From the company's proxy statement (DEF 14A), later Schedule 13G filings and the share counts on its latest annual or quarterly report. Each holder row shows the date of its own filing.
Learn: How to read a proxy statement (DEF 14A): Nvidia's 2026 proxy · Form 4 insider filings: who files, the codes and the footnotes
19What it does with profit
19What it does with profit
What does Tractor Supply do with its profit?
Dividend per share
$0.92FY2025
Dividend paid for each share, by financial year.
$ per share
See the numbers
Buyback · Dec 30, 2023
FY2023: bought back 13.7 million shares (split-adjusted) for $602.9 million, including the 1% excise tax.
$603M
Buyback · Dec 28, 2024
FY2024: bought back 10.6 million shares for $566.4 million, including excise tax.
$566M
Buyback · Dec 27, 2025
FY2025: bought back 6.6 million shares for $361.0 million, including excise tax.
$361M
Buyback · Sep 26, 2026
First nine months of FY2026: bought back about 8.9 million shares for $341.8 million, excluding excise tax.
$342M
20Governance signals
20Governance signals
What do Tractor Supply's governance filings show?
- Auditor
- Ernst & Young LLP, since 2001
- Auditor changes
- None in the period covered
- Audit qualifications
- None reported
- Related-party dealings
- The 2026 proxy says the company is not aware of any related-person transactions since the start of FY2025 that require disclosure under SEC rules.
- Credit rating
- Moody's and S&P Global Ratings (as stated in the FY2025 10-K) Baa1 (Moody's) / BBB (S&P) (outlook Stable), Feb 19, 2026
A credit rating describes the company's ability to repay debt. It is not a rating of the share.
21How it got here
21How it got here
How did Tractor Supply get here?
1938
Milestone
Founded
Tractor Supply was founded in 1938 and now has its head office in Brentwood, Tennessee.
2020
Milestone
Hal Lawton becomes CEO
The former Macy's president became President and CEO in January 2020.
2023
Milestone
Orscheln stores converted
FY2023 capital spending included converting stores from the Orscheln acquisition, according to the FY2024 10-K.
2024
Milestone
5-for-1 stock split
Each share became five in December 2024; per-share figures on this page are adjusted for it.
2024
Business-model change
Bought Allivet
It bought the online pet pharmacy Allivet on Dec 30, 2024 for $135.0 million in cash.
2026
Business-model change
Bought VIP Petcare
On May 28, 2026 it bought VIP Petcare, a mobile vet clinic business, for $133.8 million before adjustments.
2026
Crisis
Closed 74 Petsense stores
After a review, it closed 74 Petsense stores in Q3 FY2026, leaving 135.
Sources (5)
22Sources and changes
Where every number on this page comes from
Sources (23 documents)
- S1Annual report on Form 10-K for fiscal 2025 (year ended Dec 27, 2025) · Tractor Supply Company / SEC EDGAR · Tier 1: company or exchange filing · Feb 19, 2026
- S2Annual report on Form 10-K for fiscal 2024 (year ended Dec 28, 2024) · Tractor Supply Company / SEC EDGAR · Tier 1: company or exchange filing · Feb 20, 2025
- S3Quarterly report 10-Q, Q3 FY2026 (quarter ended Sep 26, 2026) · Tractor Supply Company / SEC EDGAR · Tier 1: company or exchange filing · Nov 5, 2026
- S4Quarterly report 10-Q, Q2 FY2026 (quarter ended Jun 27, 2026) · Tractor Supply Company / SEC EDGAR · Tier 1: company or exchange filing · Aug 6, 2026
- S5Quarterly report 10-Q, Q1 FY2026 (quarter ended Mar 28, 2026) · Tractor Supply Company / SEC EDGAR · Tier 1: company or exchange filing · May 7, 2026
- S6Definitive proxy statement DEF 14A, 2026 annual meeting · Tractor Supply Company / SEC EDGAR · Tier 1: company or exchange filing · Mar 26, 2026
- S7Q3 FY2026 earnings release (8-K Ex. 99.1) · Tractor Supply Company / SEC EDGAR · Tier 1: company or exchange filing · Oct 22, 2026
- S8Q2 FY2026 earnings release (8-K Ex. 99.1) · Tractor Supply Company / SEC EDGAR · Tier 1: company or exchange filing · Jul 23, 2026
- S9Q1 FY2026 earnings release (8-K Ex. 99.1) · Tractor Supply Company / SEC EDGAR · Tier 1: company or exchange filing · Apr 21, 2026
- S10Q4 FY2025 earnings release (8-K Ex. 99.1) · Tractor Supply Company / SEC EDGAR · Tier 1: company or exchange filing · Jan 29, 2026
- S14Q4 FY2024 earnings release (8-K Ex. 99.1) · Tractor Supply Company / SEC EDGAR · Tier 1: company or exchange filing · Jan 30, 2025
- S158-K Item 1.01/2.03: Third Supplemental Indenture, 5.20% Senior Notes (Ex. 4.2) · Tractor Supply Company / SEC EDGAR · Tier 1: company or exchange filing · Aug 25, 2026
- S168-K Item 8.01: quarterly dividend declaration $0.24 · Tractor Supply Company / SEC EDGAR · Tier 1: company or exchange filing · Nov 5, 2026
- S178-K Item 5.02: officer matter · Tractor Supply Company / SEC EDGAR · Tier 1: company or exchange filing · Aug 7, 2026
- S19Form 10-Q for Q3 FY2025 · Tractor Supply Company / SEC EDGAR · Tier 1: company or exchange filing · Nov 6, 2025
- S20Form 10-Q for Q2 FY2025 · Tractor Supply Company / SEC EDGAR · Tier 1: company or exchange filing · Aug 7, 2025
- S21Form 10-Q for Q1 FY2025 · Tractor Supply Company / SEC EDGAR · Tier 1: company or exchange filing · May 8, 2025
- S22Form 10-Q for Q3 FY2024 · Tractor Supply Company / SEC EDGAR · Tier 1: company or exchange filing · Nov 7, 2024
- S23Form 10-Q for Q2 FY2024 · Tractor Supply Company / SEC EDGAR · Tier 1: company or exchange filing · Aug 8, 2024
- S24Form 10-Q for Q1 FY2024 · Tractor Supply Company / SEC EDGAR · Tier 1: company or exchange filing · May 9, 2024
- S25Form 10-K for FY2023 · Tractor Supply Company / SEC EDGAR · Tier 1: company or exchange filing · Feb 23, 2024
- S26Form 10-K for FY2022 · Tractor Supply Company / SEC EDGAR · Tier 1: company or exchange filing · Feb 23, 2023
- S27Form 10-K for FY2021 · Tractor Supply Company / SEC EDGAR · Tier 1: company or exchange filing · Feb 17, 2022
Changes to this page (v1 · Nov 20, 2026)
- v1 · Nov 20, 2026First version. (first version)
Numbers come only from tier 1 and tier 2 sources. Read how we research.
Disclaimer
For learning only. Cityfort is not a registered investment adviser or broker-dealer and does not recommend buying or selling any security. Prices shown are dated and may be out of date.
Investing in securities involves risk, including loss of capital. Before making any investment decision, do your own research and consider consulting a registered investment adviser or other qualified professional.
Cityfort, its owners and contributors may or may not hold securities of companies covered. Cityfort is not paid by any company it covers. Content is not an offer or solicitation to buy or sell any security, including in any initial public offering.
Read the positions policyRead the full disclaimerHide the full disclaimer
Cityfort publishes general educational content that explains how listed companies work. Cityfort is not registered with the US Securities and Exchange Commission or any state securities regulator as an investment adviser, and is not a broker-dealer or a member of FINRA. Cityfort does not provide investment, tax or legal advice, recommendations, ratings, price targets or any opinion on whether to buy, sell or hold any security. Nothing on the site is tailored to any person's circumstances.
All information is taken from publicly available sources, mainly company filings with the SEC, which are listed on each page with dates. We work to keep it accurate and correct errors publicly, but we do not guarantee that it is complete, accurate or up to date. Any market price or price-based ratio shown is dated, may be out of date by the time you read it, and is included only to explain concepts.
Statements by company management, including forward-looking statements and guidance, are reported as the company's statements, with their date and source; they are not our forecasts. Adjusted (non-GAAP) figures are the company's own measures and are shown next to the official (GAAP) figures.