Industrials · NYSE: OTIS
Otis: how the business works
Otis makes and installs elevators and escalators, but servicing machines already in buildings brought in 65.4% of its $14.4 billion of FY2025 net sales.
By Hardik Bhandare · Checked against filings: . Editorial policy. Corrections
Follow Otis
Email me when Otis's page is updated after earnings.
We'll send a confirmation email first. See our privacy policy.
Otis Worldwide Corporation · Farmington, Connecticut
Updated for Q3 FY2026 · checked
- Net sales, FY2025
- $14.4B
- Net income, FY2025
- $1.38B
- Service share of net sales, FY2025
- 65.4%
- Units maintained, end of 2025
- About 2.5 million
- Employees, Dec 31, 2025
- About 72,000
The short version
Otis in 5 points
1 · What it sells
Otis makes, installs and services elevators, escalators and moving walkways, with net sales of $14,431 million in FY2025.
2 · Who pays it
In FY2025, building owners and managers paying for maintenance, repair and modernization made up 65.4% of Otis's net sales, and buyers of new equipment 34.6%.
3 · What it keeps from $100
Of every $100 of net sales in FY2025, Otis kept $9.59 as net income and $14.78 as operating profit, both after $76 million of UpLift restructuring costs.
4 · Where the operating profit comes from
Service earned $2,374 million of FY2025 segment operating profit and New Equipment $240 million, before $481 million of corporate and unallocated items.
5 · The one thing to watch
Otis's sales in China fell to $1,650 million in FY2025 from $2,877 million in FY2021, and China new-equipment sales fell more than 20% organically in Q3 FY2026.
Sources: From Otis's FY2025 and FY2022 10-Ks and the Q3 FY2026 10-Q · checked
01Where the money goes · FY2025
Where does $100 of Otis' money go?
Otis · FY2025
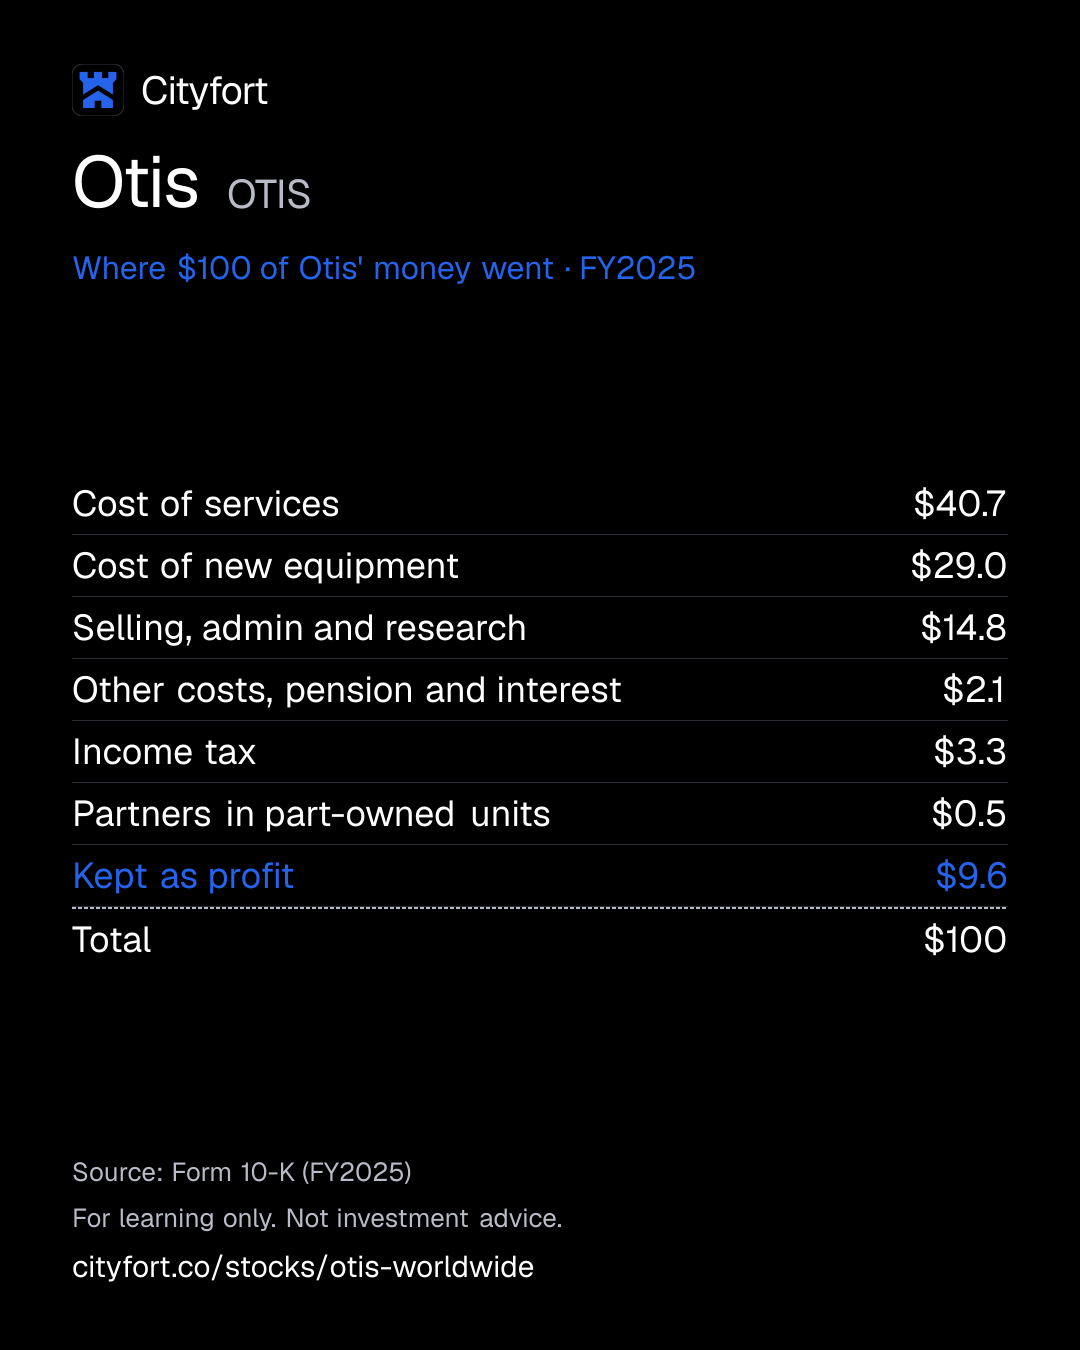
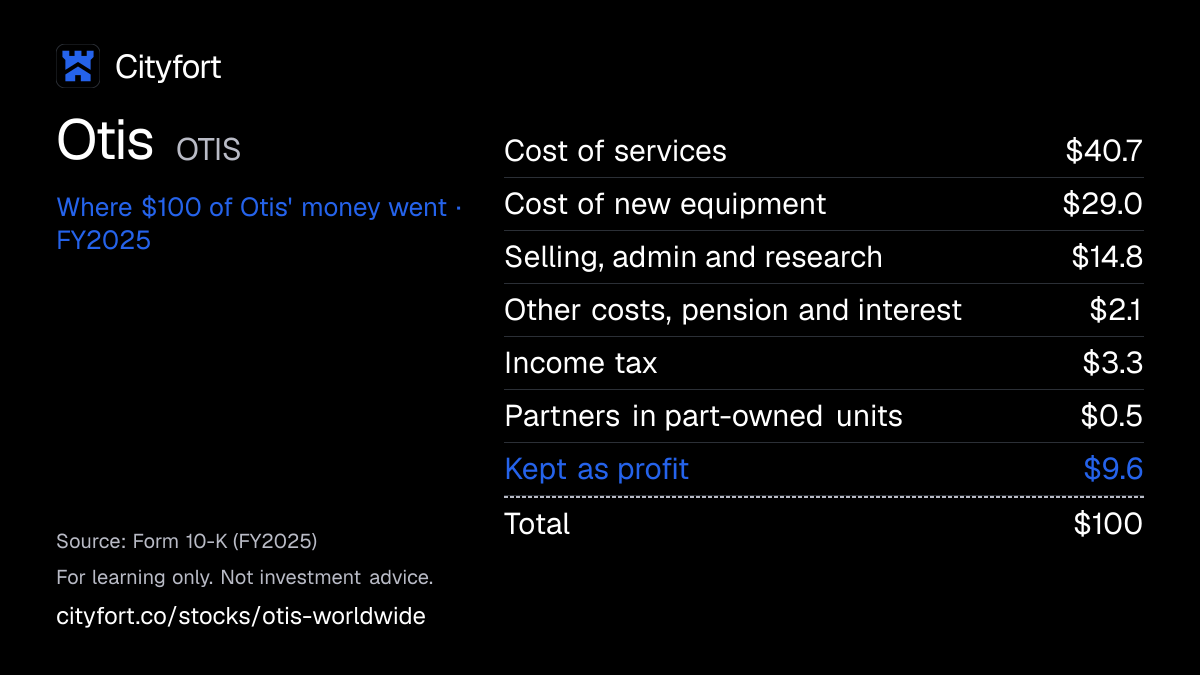
Receipt for every $100
| Cost of services | $40.7 |
|---|---|
| Cost of new equipment | $29.0 |
| Selling, admin and research | $14.8 |
| Other costs, pension and interest | $2.1 |
| Income tax | $3.3 |
| Partners in part-owned units | $0.5 |
| Kept as profit | $9.6 |
| Total | $100 |
Each line = amount ÷ total money in × 100. Lines may not add to exactly $100 because of rounding.
How this is worked out
Cityfort calculation from the FY2025 10-K: each line is its FY2025 amount ÷ $14,431 million of net sales × 100. Other income was a net expense of $106 million, so it sits with costs. Operating profit was $2,133 million, or $14.78 of each $100.
Save this receipt as an image
Embed this receipt or the key numbers
Paste this code into a blog or website to show the card you choose, with a link back to this page.
Each week: the next company due to report earnings, explained in 5 points.
No tips. Unsubscribe anytime.
We'll send a confirmation email. See our privacy policy.
02The business in one line
What does Otis do?
Building owners pay Otis to maintain, repair and modernize their elevators and escalators, and developers buy new ones. Of every $100 of FY2025 net sales, $14.78 was operating profit and $9.59 was left as net income.
- Service work brought in $9,442 million, or 65.4% of FY2025 net sales, and New Equipment $4,989 million. No customer reached 10% of net sales from 2021 to 2025.
- Service earned $2,374 million of FY2025 segment operating profit, against $240 million for New Equipment, before $481 million of corporate and unallocated items.
03Who pays it
Who pays Otis?
Building owners and managers
65.4%
of revenue
Building owners, facility managers, housing associations and government agencies pay for maintenance, repair and modernization (the Service segment).
Developers and contractors
34.6%
of revenue
Real estate developers and general contractors buy new elevators and escalators for homes, offices, shops and mixed-use buildings (the New Equipment segment).
Governments for infrastructure
Share of revenue not disclosed
Government agencies also buy new equipment for airports, railways and metros. Otis does not give this group a separate revenue share.
- Building owners and managers65.4%
- Developers and contractors34.6%
How spread out the customers are
No customer reached 10% of net sales in any year from 2021 to 2025. In China and some other places, agents and distributors help sell new equipment.
04How it makes money
How does Otis make money?
New elevators open the door; servicing them earns most of the profit.
In FY2025, Service brought in 65% of Otis's sales but 91% of its segment operating profit. Service kept $25.10 of segment profit per $100 of sales; New Equipment kept $4.80. Faster Service portfolio growth is one of the five strategy goals in the FY2025 10-K.
Service segment profit per $100 of Service sales
$24.0$25.1
FY2023 to FY2025
- Otis sells and installs a new elevator or escalator
- The owner can then pay Otis to maintain it
- Each unit joins a portfolio of about 2.5 million maintained units
- Maintenance and repairs bring in fees year after year
- Older units come back as modernization projects
- About 1.1 million units connect to Otis ONE for service data
↺ Step 6 feeds back into step 1.
Sources (1)
05Business segments · FY2025
Which businesses make up Otis?
Service
65.4%Maintenance, repair and modernization of installed elevators and escalators, including some built by other makers.
Revenue $9.4B ($9,442M) · Operating profit $2.4B ($2,374M)
New Equipment
34.6%New elevators, escalators and moving walkways, designed, made and installed by Otis.
Revenue $5.0B ($4,989M) · Operating profit $240M
How the mix changed
- Service
- New Equipment
Revenue by segment, FY2021 to FY2025.
US$
See the numbers
06The numbers · Consolidated · US$
How has Otis done?
Revenue
$14.4BFY2025
Net sales stayed between $13,685 million and $14,431 million a year from FY2021 to FY2025, with FY2025 the highest.
US$
See the numbers
Net income
$1.4BFY2025
Net income rose from $1,246 million in FY2021 to $1,645 million in FY2024, a year that included German tax ruling gains. It fell to $1,384 million in FY2025.
US$
See the numbers
Net income for every $100 of revenue
$9.6FY2025
Otis kept $9.60 of net income per $100 of sales in FY2025, against $11.50 in FY2024 and $8.70 in FY2021.
Net margin: $ of net income per $100 of revenue
See the numbers
Free cash flow
$1.4BFY2025
Free cash flow was $1,444 million in FY2025, close to $1,437 million in FY2024, after $152 million of capital spending.
US$ · cash from operations minus spending on plants and equipment
See the numbers
See all yearly numbers
EBITDA here = operating income plus depreciation and amortization (from the cash flow statement). Fiscal years are the company's own: Fiscal year ends Dec 31. Net income is the share belonging to the company's owners.
Learn: Fiscal years that don't end in December: Nvidia's FY2027 explained · Stock-based compensation and dilution: pay that becomes shares
Sources (20)
- Form 10-K for FY2022
- Form 10-K for FY2023
- Form 10-K for FY2024
- Form 10-K for FY2025
- Otis Worldwide earnings release (8-K Ex. 99.1) 2026-01-28
- Otis Worldwide earnings release (8-K Ex. 99.1) 2025-01-29
- Form 10-Q for Q1 FY2025
- Otis Worldwide earnings release (8-K Ex. 99.1) 2025-04-23
- Form 10-Q for Q2 FY2024
- Otis Worldwide earnings release (8-K Ex. 99.1) 2025-07-23
- Form 10-Q for Q3 FY2024
- Otis Worldwide earnings release (8-K Ex. 99.1) 2025-10-29
- Form 10-Q for Q2 FY2025
- Form 10-Q for Q3 FY2025
- Form 10-Q for Q1 FY2026
- Otis Worldwide earnings release (8-K Ex. 99.1) 2026-04-22
- Form 10-Q for Q2 FY2026
- Otis Worldwide earnings release (8-K Ex. 99.1) 2026-07-22
- Form 10-Q for Q3 FY2026
- Otis Worldwide earnings release (8-K Ex. 99.1) 2026-10-28
07Who runs it
Who runs Otis, and did they deliver?
Judith F. Marks
Chair, President and CEO · since 2022
Chair since Feb 2022. An 8-K filed Sep 15, 2026 says she will retire on the earlier of her successor's start (expected in the first half of 2027) and Jul 31, 2027.
Cristina Mendez
Chief Financial Officer · since 2024
CFO since Aug 2024.
Enrique Minarro Viseras
Chief Operating Officer · since 2026
Appointed COO effective Jan 16, 2026.
John H. Walker
Independent Lead Director · since 2020
Director since April 2020; the board picks an independent Lead Director because the Chair is not independent.
Christopher J. Kearney
Director, chairs the CEO succession committee · since 2020
Director since April 2020. His committee leads the search for the next CEO, with Spencer Stuart retained.
What they said, and what happened
1 delivered · 2 too early to tell
Said on Jan 29, 2025
In its Q4 2024 release, Otis said it expected 2025 adjusted EPS of $4.00 to $4.10 and adjusted free cash flowCash from operations minus spending on buildings and equipment. Learn more of about $1.6 billion.
DeliveredWhat happened
FY2025 adjusted EPS was $4.05 and adjusted free cash flow $1,583 million.
Said on Jan 28, 2026
In its Q4 2025 release, Otis said it expected 2026 adjusted EPS to grow by a mid to high single-digit rate and adjusted free cash flow of $1.6 to $1.7 billion.
Too early to tellWhat happened
The year is not over. On Jul 22, 2026, Otis cut its adjusted EPS range from $4.20–$4.24 to $4.01–$4.05, against $4.05 in FY2025. In October it put adjusted free cash flow at about $1.5 billion.
Said on Apr 22, 2026
In its Q1 2026 release, Otis said it expected 2026 Service organic sales to rise by a mid to high single-digit rate.
Too early to tellWhat happened
Service organic sales rose 7% in the first nine months of 2026; the year is not over.
Sources (9)
- Form 10-K for FY2025
- Otis Worldwide Form 8-K filed 2026-09-15 (Item 8.01/5.02/1.01 event)
- Otis Worldwide Form 8-K filed 2026-01-20 (Item 8.01/5.02/1.01 event)
- Otis Worldwide Form DEF 14A filed 2026-04-17
- Otis Worldwide earnings release (8-K Ex. 99.1) 2025-01-29
- Otis Worldwide earnings release (8-K Ex. 99.1) 2026-01-28
- Otis Worldwide earnings release (8-K Ex. 99.1) 2026-04-22
- Otis Worldwide earnings release (8-K Ex. 99.1) 2026-07-22
- Otis Worldwide earnings release (8-K Ex. 99.1) 2026-10-28
08What could go wrong
What could go wrong for Otis?
- Demand
China new-equipment slump
Sales in China fell from $2,877 million in FY2021 to $1,650 million in FY2025. China new-equipment sales fell more than 20% organically in Q3 FY2026, and the FY2025 10-K lists the China decline as a risk.
Watch China new-equipment orders and sales in each quarterly release.
- Regulation
Tariffs and trade rules
The FY2025 10-K names tariffs and trade policy as a risk. About 71% of FY2025 net sales came from outside the US.
Watch Tariff costs named in the quarterly releases and 10-Qs.
- Debt
Debt with negative equity
Total debt was $8,275 million at Sep 30, 2026 against $866 million of cash, and shareholders' equity was minus $5,430 million. The 10-K lists debt levels and credit ratings among its risks.
Watch Net debt, new bond issues and any rating action.
- Execution
Service margin pressure
Service segment margin was 23.5% in the first nine months of 2026, against 25.0% a year earlier. In April, CEO Judy Marks linked the pressure to cost headwinds and growth investments.
Watch Service segment margin each quarter.
- Execution
Restructuring delivery
UpLift restructuring cost $76 million in FY2025. Otis said approved UpLift actions were expected to save about $103 million a year by the end of 2025; about $84 million was realized in 2025.
Watch Restructuring charges and savings reported in the next 10-K.
- Other
Labor costs
About 37,000 service mechanics do the work, and collective bargaining covers 64% of the US workforce. The 10-K lists labor costs and collective bargaining as a risk.
Watch Labor agreements and the cost of services sold.
- Legal
Spin-off tax treatment
The Q3 FY2026 10-Q names a risk that tax authorities could decide the 2020 Separation from United Technologies should be treated as taxable.
Watch Separation tax matters in the next 10-K.
09Supporters vs. critics
What do supporters and critics point to?
What supporters point to
- Service brought in 65.4% of FY2025 net sales and $2,374 million of segment operating profit, and Otis maintained about 2.5 million units at the end of 2025.
- The 2026 proxy says Otis's maintenance portfolio grew 4% in 2025, the fourth year in a row.
- Modernization sales rose to $1,858 million in FY2025 from $1,398 million in FY2021. Otis said its modernization backlog was 20% higher at the end of Q3 2026 than a year earlier.
- Free cash flow (cash from operations less capital spending) was $1,444 million in FY2025. Otis declared $1.65 a share of dividends and bought back $809 million of stock that year.
What critics point to
- Sales in China fell to $1,650 million in FY2025 from $2,877 million in FY2021, and China new-equipment sales fell more than 20% organically in Q3 FY2026.
- Net sales were $14,431 million in FY2025, close to the $14,298 million of FY2021.
- At Sep 30, 2026, Otis had total debt of $8,275 million against $866 million of cash, and shareholders' equity was minus $5,430 million.
- Service segment margin was 23.5% in the first nine months of 2026, down from 25.0% a year earlier.
- An 8-K filed Sep 15, 2026 says CEO Judith Marks will retire by Jul 31, 2027 at the latest; a board committee is running the search for her successor.
10What to watch next
What should you watch next at Otis?
Next event
Q4 FY2026 results
Jan 27, 2027
Expected, based on last year's date
China new equipment
China new-equipment sales fell more than 20% organically in Q3 FY2026. The Q4 FY2026 release will show the full-year China figure.
Service margin
Service segment margin was 23.5% in the first nine months of 2026, against 25.0% a year earlier. The FY2026 10-K will give the full-year margin.
The 2026 outlook against results
In its Q3 2026 release (Oct 28, 2026), Otis said it expected 2026 net sales of $15.1 to $15.3 billion and adjusted EPS of $4.01 to $4.05. The Q4 FY2026 release will report the actual figures.
CEO succession
An 8-K filed Sep 15, 2026 says Judith Marks will retire on the earlier of her successor's start, expected in the first half of 2027, and Jul 31, 2027.
Debt
Net debt was $7,409 million at Sep 30, 2026, up from $6,860 million at Dec 31, 2025. On Nov 5, 2026, Otis issued $500 million of 5.825% notes due 2036.
11Key facts
Key facts about Otis
- What does Otis do?
- Otis Worldwide makes, installs and services elevators, escalators and moving walkways. Its FY2025 10-K describes it as the world's largest elevator and escalator manufacturing, installation and service company.
- How does Otis make money?
- In FY2025, Otis's Service segment (maintenance, repair and modernization) brought in $9,442 million, or 65.4% of net sales. New Equipment brought in $4,989 million, or 34.6%.
- Who are Otis's customers?
- Otis sells to building owners and managers, housing associations, government agencies, real estate developers and general contractors. No customer reached 10% of Otis's net sales in any year from 2021 to 2025.
- How big is Otis?
- Otis had net sales of $14,431 million and net income of $1,384 million in FY2025, against $14,261 million and $1,645 million in FY2024. It had about 72,000 employees at Dec 31, 2025.
- Who owns Otis?
- Otis has one class of common stock and no controlling holder. Otis's 2026 proxy lists The Vanguard Group with 12.6% and BlackRock with 7.0%, and its directors and executive officers as a group with less than 1%.
Terms on this page
- Capital expenditures (capex)
- Dividend payout ratio
- Earnings per share (EPS)
- EBITDA
- Free cash flow
- Net debt
- Net margin
- Revenue vs net income
- Stock buyback
Each explains the term in plain English, with the same number from other companies on Cityfort.
Go deeper
More detail from the same filings. Open any section.
12What it sells
12What it sells
What does Otis sell?
New elevators and escalators
Passenger and freight elevators, escalators and moving walkways for homes, offices, shops, airports and metros. Platforms include Gen2, Gen3, Gen360 and SkyRise. Sales were $4,989 million in FY2025.
Maintenance and repair
Regular servicing and repairs under contract, including some units built by other makers. Otis maintained about 2.5 million units at the end of 2025. Sales were $7,584 million in FY2025.
Modernization
Upgrading older elevators and escalators with new parts and systems. Sales were $1,858 million in FY2025, up from $1,398 million in FY2021.
Connected service
Otis ONE is its internet-of-things platform, linking about 1.1 million units at the end of 2025. OTISLINE takes service calls 24 hours a day.
Think of it like this
Think of a carmaker that also runs the service garages: each elevator is sold once, but a maintenance contract can pay every year after that.
What it does
- Does: Designs, makes and installs new elevators, escalators and moving walkways
- Does: Maintained about 2.5 million units worldwide at the end of 2025
- Does: Services some equipment built by other companies
- Does: Upgrades older elevators through modernization
What it does not do
- Does not: Is no longer part of RTX (formerly United Technologies), which spun it off in April 2020
- Does not: Does not rely on one big customer: none reached 10% of net sales from 2021 to 2025
- Does not: Does not own its main China business outright: Otis China is a joint venture with Tianjin Tai Kang Investment
Sources (2)
13How the money flows
13How the money flows · FY2025
How does money flow through Otis?
Money in
- Net sales (service and new equipment)$14.4B
The company
Otis
$14.4B came in
Money out
- Cost of services sold$5.9B
- Cost of new equipment sold$4.2B
- Selling, admin and research$2.1B
- Other costs, pension and net interest$305M
- Income tax$479M
- Partners in part-owned units$71M
- Net income for Otis shareholders$1.4B
- Customers paid Otis $14,431 million in FY2025: $9,442 million for service and $4,989 million for new equipment.
- Delivering service cost $5,879 million. Making and installing new equipment cost $4,182 million.
- Selling, administration and research took $2,131 million. Net other expenses of $106 million left an operating profit of $2,133 million.
- Net interest of $196 million, pension cost of $3 million and income tax of $479 million went out.
- Partners in part-owned subsidiaries took $71 million, leaving $1,384 million of net income for Otis shareholders.
Sources (1)
14What it needs to run
14What it needs to run
What does Otis need to run?
Service mechanics
About 37,000 service mechanics among about 72,000 employees at the end of 2025. Collective bargaining covers 64% of the US workforce.
Branches near customers
More than 1,400 branches and offices, with a direct presence in more than 70 countries.
Suppliers
Several thousand suppliers worldwide, including about 400 key suppliers for manufacturing.
Patents and research
About 4,600 patents and 1,300 pending applications at the end of 2025. Research and development cost $152 million in FY2025.
Sources (1)
15Where it sells
15Where it sells · FY2025
Where does Otis sell?
- United States29%
- China11.4%
- Other countries59.5%
Sources (1)
16Competitors and what protects it
16Competitors and what protects it
Who does Otis compete with?
KONE Oyj
Named by Otis as a major global competitor in both new equipment and service.
Schindler Group
Otis lists it among its major global rivals in new equipment and service.
TK Elevator
Also named by Otis as a major global rival in both new equipment and service.
Independent service firms
Otis says these local firms maintain about 50% of service units in total, but a smaller share by value.
What protects the business
Each strength is scored 1 (weak) to 5 (strong) for the business, with the reason. It is not a rating of the share.
- Installed base4 of 5
Otis maintained about 2.5 million units at the end of 2025. The 2026 proxy says the portfolio grew 4% for the fourth year in a row.
- Local reach4 of 5
More than 1,400 branches and offices, a direct presence in over 70 countries and customers in over 200 countries and territories.
- Connected units3 of 5
About 1.1 million units were connected to Otis ONE at the end of 2025, up from about 0.9 million two years earlier.
Weak spot
New equipment in China
Otis's China sales fell from $2,877 million in FY2021 to $1,650 million in FY2025. China new-equipment sales fell more than 20% on an organic basis (leaving out currency moves) in FY2025 and again in Q3 FY2026.
17Where growth could come from
17Where growth could come from
Where could Otis' growth come from?
In its Q3 2026 earnings release, Otis said it expected 2026 net sales of $15.1 to $15.3 billion and adjusted operating profit of about $2.4 billion. It also expected adjusted EPS of $4.01 to $4.05 and adjusted free cash flow of about $1.5 billion.
Modernization
WorkingBacklog +20% (Q3 FY2026)
Modernization sales rose to $1,858 million in FY2025 from $1,398 million in FY2021. Otis said its modernization backlog (orders not yet delivered) was 20% higher at the end of Q3 2026 than a year earlier.
Status: Working, on track against what the company said.
Maintenance portfolio
WorkingAbout 2.5 million units
The 2026 proxy says the portfolio grew 4% in 2025, the fourth year in a row. Maintenance and repair sales rose 4% organically in FY2025 and in Q3 FY2026.
Status: Working, on track against what the company said.
Service margins
Mixed23.5% vs 25.0% (9 months)
Service segment margin was 23.5% in the first nine months of 2026, down from 25.0% a year earlier. CEO Judy Marks said in the Q3 release that investments in field capability and AI-enabled pricing, with disciplined execution and cost control, drove Service margin above 24% in the quarter.
Status: Mixed, partly on track.
New equipment
MixedOrganic sales +3% (Q3 FY2026)
New Equipment organic sales fell 7% in FY2025, then rose 3% in Q3 FY2026. The Americas grew in the low teens while China fell more than 20%.
Status: Mixed, partly on track.
WeMaintain
NewMajority stake, Apr 2026
Otis announced a majority investment in WeMaintain, which it describes as a digitally native, AI-enabled elevator service provider. The terms are not in the documents used here.
Status: New, recently announced.
Status compares progress with what the company itself said it would do: Working = on track against what the company said; Mixed = partly on track; Behind = behind the company's own plan; New = recently announced; Early = too early to judge.
18The company's own measures (non-GAAP)
18The company's own measures · FY2025
What do Otis' own measures show?
Official (GAAP): Diluted EPS, FY2025
$3.50
Company's own measure: Adjusted EPS, FY2025
$4.05
Otis leaves out items such as restructuring costs; the Q4 2025 release reconciles the two.
Official (GAAP): Diluted EPS, FY2024
$4.07
Company's own measure: Adjusted EPS, FY2024
$3.83
Lower than GAAP EPS in FY2024, a year whose GAAP results included German tax litigation benefits.
Official (GAAP): Operating profit, FY2025
$2.1B
Company's own measure: Total segment operating profit, FY2025
$2.6B
Segment profit leaves out $481 million of corporate and unallocated items, including restructuring and Separation-related costs.
Official (GAAP): Cash from operations, FY2025
$1.6B
Company's own measure: Adjusted free cash flow, FY2025
$1.6B
Otis subtracts capital spending and adjusts for other items it lists in the Q4 2025 release. Free cash flow before those adjustments was $1,444 million.
Official (GAAP): Operating profit, Q3 FY2026
$620M
Company's own measure: Adjusted operating profit, Q3 FY2026
$626M
Otis's own measure, reconciled to operating profit in the Q3 2026 release.
Official (GAAP): Diluted EPS, Q3 FY2026
$1.08
Company's own measure: Adjusted EPS, Q3 FY2026
$1.05
Otis's own measure, reconciled to diluted EPS in the Q3 2026 release.
These are the company's own measures, defined by the company. They are not comparable across companies, and they are not added together. Each sits beside the nearest official (GAAP) figure.
Learn: Non-GAAP measures: what a company's "adjusted" numbers leave out
19Financial strength and debt
19Financial strength · Sep 30, 2026
How much debt does Otis have?
- Total debt$8.3B
- Cash and investments$866M
- Net debt (debt minus cash)$7.4B
- Net worth (shareholders' money)−$5.4B
- Net debt of $7,409 million (total debt less cash) is as stated in the Q3 FY2026 10-Q. It was $6,860 million at Dec 31, 2025.
- Total debt is the company's own figure: short-term borrowings plus current and long-term debt. It leaves out $419 million of long-term operating lease liabilities.
- Shareholders' equity was negative at every year end from FY2021 to FY2025. The Sep 30, 2026 balance sheet shows $5,005 million of treasury stock, the cost of shares Otis has bought back.
- Because equity is negative, this page shows no debt-to-equity ratio, return on equity or book value.
- Net debt at Dec 31, 2025 was 2.97 times FY2025 EBITDA (Cityfort calculation from the FY2025 10-K and the Q4 FY2025 earnings release).
- The $1.5 billion revolving credit facility, maturing Aug 8, 2030, was undrawn at Sep 30, 2026, and no commercial paper was outstanding.
- On Nov 5, 2026, after the quarter ended, Otis issued $500 million of 5.825% notes due 2036.
Sources (6)
20Who owns it
20Who owns it · ownership as of Mar 30, 2026
Who owns Otis?
- Officers and directors (as a group), shares
- 0.1%
Share classes
Holders of 5% or more
From the company's proxy statement (DEF 14A), later Schedule 13G filings and the share counts on its latest annual or quarterly report. Each holder row shows the date of its own filing.
Learn: How to read a proxy statement (DEF 14A): Nvidia's 2026 proxy · Form 4 insider filings: who files, the codes and the footnotes
21What it does with profit
21What it does with profit
What does Otis do with its profit?
Dividend per share
$1.65FY2025
Dividend paid for each share, by financial year.
$ per share
See the numbers
Buyback · Dec 31, 2024
Common stock repurchased in FY2024 (about $1.0 billion).
$1.0B
Buyback · Dec 31, 2025
Common stock repurchased in FY2025.
$809M
Buyback · Sep 30, 2026
About 9.6 million shares repurchased in the first nine months of FY2026, none of them in Q3.
$800M
22Governance signals
22Governance signals
What do Otis' governance filings show?
- Auditor
- PricewaterhouseCoopers LLP, since 2019
- Auditor changes
- None in the period covered
- Audit qualifications
- None reported
- Related-party dealings
- The main link to former parent RTX (formerly United Technologies) is the Tax Matters Agreement from the 2020 spin-off. Under it, Otis estimated at Sep 30, 2026 that it still owed RTX $55 million tied to the outcome of the German tax litigation.
- Credit rating
- No public credit rating found in a search of rating agency sites on Nov 20, 2026
Flags to know about
other
CEO is also Chair
Judith F. Marks holds both roles. John H. Walker is the independent Lead Director.
other · Sep 15, 2026
CEO succession under way
An 8-K filed Sep 15, 2026 says Marks will retire on the earlier of her successor's start (expected in the first half of 2027) and Jul 31, 2027, and will then leave the board.
other
Insider trading policy
The 2026 proxy says the policy bars directors, officers and colleagues from short sales and hedging of Otis stock.
23How it got here
23How it got here
How did Otis get here?
1998
Milestone
China joint venture formed
Otis China was set up in 1998 with Tianjin Tai Kang Investment as partner; Otis Electric, its subsidiary, dates from 1997.
2020
Business-model change
Spun off from United Technologies
In April 2020, Otis and Carrier were separated from United Technologies (now RTX), and Otis became its own listed company.
2022
Milestone
CEO also becomes Chair
Judith F. Marks, already President and CEO, became Chair in February 2022.
2024
Milestone
German tax ruling
A favorable German tax ruling in August 2024 added about $200 million of interest income in FY2024; refunds began in 2025.
2025
Crisis
China sales keep falling
China sales fell to $1,650 million in FY2025 from $2,444 million in FY2023, and New Equipment fell 7% organically.
2025
Milestone
Full control of Otis Electric
In October 2025, Otis bought out the minority shareholder of Otis Electric in China.
2026
Milestone
WeMaintain investment
In April 2026, Otis announced a majority investment in WeMaintain, an elevator service provider.
2026
Milestone
CEO retirement announced
On Sep 15, 2026, Otis said Judith F. Marks will retire by Jul 31, 2027 at the latest.
24Sources and changes
Where every number on this page comes from
Sources (25 documents)
- S1Otis Worldwide Form 8-K filed 2026-11-05 (Item 8.01/5.02/1.01 event) · Otis Worldwide / SEC EDGAR · Tier 1: company or exchange filing · Nov 5, 2026
- S2Form 10-Q for Q3 FY2026 · SEC EDGAR · Tier 1: company or exchange filing · Oct 29, 2026
- S3Otis Worldwide earnings release (8-K Ex. 99.1) 2026-10-28 · Otis Worldwide / SEC EDGAR · Tier 1: company or exchange filing · Oct 28, 2026
- S4Otis Worldwide Form 8-K filed 2026-09-15 (Item 8.01/5.02/1.01 event) · Otis Worldwide / SEC EDGAR · Tier 1: company or exchange filing · Sep 15, 2026
- S5Form 10-Q for Q2 FY2026 · SEC EDGAR · Tier 1: company or exchange filing · Jul 23, 2026
- S6Otis Worldwide earnings release (8-K Ex. 99.1) 2026-07-22 · Otis Worldwide / SEC EDGAR · Tier 1: company or exchange filing · Jul 22, 2026
- S8Form 10-Q for Q1 FY2026 · SEC EDGAR · Tier 1: company or exchange filing · Apr 23, 2026
- S9Otis Worldwide earnings release (8-K Ex. 99.1) 2026-04-22 · Otis Worldwide / SEC EDGAR · Tier 1: company or exchange filing · Apr 22, 2026
- S10Otis Worldwide Form DEF 14A filed 2026-04-17 · Otis Worldwide / SEC EDGAR · Tier 1: company or exchange filing · Apr 17, 2026
- S11Form 10-K for FY2025 · SEC EDGAR · Tier 1: company or exchange filing · Feb 5, 2026
- S12Otis Worldwide earnings release (8-K Ex. 99.1) 2026-01-28 · Otis Worldwide / SEC EDGAR · Tier 1: company or exchange filing · Jan 28, 2026
- S13Otis Worldwide Form 8-K filed 2026-01-20 (Item 8.01/5.02/1.01 event) · Otis Worldwide / SEC EDGAR · Tier 1: company or exchange filing · Jan 20, 2026
- S14Form 10-Q for Q3 FY2025 · SEC EDGAR · Tier 1: company or exchange filing · Oct 30, 2025
- S15Otis Worldwide earnings release (8-K Ex. 99.1) 2025-10-29 · Otis Worldwide / SEC EDGAR · Tier 1: company or exchange filing · Oct 29, 2025
- S18Otis Worldwide Form 8-K filed 2025-08-08 (Item 8.01/5.02/1.01 event) · Otis Worldwide / SEC EDGAR · Tier 1: company or exchange filing · Aug 8, 2025
- S19Form 10-Q for Q2 FY2025 · SEC EDGAR · Tier 1: company or exchange filing · Jul 24, 2025
- S20Otis Worldwide earnings release (8-K Ex. 99.1) 2025-07-23 · Otis Worldwide / SEC EDGAR · Tier 1: company or exchange filing · Jul 23, 2025
- S21Form 10-Q for Q1 FY2025 · SEC EDGAR · Tier 1: company or exchange filing · Apr 24, 2025
- S22Otis Worldwide earnings release (8-K Ex. 99.1) 2025-04-23 · Otis Worldwide / SEC EDGAR · Tier 1: company or exchange filing · Apr 23, 2025
- S23Form 10-K for FY2024 · SEC EDGAR · Tier 1: company or exchange filing · Feb 4, 2025
- S24Otis Worldwide earnings release (8-K Ex. 99.1) 2025-01-29 · Otis Worldwide / SEC EDGAR · Tier 1: company or exchange filing · Jan 29, 2025
- S25Form 10-Q for Q3 FY2024 · SEC EDGAR · Tier 1: company or exchange filing · Oct 31, 2024
- S26Form 10-Q for Q2 FY2024 · SEC EDGAR · Tier 1: company or exchange filing · Jul 25, 2024
- S27Form 10-K for FY2023 · SEC EDGAR · Tier 1: company or exchange filing · Feb 2, 2024
- S30Form 10-K for FY2022 · SEC EDGAR · Tier 1: company or exchange filing · Feb 3, 2023
Changes to this page (v1 · Nov 20, 2026)
- v1 · Nov 20, 2026First version. (first version)
Numbers come only from tier 1 and tier 2 sources. Read how we research.
Disclaimer
For learning only. Cityfort is not a registered investment adviser or broker-dealer and does not recommend buying or selling any security. Prices shown are dated and may be out of date.
Investing in securities involves risk, including loss of capital. Before making any investment decision, do your own research and consider consulting a registered investment adviser or other qualified professional.
Cityfort, its owners and contributors may or may not hold securities of companies covered. Cityfort is not paid by any company it covers. Content is not an offer or solicitation to buy or sell any security, including in any initial public offering.
Read the positions policyRead the full disclaimerHide the full disclaimer
Cityfort publishes general educational content that explains how listed companies work. Cityfort is not registered with the US Securities and Exchange Commission or any state securities regulator as an investment adviser, and is not a broker-dealer or a member of FINRA. Cityfort does not provide investment, tax or legal advice, recommendations, ratings, price targets or any opinion on whether to buy, sell or hold any security. Nothing on the site is tailored to any person's circumstances.
All information is taken from publicly available sources, mainly company filings with the SEC, which are listed on each page with dates. We work to keep it accurate and correct errors publicly, but we do not guarantee that it is complete, accurate or up to date. Any market price or price-based ratio shown is dated, may be out of date by the time you read it, and is included only to explain concepts.
Statements by company management, including forward-looking statements and guidance, are reported as the company's statements, with their date and source; they are not our forecasts. Adjusted (non-GAAP) figures are the company's own measures and are shown next to the official (GAAP) figures.