Industrials · NYSE: RSG
Republic Services: how the business works
Republic Services picks up trash and recycling from US and Canadian homes and businesses. It buries much of it in the 207 active landfills it owns or operates, and had $16.6 billion of revenue in FY2025.
By Hardik Bhandare · Checked against filings: . Editorial policy. Corrections
Follow Republic Services
Email me when Republic Services's page is updated after earnings.
We'll send a confirmation email first. See our privacy policy.
Republic Services, Inc. · Phoenix, Arizona
Updated for Q3 FY2026 · checked
- Revenue, FY2025
- $16.6B
- Net income, FY2025
- $2.14B
- Active landfills, Dec 31, 2025
- 207
- Full-time employees, Dec 31, 2025
- About 42,000
- Largest holder (Cascade Investment), Mar 9, 2026
- 35.5%
The short version
Republic Services in 5 points
1 · What it sells
Republic Services picks up trash and recycling in the US and Canada, runs 207 active landfills and treats industrial waste, with $16,591 million of revenue in FY2025.
2 · Who pays it
In FY2025, collection from homes, businesses and building sites brought 67.7% of revenue, landfill fees 11.6%, environmental solutions 10.6%, transfer stations 5.1%, recycled material 2.6% and other non-core services 2.4%.
3 · What it keeps from $100
Of every $100 that came in during FY2025, Republic kept $12.87 as net income, after a $163 million loss from tax-credit equity investments; operating income (before interest, that loss and tax) was $3,302 million.
4 · Where the operating profit comes from
In FY2025, Group 1 (western US) earned $2,522 million of adjusted EBITDAOperating profit before wear-and-tear charges (depreciation and amortization). As a margin: per $100 of sales., Group 2 (east, south, midwest and Canada) $2,413 million and Group 3 (environmental solutions) $372 million, the company’s segment profit measure.
5 · The one thing to watch
Environmental solutions revenue fell to $1,766 million in FY2025 from $1,843 million; in Q3 FY2026 it was $529 million, against $433 million a year earlier.
Sources: From Republic Services’ FY2025 10-K and Q3 FY2026 earnings release · checked
01Where the money goes · FY2025
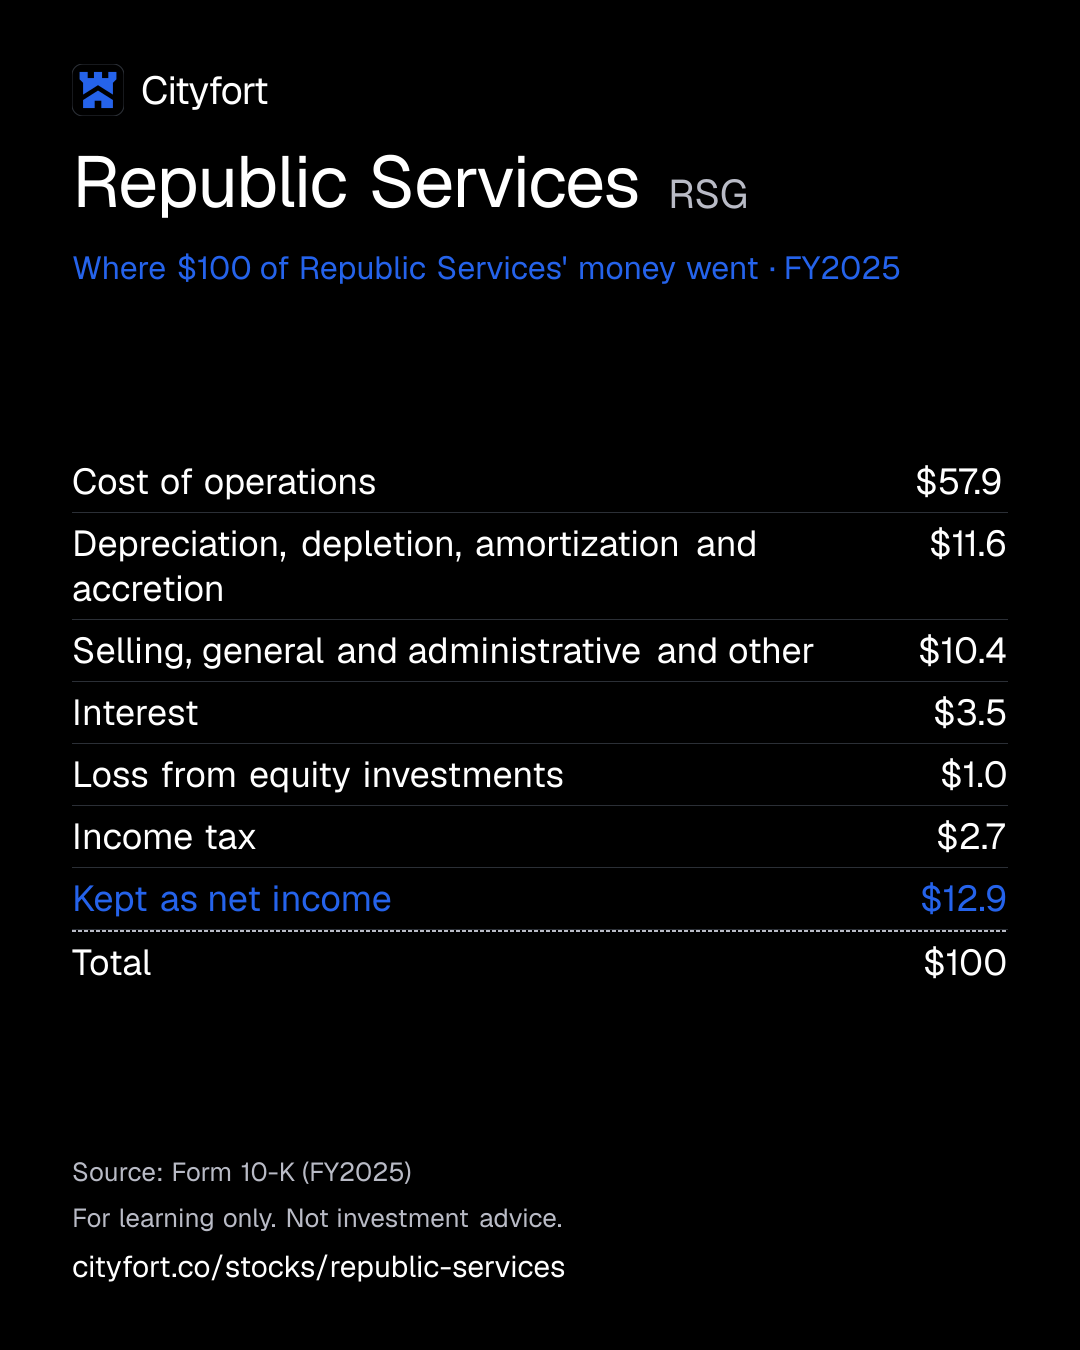
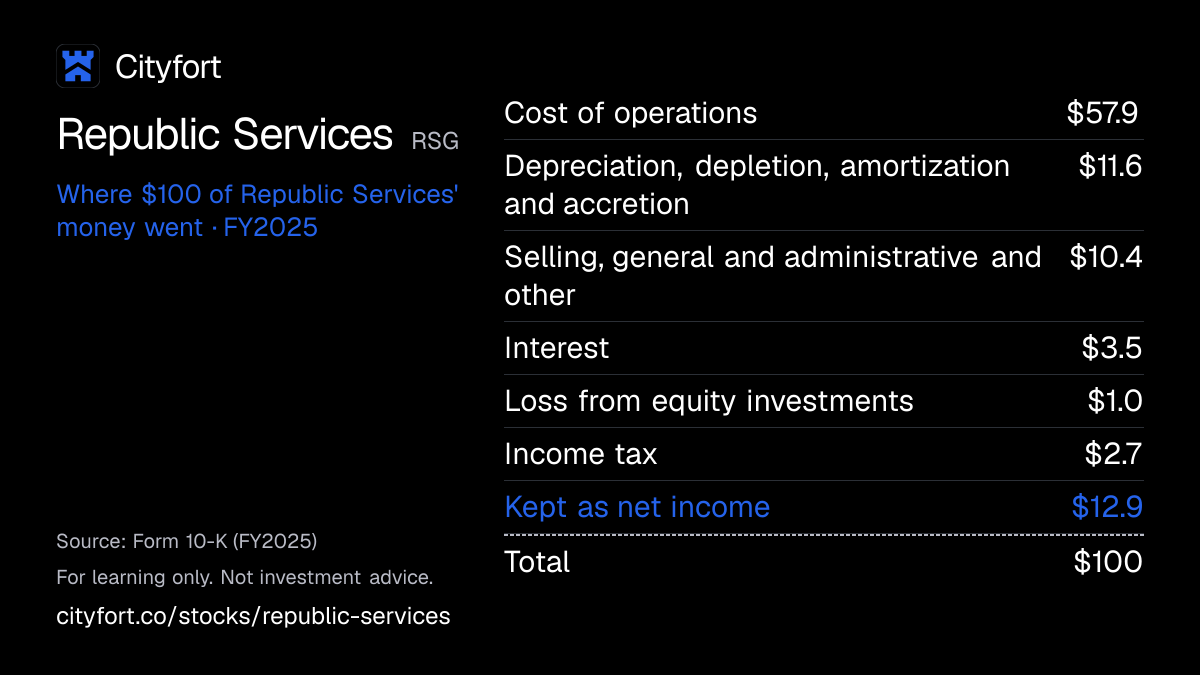
Where does $100 of Republic Services' money go?
Republic Services · FY2025
Receipt for every $100
| Cost of operations | $57.9 |
|---|---|
| Depreciation, depletion, amortization and accretion | $11.6 |
| Selling, general and administrative and other | $10.4 |
| Interest | $3.5 |
| Loss from equity investments | $1.0 |
| Income tax | $2.7 |
| Kept as net income | $12.9 |
| Total | $100 |
Each line = amount ÷ total money in × 100. Lines may not add to exactly $100 because of rounding.
How this is worked out
Cityfort calculation from FY2025 10-K. Of every $100 that came in during FY2025: each line = line ÷ $16,620 million × 100 (revenue $16,591 million + $29 million of interest and other income).
Save this receipt as an image
Embed this receipt or the key numbers
Paste this code into a blog or website to show the card you choose, with a link back to this page.
Each week: the next company due to report earnings, explained in 5 points.
No tips. Unsubscribe anytime.
We'll send a confirmation email. See our privacy policy.
02The business in one line
What does Republic Services do?
Homes, businesses and cities pay Republic Services to haul their waste away and bury or treat it. Most of the money is spent on drivers, disposal, fuel and repairs. In FY2025, $12.87 of every $100 that came in was left as net income.
- Collection from homes, shops, offices and building sites brought 67.7% of FY2025 revenue; landfill fees added 11.6% and industrial waste work 10.6%.
- Running the routes and sites cost $57.94 of every $100 in FY2025, and wear and tear on trucks, landfills and buildings another $11.60.
03Who pays it
Who pays Republic Services?
Businesses with small bins
30.5%
of revenue
Shops, offices and restaurants, usually on one- to three-year service agreements.
Building sites and factories (large containers)
18.7%
of revenue
Large roll-off containers and compactors, some for one-off jobs, some recurring.
Households, mostly through city contracts
18.1%
of revenue
Curbside pickup, usually under contracts with municipalities won through competitive bids.
Haulers and cities paying to dump at landfills
11.6%
of revenue
Fees charged per load at Republic landfills; loads from its own trucks are not counted here.
Industrial clients (environmental solutions)
10.6%
of revenue
Factories and plants paying to treat, recycle or dispose of industrial and hazardous waste.
Haulers using transfer stations
5.1%
of revenue
Fees to drop loads at Republic transfer stations, including other private and municipal haulers.
Buyers of recycled material
2.6%
of revenue
Buyers of sorted cardboard, paper, metal and plastic from Republic recycling centers.
- Businesses with small bins30.5%
- Building sites and factories (large containers)18.7%
- Households, mostly through city contracts18.1%
- Haulers and cities paying to dump at landfills11.6%
- Industrial clients (environmental solutions)10.6%
- Haulers using transfer stations5.1%
- Buyers of recycled material2.6%
How spread out the customers are
The FY2025 10-K names no single large customer; it says the wide variety of customers limits concentration of credit risk.
Sources (1)
04How it makes money
How does Republic Services make money?
Owning the landfill at the end of the route
Republic collects waste on dense local routes and, where it can, takes it to its own transfer stations and landfills. That way it earns the pickup fee and keeps the disposal fee too. In FY2025 core price (yearly price rises) added 5.9% to revenue, while lower volume took away 0.6%.
Net income kept per $100 of revenue
$11.6$12.9
FY2023 to FY2025
- Win city contracts and business customers on local routes
- More stops per route spread truck and driver costs
- Route loads go to its own transfer stations and landfills
- It keeps disposal fees instead of paying them to others
- Yearly price rises lift revenue
- Cash buys more local haulers and landfills
↺ Step 6 feeds back into step 1.
Sources (1)
05Business segments · FY2025
Which businesses make up Republic Services?
Group 1 (recycling and waste, western US)
45.3%Collection, transfer, recycling and landfills in the western United States. Adjusted EBITDA $2,522 million, 33.6% of its revenue.
Revenue $7.5B ($7,509M)
Group 2 (recycling and waste, east, south, midwest and Canada)
44.1%The same services in the southeast, midwest, eastern seaboard and Canada. Adjusted EBITDA $2,413 million, 33.0% of revenue.
Revenue $7.3B ($7,316M)
Group 3 (environmental solutions)
10.6%Industrial and hazardous waste treatment and disposal in the US and Canada. Adjusted EBITDA $372 million, 21.1% of revenue.
Revenue $1.8B ($1,766M)
How the mix changed
- Group 1 (recycling and waste, western US)
- Group 2 (recycling and waste, east, south, midwest and Canada)
- Group 3 (environmental solutions)
Revenue by segment, FY2023 to FY2025.
US$
See the numbers
Sources (1)
06The numbers · Consolidated · US$
How has Republic Services done?
Revenue
$16.6BFY2025
Revenue rose every year from FY2021 to FY2025, and each FY2026 quarter was above the same quarter of FY2025. It is shown as the 10-K reports it, net of amounts charged between Republic's own units.
US$
See the numbers
Net income
$2.1BFY2025
Net income rose every year, from $1,290 million in FY2021 to $2,139 million in FY2025.
US$
See the numbers
Net income for every $100 of revenue
$12.9FY2025
Profit kept per $100 of revenue dipped in FY2022, then rose in each of the next three years to FY2025.
Net margin: $ of net income per $100 of revenue
See the numbers
Free cash flow
$2.4BFY2025
Free cash flow (operating cash flow minus spending on trucks, landfills and buildings) rose every year, from $1,470 million in FY2021 to $2,409 million in FY2025.
US$ · cash from operations minus spending on plants and equipment
See the numbers
See all yearly numbers
EBITDA here = operating income plus depreciation and amortization (from the cash flow statement). Fiscal years are the company's own: Fiscal year ends Dec 31 (the calendar year). Net income is the share belonging to the company's owners.
Learn: Fiscal years that don't end in December: Nvidia's FY2027 explained · Stock-based compensation and dilution: pay that becomes shares
Sources (15)
- Form 10-K for FY2021
- Form 10-K for FY2022
- Form 10-K for FY2023
- Form 10-K for FY2024
- Form 10-K for FY2025
- Form 10-Q for Q1 FY2024
- Form 10-Q for Q2 FY2024
- Form 10-Q for Q3 FY2024
- 8-K Ex. 99.1, Q4 FY2025 earnings release
- Form 10-Q for Q1 FY2025
- Form 10-Q for Q2 FY2025
- Form 10-Q for Q3 FY2025
- Form 10-Q for Q1 FY2026
- Form 10-Q for Q2 FY2026
- Form 10-Q for Q3 FY2026
07Who runs it
Who runs Republic Services, and did they deliver?
Jon Vander Ark
President and Chief Executive Officer · since 2021
With Republic since 2013 (marketing chief, then operations roles, then COO); at McKinsey from 2000 to 2012. A director since July 2021.
Brian DelGhiaccio
Executive Vice President and Chief Financial Officer · since 2020
CFO since June 2020.
Brian Bales
Executive Vice President and Chief Development Officer · since 2015
Chief Development Officer since Feb 2015; with Republic since 1998, first in corporate development, then business development (EVP Dec 2008 to Feb 2015).
Manuel Kadre
Independent Chairman of the Board · since 2017
Chairman since March 2017 and a director since June 2014.
What they said, and what happened
3 delivered · 1 too early to tell
Said on Feb 13, 2025
Feb 13, 2025: Republic expected FY2025 adjusted EBITDA of $5.275 billion to $5.325 billion.
DeliveredWhat happened
FY2025 adjusted EBITDA was $5,307 million, inside the range.
Said on Feb 13, 2025
Feb 13, 2025: Republic expected FY2025 adjusted EPS of $6.82 to $6.90.
DeliveredWhat happened
FY2025 adjusted EPS was $7.02, above the range.
Said on Jul 29, 2025
Jul 29, 2025: Republic raised its FY2025 adjusted free cash flowCash from operations minus spending on buildings and equipment. Learn more outlook to $2.375 billion to $2.415 billion.
DeliveredWhat happened
FY2025 adjusted free cash flow was $2,433 million, above the range.
Said on Feb 17, 2026
Feb 17, 2026: Republic expected FY2026 adjusted EBITDA of $5.475 billion to $5.525 billion.
Too early to tellWhat happened
On Oct 29, 2026 the range was raised to $5.550 billion to $5.575 billion; first nine months adjusted EBITDA was $4,194 million.
08What could go wrong
What could go wrong for Republic Services?
- Execution
Strikes and labor costs
About 22% of workers were covered by union contracts at the end of FY2025. The 10-K says strikes interrupted service in 2025, and Q3 FY2025 results carried $56 million of costs from labor disruptions.
Watch Strike reports and the cost of operations as a share of revenue each quarter.
- Regulation
Landfill closing and clean-up costs
Republic must pay to cap, close and monitor its landfills for years after they fill. At Dec 31, 2025 it carried $2,313 million for closing and monitoring landfills and $443 million for environmental clean-up, and the 10-K says wrong estimates could hurt results.
Watch Accrued landfill and environmental costs in each 10-K.
- Debt
Debt and credit ratings
Debt was $14,055 million on Sep 30, 2026. The 10-K lists losing its investment-grade ratings (A-, A-, A3) as a risk to its plans.
Watch Rating changes and net debt against adjusted EBITDA.
- Raw-material prices
Recycled material prices
Average recycled commodity prices moved from $155 per ton in Q1 FY2025 to $120 in Q1 FY2026 and $142 in Q3 FY2026; lower prices cut recycling revenue.
Watch Average price per ton in each earnings release.
- Raw-material prices
Diesel prices
Fuel is a large operating cost and Republic had no fuel hedges on Sep 30, 2026. The 10-K says it may not recover all cost increases from customers.
Watch Fuel cost lines in the 10-Q.
- Regulation
Permits for landfills and sites
The 10-K says Republic may be unable to get or keep permits, or to expand landfill capacity, which could cut revenue and raise costs.
Watch Remaining permitted landfill capacity in each 10-K (about 5.0 billion cubic yards at end FY2025).
- Regulation
Tax-credit investments
Republic recorded $163 million of losses in FY2025 from equity investments that earn renewable-energy tax credits. The 10-K lists changes to federal renewable fuel policies as a risk.
Watch The equity-method lossProfits or losses from companies it partly owns, counted in proportion to its stake. line and the tax rate in each 10-Q.
09Supporters vs. critics
What do supporters and critics point to?
What supporters point to
- Core price added 5.9% to FY2025 revenue and 5.3% in Q3 FY2026, according to the FY2025 10-K and the Q3 FY2026 earnings release.
- Republic ran 207 active landfills with about 5.0 billion cubic yards of permitted space at the end of FY2025; the 10-K lists getting or expanding permits as a risk.
- FY2025 adjusted EBITDA of $5,307 million came inside the range Republic gave on Feb 13, 2025, and adjusted EPS of $7.02 came above it.
- Net income rose to $2,139 million in FY2025 from $1,731 million in FY2023.
- The quarterly dividend rose to $0.670 in July 2026, and on Oct 28, 2026 the board approved $5 billion of buybacks for 2027 to 2029.
What critics point to
- Volume fell 0.6% in FY2025 and again in Q3 FY2026, while core price rose 5.9% and 5.3% in those periods.
- Debt was $14,055 million against $92 million of cash on Sep 30, 2026; net debt was 2.54 times FY2025 adjusted EBITDA at Dec 31, 2025 (Cityfort calculation from the FY2025 10-K).
- Environmental solutions revenue fell to $1,766 million in FY2025 from $1,843 million, and its 21.1% adjusted EBITDA margin trailed the other two groups’ 33.0% and 33.6%.
- Losses from tax-credit equity investments were $163 million in FY2025, and the 10-K lists changes to federal renewable fuel policies as a risk.
- About 22% of workers were covered by union contracts at the end of FY2025, and labor disruptions cost $56 million in Q3 FY2025.
10What to watch next
What should you watch next at Republic Services?
Next event
Q4 FY2026 results
Date not announced yet.
FY2026 against Republic’s outlook
On Oct 29, 2026 Republic said it expected FY2026 revenue of $17.425 billion to $17.475 billion and adjusted EBITDA of $5.550 billion to $5.575 billion; adjusted EBITDA was $4,194 million in the first nine months.
Environmental solutions
Group 3 revenue was $529 million in Q3 FY2026, against $433 million a year earlier, after it fell to $1,766 million in FY2025 from $1,843 million.
Recycled material prices
The average price was $142 per ton in Q3 FY2026, up from $120 in Q1 FY2026; recycled material was 2.6% of FY2025 revenue.
Debt and buybacks
Net debt was $13,963 million on Sep 30, 2026 (Cityfort calculation from the Q3 FY2026 10-Q), and a new $5 billion buyback authorization runs from Jan 1, 2027 to Dec 31, 2029.
11Key facts
Key facts about Republic Services
- What does Republic Services do?
- Republic Services collects trash and recycling from homes and businesses in the United States and Canada, and runs 207 active landfills, 255 transfer stations and 79 recycling centers (end of FY2025).
- How does Republic Services make money?
- Republic Services charges to collect waste and again to dump it at its sites. In FY2025 collection was $11,233 million, 67.7% of revenue, and landfill fees $1,920 million, 11.6%.
- Who are Republic Services’ customers?
- In FY2025 Republic Services earned 30.5% of revenue from businesses with small bins, 18.7% from building sites and factories, 18.1% from households (mostly through city contracts) and 2.4% from other non-core services. The 10-K names no single large customer.
- How big is Republic Services?
- Republic Services had $16,591 million of revenue and $2,139 million of net income in FY2025, with about 42,000 full-time employees and about 17,800 collection trucks.
- How much of each $100 does Republic Services keep?
- Of every $100 that came in during FY2025, Republic Services kept $12.87 as net income (Cityfort calculation from the FY2025 10-K), after a $163 million loss from tax-credit equity investments. Operating income was $3,302 million.
- Who owns Republic Services?
- On Mar 9, 2026, Cascade Investment, L.L.C., whose shares are deemed beneficially owned by William H. Gates III, held 35.5% of Republic Services. Vanguard (5.9%, Feb 2024 filing) and BlackRock (5.1%, Apr 2025 filing) followed; directors and executive officers held 0.12%.
- How much debt does Republic Services have?
- On Sep 30, 2026, Republic Services had $14,055 million of debt and $92 million of cash. Its FY2025 operating income of $3,302 million covered interest expense of $574 million 5.8 times (Cityfort calculation from the FY2025 10-K).
- Does Republic Services pay a dividend?
- Yes. Republic Services paid $738 million of dividends in FY2025 and raised its quarterly dividend to $0.670 a share from $0.625 in July 2026.
Terms on this page
- Capital expenditures (capex)
- Debt-to-equity
- Earnings per share (EPS)
- EBITDA
- Free cash flow
- Interest coverage
- Net debt
- Net margin
- Revenue vs net income
- Stock buyback
Each explains the term in plain English, with the same number from other companies on Cityfort.
Go deeper
More detail from the same filings. Open any section.
12What it sells
12What it sells
What does Republic Services sell?
Trash and recycling pickup
Curbside collection for homes, bins for shops and offices, and large containers for building sites and factories. Collection was $11,233 million, 67.7% of FY2025 revenue.
Landfills
Places where waste is buried under permits. Republic ran 207 active landfills at the end of FY2025; landfill fees were $1,920 million, 11.6% of revenue.
Transfer stations
Sites where trucks drop loads to be packed into larger vehicles for the trip to a landfill. 255 stations; $848 million, 5.1% of FY2025 revenue.
Recycling centers and Polymer Centers
79 recycling centers sort paper, cardboard, metal and plastic and sell it. Polymer Centers turn sorted plastic into material for new packaging.
Environmental solutions
Handling, treating and disposing of industrial and hazardous waste, including disposal wells and wastewater plants. $1,766 million, 10.6% of FY2025 revenue.
Landfill gas and solar
Gas from rotting waste is captured at landfills and turned into energy. Republic was part of 84 landfill gas-to-energy and other renewable projects at the end of FY2025.
Think of it like this
Like a toll road for trash: it earns a fee when it collects a load, and often a second fee when that load goes into its own landfill.
What it does
- Does: Collects trash and recycling for homes, shops, offices and building sites
- Does: Owns and runs landfills, transfer stations and recycling centers
- Does: Treats and disposes of industrial and hazardous waste
- Does: Sells sorted recycled material such as cardboard and plastic
What it does not do
- Does not: Operate outside the United States and Canada
- Does not: Make its own trucks: it buys them and runs a fleet of about 17,800 collection vehicles
- Does not: Get most of its money from selling recycled material: that was 2.6% of FY2025 revenue
- Does not: Hedge diesel prices (lock them in with financial contracts): it had no fuel hedges in place on Sep 30, 2026
Sources (1)
13How the money flows
13How the money flows · FY2025
How does money flow through Republic Services?
Money in
- Revenue$16.6B
- Interest income and other income$29M
The company
Republic Services
$16.6B came in
Money out
- Cost of operations (labor, disposal, fuel, repairs, subcontractors)$9.6B
- Depreciation, depletion, amortization and landfill accretion$1.9B
- Selling, general and administrative, restructuring and pension items$1.7B
- Interest on debt$574M
- Loss from tax-credit and other equity investments$163M
- Income tax$455M
- Net income$2.1B
- Homes, businesses and industrial clients paid Republic $16,591 million in FY2025.
- The largest cost, $9,630 million, was running the routes and sites: drivers, disposal fees, fuel and repairs.
- Trucks, landfills and buildings wear out or fill up; that cost $1,928 million.
- Office costs, interest on $13.6 billion of debt and taxes took most of the rest.
- $2,139 million was left as net income, about $12.87 of each $100 that came in.
Sources (1)
14What it needs to run
14What it needs to run
What does Republic Services need to run?
Landfill space and permits
41,158 permitted acres with about 5.0 billion cubic yards of space left at the end of FY2025. New or larger landfills need government permits.
Trucks
About 17,800 collection vehicles, average age 7.9 years; about 79% of residential routes use automated trucks.
Drivers and site workers
About 42,000 full-time employees at the end of FY2025; about 22% were covered by union contracts.
Diesel fuel
Fuel is a large operating cost. Republic had no fuel hedges in place on Sep 30, 2026.
Borrowed money
Debt of $14.1 billion on Sep 30, 2026 helps pay for trucks, landfills and acquisitions.
Sources (2)
15Where it sells
15Where it sells · FY2025
Where does Republic Services sell?
- United States98.9%
- Canada1.1%
Sources (1)
16Competitors and what protects it
16Competitors and what protects it
Who does Republic Services compete with?
Waste Management (WM)
NYSE: WM
A national waste company; Republic’s 2026 proxy lists it among the companies it compares executive pay against.
Waste Connections
Also named in the 2026 proxy’s pay-comparison group; the 10-K says Republic competes with large national waste companies.
City and county waste departments
Many municipalities collect trash themselves; the 10-K names them as competitors, and city contracts are usually won by competitive bids.
Regional and local haulers
The 10-K says competition for collection accounts is typically based on quality of service and price.
What protects the business
Each strength is scored 1 (weak) to 5 (strong) for the business, with the reason. It is not a rating of the share.
- Landfills and permits4 of 5
207 active landfills with about 5.0 billion cubic yards of permitted space at the end of FY2025; the 10-K lists getting or expanding permits as a risk, which also limits new rivals.
- Route density4 of 5
377 collection operations and about 17,800 trucks; collection is a local business where more stops per route spread the cost.
- Contracts3 of 5
Homes are usually served under city contracts and businesses under one- to three-year agreements, but city contracts are rebid.
- Pricing3 of 5
Core price added 5.9% to FY2025 revenue and 5.3% in Q3 FY2026, while volume fell 0.6% in both periods.
Weak spot
Environmental solutions
Group 3 revenue fell to $1,766 million in FY2025 from $1,843 million, and its adjusted EBITDA margin of 21.1% was below the 33.0% to 33.6% of the two recycling and waste groups.
17Where growth could come from
17Where growth could come from
Where could Republic Services' growth come from?
In its Q3 FY2026 earnings release of Oct 29, 2026, Republic Services said it expects FY2026 revenue of $17.425 billion to $17.475 billion and adjusted EBITDA of $5.550 billion to $5.575 billion. On Feb 17, 2026 the revenue range was $17.050 billion to $17.150 billion.
Yearly price rises
WorkingCore price +5.3%, Q3 FY2026
The Q3 FY2026 release puts average yield (revenue growth from changes in average price) at 2.9% and volume at minus 0.6%.
Status: Working, on track against what the company said.
Buying local companies
Working$1.12B spent, first 9 months of FY2026
Acquisitions added 1.3 points of the 8.2% revenue growth in Q3 FY2026; Republic spent $1,430 million on acquisitions and investments in FY2025.
Status: Working, on track against what the company said.
Environmental solutions recovery
Mixed$529M revenue, Q3 FY2026 (vs $433M)
Group 3 revenue fell 4.2% in FY2025, partly because FY2024 had about $50 million from a one-off emergency response job. Its Q3 FY2026 adjusted EBITDA margin was 25.4%.
Status: Mixed, partly on track.
Polymer Centers (plastic recycling)
Early2 open, a third under construction
The first opened in Las Vegas in 2024 and the second in Indianapolis in 2025, according to the FY2025 10-K.
Status: Early, too early to judge.
Renewable natural gas from landfills
New87 landfill gas and renewable projects, Sep 30, 2026
In 2022 Republic bought a minority stake in a venture that builds renewable natural gas plants at its landfills; the FY2025 release says nine such projects started in FY2025.
Status: New, recently announced.
Recycled material prices
Mixed$142 per ton, Q3 FY2026 (+$16)
The average price was $120 per ton in Q1 FY2026, $35 lower than a year earlier.
Status: Mixed, partly on track.
Status compares progress with what the company itself said it would do: Working = on track against what the company said; Mixed = partly on track; Behind = behind the company's own plan; New = recently announced; Early = too early to judge.
18The company's own measures (non-GAAP)
18The company's own measures · FY2025 and Q3 FY2026, unless the row says otherwise
What do Republic Services' own measures show?
Official (GAAP): Operating income, FY2025
$3.3B
Company's own measure: Adjusted EBITDA, FY2025
$5.3B
Adds back depreciation, depletion, amortization and landfill accretion, and leaves out other items the company lists. Margin 32.0% of revenue, up from 31.1% in FY2024.
Official (GAAP): Diluted EPS, FY2025
$6.85
Company's own measure: Adjusted EPS, FY2025
$7.02
Leaves out the items the company lists in its reconciliation, after tax.
Official (GAAP): Cash from operations, FY2025
$4.3B
Company's own measure: Adjusted free cash flow, FY2025
$2.4B
The company’s own definition. Cash from operations minus purchases of property and equipment, the simpler measure on this page, was $2,409 million.
Official (GAAP): Net income, Q3 FY2026
$592M
Company's own measure: Adjusted EBITDA, Q3 FY2026
$1.4B
31.8% of revenue, against $1,383 million in Q3 FY2025.
Official (GAAP): Diluted EPS, Q3 FY2026
$1.93
Company's own measure: Adjusted EPS, Q3 FY2026
$1.94
Leaves out items including a $48 million loss from equity-method (tax-credit) investments.
These are the company's own measures, defined by the company. They are not comparable across companies, and they are not added together. Each sits beside the nearest official (GAAP) figure.
Learn: Non-GAAP measures: what a company's "adjusted" numbers leave out
19Financial strength and debt
19Financial strength · Sep 30, 2026
How much debt does Republic Services have?
- Total debt$14.1B
- Cash and investments$92M
- Net debt (debt minus cash)$14.0B
- Net worth (shareholders' money)$12.2B
- Debt to equity
- 1.15×
- $ of debt for every $1 of shareholders' money
- Interest cover
- 5.8×
- how many times operating profit covers interest
- Net debt of $13,963 million is total debt of $14,055 million minus cash of $92 million (Cityfort calculation from the Q3 FY2026 10-Q). At Dec 31, 2025 it was $13,505 million, 2.54 times FY2025 adjusted EBITDA of $5,307 million (Cityfort calculation from FY2025 10-K).
- Debt to equity of 1.15 uses Republic stockholders’ equity of $12,238 million on Sep 30, 2026 (Cityfort calculation from the Q3 FY2026 10-Q).
- Interest cover of 5.8 is FY2025 operating income of $3,302 million ÷ interest expense of $574 million (Cityfort calculation from FY2025 10-K).
- In June 2026 Republic agreed to sell $700 million of 4.750% notes due 2031 and $500 million of 5.000% notes due 2036.
- The FY2025 10-K shows $2,608 million of long-term and $148 million of current accrued landfill and environmental costs at Dec 31, 2025: costs it expects to pay to close, monitor and clean up sites, recorded as liabilities.
20Who owns it
20Who owns it · ownership as of Mar 9, 2026
Who owns Republic Services?
- Officers and directors (as a group), shares
- 0.1%
Share classes
Holders of 5% or more
From the company's proxy statement (DEF 14A), later Schedule 13G filings and the share counts on its latest annual or quarterly report. Each holder row shows the date of its own filing.
Learn: How to read a proxy statement (DEF 14A): Nvidia's 2026 proxy · Form 4 insider filings: who files, the codes and the footnotes
21What it does with profit
21What it does with profit
What does Republic Services do with its profit?
Dividend per share
$2.41FY2025
Dividend paid for each share, by financial year.
$ per share
See the numbers
Buyback · Dec 31, 2025
3.8 million shares repurchased in FY2025.
$864M
Buyback · Sep 30, 2026
4.0 million shares repurchased in the first nine months of FY2026, at an average of $212.84.
$848M
22Governance signals
22Governance signals
What do Republic Services' governance filings show?
- Auditor
- Ernst & Young LLP, since 2002
- Auditor changes
- None in the period covered
- Audit qualifications
- None reported
- Related-party dealings
- Republic’s 2026 proxy says any related-party deal above $120,000 involving a director, executive officer, 5% holder or their family must be approved by both the CEO and the Audit Committee.
- Credit rating
- S&P Global Ratings, Fitch Ratings and Moody’s (as stated in the Q3 FY2026 10-Q) A- (S&P) / A- (Fitch) / A3 (Moody’s) (outlook Not stated in the 10-Q), Sep 30, 2026
A credit rating describes the company's ability to repay debt. It is not a rating of the share.
Flags to know about
other
One shareholder holds 35.5%
Cascade Investment, the investment vehicle of William H. Gates III, held 35.5% of the shares on Mar 9, 2026. Two directors, Mr. Larson and Mr. Handley, work or worked for Cascade Asset Management Company.
other
Majority independent board
The 2026 proxy says 12 of the 13 director nominees are independent, and the chairman, Manuel Kadre, is not an executive.
regulatory
No large environmental penalty cases
The FY2025 10-K says Republic had no environmental proceedings with a government body above its $1 million disclosure threshold. Environmental clean-up liabilities were $443 million at Dec 31, 2025.
23How it got here
23How it got here
How did Republic Services get here?
2021
Milestone
New CEO
Jon Vander Ark took over as chief executive after his predecessor, Mr. Slager, retired effective Jun 25, 2021.
2022
Milestone
Landfill gas venture
Republic bought part of a venture with a landfill gas developer to build renewable natural gas plants at its landfills.
2024
Business-model change
First Polymer Center
A plant in Las Vegas began turning sorted plastic into material for new packaging.
2025
Milestone
Second Polymer Center
The Indianapolis plant opened and construction began on a third; nine renewable natural gas projects started.
2025
Crisis
Strikes in some markets
Labor disruptions cost $56 million in Q3 FY2025, an item the company left out of its adjusted results.
2026
Milestone
$1.2 billion of new notes
In June Republic agreed to sell $700 million of notes due 2031 and $500 million due 2036.
2026
Milestone
Higher dividend and a $5 billion buyback
The quarterly dividend rose to $0.670 in July, and on Oct 28 the board approved $5 billion of buybacks for 2027 to 2029.
Sources (7)
- Definitive proxy statement (DEF 14A) 2026
- Form 10-Q for Q3 FY2026
- Form 10-K for FY2025
- 8-K Ex. 99.1, Q4 FY2025 earnings release
- 8-K Ex. 99.1, Q3 FY2026 earnings release
- 8-K, 4.750% notes due 2031 and 5.000% notes due 2036 (sale agreed Jun 22, 2026)
- 8-K Item 8.01, quarterly dividend raised to $0.670 per share
24Sources and changes
Where every number on this page comes from
Sources (22 documents)
- S1Form 10-Q for Q3 FY2026 · SEC EDGAR · Tier 1: company or exchange filing · Oct 30, 2026
- S2Form 10-Q for Q2 FY2026 · SEC EDGAR · Tier 1: company or exchange filing · Aug 7, 2026
- S3Form 10-Q for Q1 FY2026 · SEC EDGAR · Tier 1: company or exchange filing · May 8, 2026
- S4Form 10-K for FY2025 · SEC EDGAR · Tier 1: company or exchange filing · Feb 18, 2026
- S5Form 10-Q for Q3 FY2025 · SEC EDGAR · Tier 1: company or exchange filing · Oct 31, 2025
- S6Form 10-Q for Q2 FY2025 · SEC EDGAR · Tier 1: company or exchange filing · Jul 30, 2025
- S7Form 10-Q for Q1 FY2025 · SEC EDGAR · Tier 1: company or exchange filing · Apr 25, 2025
- S8Form 10-K for FY2024 · SEC EDGAR · Tier 1: company or exchange filing · Feb 14, 2025
- S9Form 10-Q for Q3 FY2024 · SEC EDGAR · Tier 1: company or exchange filing · Oct 30, 2024
- S10Form 10-Q for Q2 FY2024 · SEC EDGAR · Tier 1: company or exchange filing · Jul 25, 2024
- S11Form 10-Q for Q1 FY2024 · SEC EDGAR · Tier 1: company or exchange filing · May 1, 2024
- S12Form 10-K for FY2023 · SEC EDGAR · Tier 1: company or exchange filing · Feb 29, 2024
- S13Form 10-K for FY2022 · SEC EDGAR · Tier 1: company or exchange filing · Feb 23, 2023
- S14Form 10-K for FY2021 · SEC EDGAR · Tier 1: company or exchange filing · Feb 11, 2022
- S15Definitive proxy statement (DEF 14A) 2026 · SEC EDGAR · Tier 1: company or exchange filing · Mar 24, 2026
- S168-K Ex. 99.1, Q3 FY2026 earnings release · SEC EDGAR · Tier 1: company or exchange filing · Oct 29, 2026
- S188-K Ex. 99.1, Q1 FY2026 earnings release · SEC EDGAR · Tier 1: company or exchange filing · May 7, 2026
- S198-K Ex. 99.1, Q4 FY2025 earnings release · SEC EDGAR · Tier 1: company or exchange filing · Feb 17, 2026
- S218-K Ex. 99.1, Q2 FY2025 earnings release · SEC EDGAR · Tier 1: company or exchange filing · Jul 29, 2025
- S238-K Ex. 99.1, Q4 FY2024 earnings release · SEC EDGAR · Tier 1: company or exchange filing · Feb 13, 2025
- S248-K, 4.750% notes due 2031 and 5.000% notes due 2036 (sale agreed Jun 22, 2026) · SEC EDGAR · Tier 1: company or exchange filing · Jun 24, 2026
- S258-K Item 8.01, quarterly dividend raised to $0.670 per share · SEC EDGAR · Tier 1: company or exchange filing · Jul 30, 2026
Changes to this page (v1 · Nov 20, 2026)
- v1 · Nov 20, 2026First version. (first version)
Numbers come only from tier 1 and tier 2 sources. Read how we research.
Disclaimer
For learning only. Cityfort is not a registered investment adviser or broker-dealer and does not recommend buying or selling any security. Prices shown are dated and may be out of date.
Investing in securities involves risk, including loss of capital. Before making any investment decision, do your own research and consider consulting a registered investment adviser or other qualified professional.
Cityfort, its owners and contributors may or may not hold securities of companies covered. Cityfort is not paid by any company it covers. Content is not an offer or solicitation to buy or sell any security, including in any initial public offering.
Read the positions policyRead the full disclaimerHide the full disclaimer
Cityfort publishes general educational content that explains how listed companies work. Cityfort is not registered with the US Securities and Exchange Commission or any state securities regulator as an investment adviser, and is not a broker-dealer or a member of FINRA. Cityfort does not provide investment, tax or legal advice, recommendations, ratings, price targets or any opinion on whether to buy, sell or hold any security. Nothing on the site is tailored to any person's circumstances.
All information is taken from publicly available sources, mainly company filings with the SEC, which are listed on each page with dates. We work to keep it accurate and correct errors publicly, but we do not guarantee that it is complete, accurate or up to date. Any market price or price-based ratio shown is dated, may be out of date by the time you read it, and is included only to explain concepts.
Statements by company management, including forward-looking statements and guidance, are reported as the company's statements, with their date and source; they are not our forecasts. Adjusted (non-GAAP) figures are the company's own measures and are shown next to the official (GAAP) figures.