Industrials · NYSE: PWR
Quanta Services: how the business works
Quanta Services builds and repairs power lines, substations, power plants and pipelines for utilities and other companies, with FY2025 revenue of $28.5 billion.
By Hardik Bhandare · Checked against filings: . Editorial policy. Corrections
Follow Quanta Services
Email me when Quanta Services's page is updated after earnings.
We'll send a confirmation email first. See our privacy policy.
Quanta Services, Inc. · Houston, Texas
Updated for Q3 FY2026 · checked
- Revenue, FY2025
- $28.5B
- Net income, FY2025
- $1.03B
- Backlog, Sep 30, 2026 (company measure)
- $63.7B
- Revenue, Q3 FY2026
- $12.0B
- Employees, Dec 31, 2025 (about)
- 69,500
The short version
Quanta Services in 5 points
1 · What it sells
Quanta Services builds, repairs and maintains power lines, substations, power plants, data center electrical systems, communications networks and pipelines, with FY2025 revenue of $28,479.7 million.
2 · Who pays it
In FY2025 customers in the United States paid 93% of Quanta Services’ revenue, Canada 3.6%, Australia 2.7% and other countries 0.7%.
3 · What it keeps from $100
Quanta Services kept $3.61 of each $100 of FY2025 revenue as net income; operating income, before interest, tax and other items, was $1,611.5 million on revenue of $28,479.7 million.
4 · Where the operating profit comes from
The Electric segment earned $2,360 million of FY2025 segment operating income and Underground and Infrastructure $398 million.
5 · The one thing to watch
Backlog was $63.73 billion on Sep 30, 2026, against $43.98 billion at Dec 31, 2025, and fixed-price work, where the company bears cost overruns, was 68.1% of Q3 FY2026 revenue.
Sources: From Quanta Services’ FY2025 10-K, the Q3 FY2026 10-Q and the Q3 FY2026 earnings release · checked
01Where the money goes · FY2025
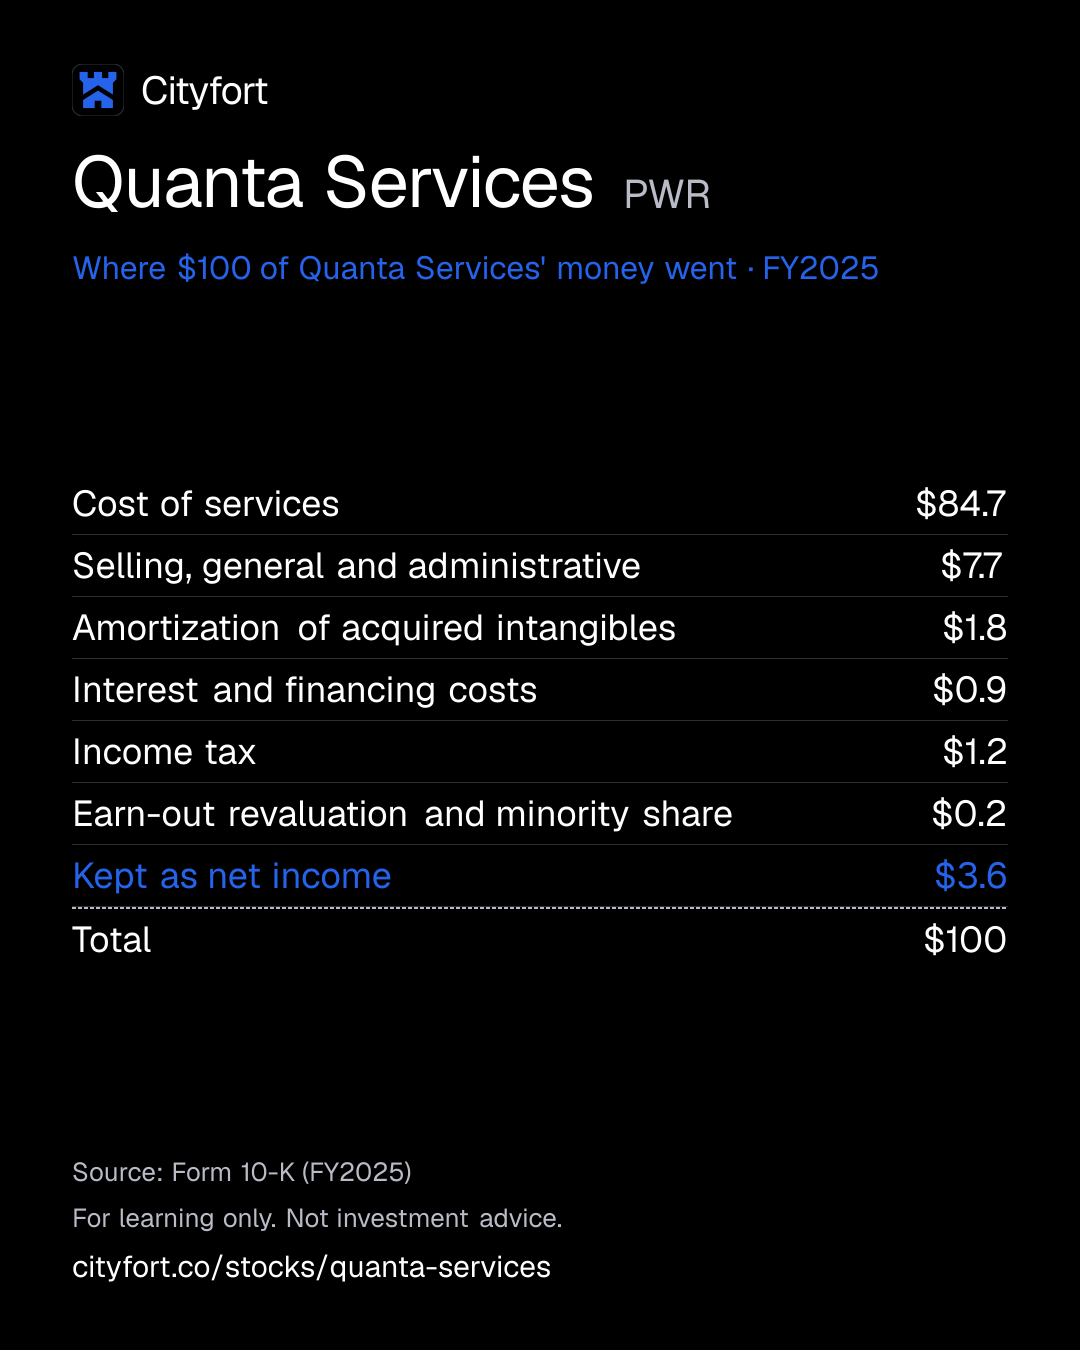
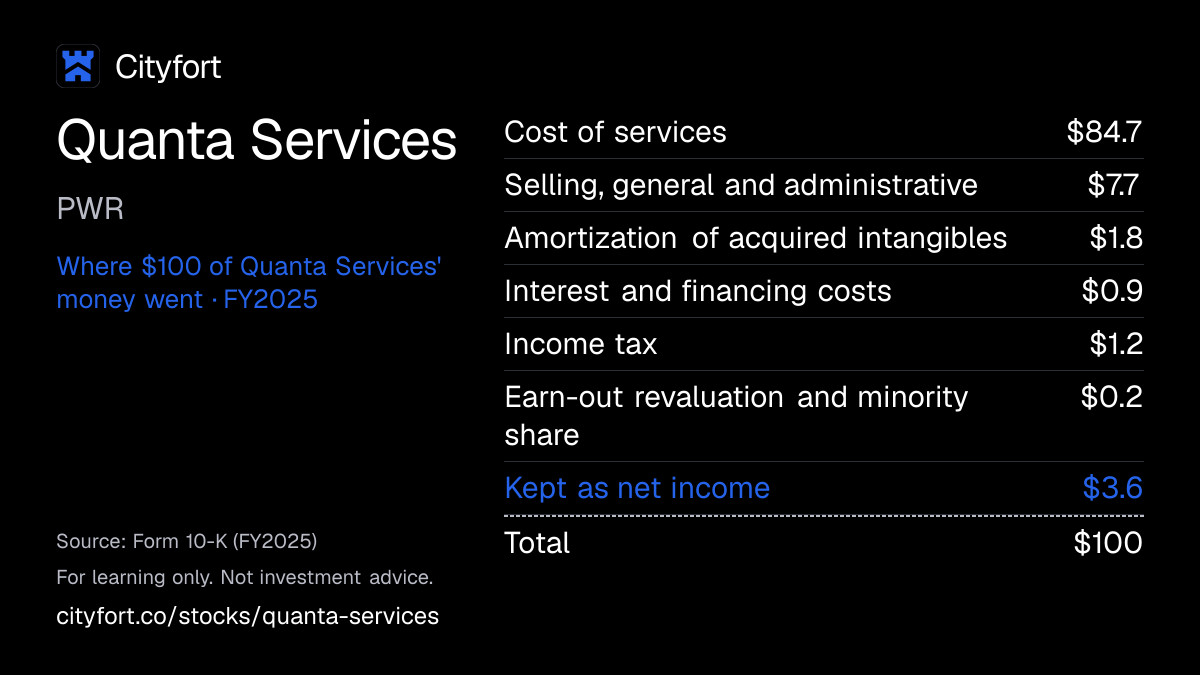
Where does $100 of Quanta Services' money go?
Quanta Services · FY2025
Receipt for every $100
| Cost of services | $84.7 |
|---|---|
| Selling, general and administrative | $7.7 |
| Amortization of acquired intangibles | $1.8 |
| Interest and financing costs | $0.9 |
| Income tax | $1.2 |
| Earn-out revaluation and minority share | $0.2 |
| Kept as net income | $3.6 |
| Total | $100 |
Each line = amount ÷ total money in × 100. Lines may not add to exactly $100 because of rounding.
How this is worked out
Cityfort calculation from the FY2025 10-K. Of every $100 that came in during FY2025 (revenue of $28,479.7 million plus $95.1 million of affiliate earnings, interest and other income): each line = line ÷ $28,574.8 million × 100.
Save this receipt as an image
Embed this receipt or the key numbers
Paste this code into a blog or website to show the card you choose, with a link back to this page.
Each week: the next company due to report earnings, explained in 5 points.
No tips. Unsubscribe anytime.
We'll send a confirmation email. See our privacy policy.
02The business in one line
What does Quanta Services do?
Utilities, power developers and data center builders pay Quanta Services to build and fix their grids, plants and pipes. Most of the money goes on crews, equipment and materials, and what’s left is a thin profit.
- In FY2025 cost of services took $24,204.6 million of $28,479.7 million of revenue, and net income was $1,028.4 million.
- Backlog, the company’s own estimate of revenue from work it has been awarded, was $63.73 billion on Sep 30, 2026.
03Who pays it
Who pays Quanta Services?
Quanta Services does not disclose how much each type of customer pays.
Electric and gas utilities
Pay for new and upgraded power lines, substations, grid hardening and gas systems, often under multi-year master service agreements (standing contracts for repeat work).
Power developers
Pay to build wind, solar, gas power and battery storage sites and connect them to the grid.
Technology and industrial companies
Pay for electrical and mechanical work at data centers, advanced factories and other large load centers.
Communications, pipeline and energy companies
Pay for network builds, pipeline systems and industrial plant work.
Where its revenue came from · FY2025
- United States93%
- Canada3.6%
- Australia2.7%
- Other0.7%
How spread out the customers are
In FY2025 Quanta Services’ largest customer was 8% of revenue and its ten largest were 30%, against 6% and 31% in FY2024. The 10-K names customers such as American Electric Power, National Grid, NextEra Energy, Duke Energy and PG&E, but not which one is largest. No customer reached 10% of revenue in the first nine months of 2026.
- Largest customer
- 8%
- Top 10 customers
- 30%
04How it makes money
How does Quanta Services make money?
Quanta Services keeps a thin slice of a large flow of labor-heavy work ($28.5 billion of revenue in FY2025), and its backlog sets how much work is coming.
Most revenue pays for crews, equipment and materials, so FY2025 net income was $3.61 of each $100 of revenue. Profit grows mainly by winning more work and keeping crews busy; fixed-price jobs add the risk of cost overruns.
Net income per $100 of revenue
$3.7$3.6
FY2021 to FY2025
- Utilities, power developers and data center builders plan multi-year spending.
- Quanta Services wins contracts and master service agreements, which build its backlog.
- It hires and trains crews and buys contractors to take on more work.
- Crews finish the work and the company bills the customer.
- Cash from the work pays for equipment, acquisitions, interest and dividends.
↺ Step 5 feeds back into step 1.
05Business segments · FY2025
Which businesses make up Quanta Services?
Electric
80.8%Power lines, substations, power plants, data center and factory electrical work, communications and storm repair; it was 81.6% of revenue in Q3 FY2026. From Q1 2025 it combines the old Electric Power and Renewable Energy segments, and FY2023 and FY2024 are recast to match.
Revenue $23.0B ($23,002M) · Operating profit $2.4B ($2,360M)
Underground and Infrastructure
19.2%Gas utility systems, pipelines, water, storage and industrial plant work.
Revenue $5.5B ($5,478M) · Operating profit $398M
How the mix changed
- Electric
- Underground and Infrastructure
Revenue by segment, FY2023 to FY2025.
US$
See the numbers
06The numbers · Consolidated · US$
How has Quanta Services done?
Revenue
$28.5BFY2025
Revenue rose every year, from $12,980.2 million in FY2021 to $28,479.7 million in FY2025, and Quanta Services bought 21 businesses from FY2023 to FY2025.
US$
See the numbers
Net income
$1.0BFY2025
Net income attributable to common stock rose from $486.0 million in FY2021 to $1,028.4 million in FY2025, and was $694.9 million in Q3 FY2026 alone.
US$
See the numbers
Net income for every $100 of revenue
$3.6FY2025
Net income was between $2.88 (FY2022) and $3.82 (FY2024) per $100 of revenue in each year from FY2021 to FY2025.
Net margin: $ of net income per $100 of revenue
See the numbers
Free cash flow
$1.6BFY2025
Operating cash flow rose from $582.4 million in FY2021 to $2,230.0 million in FY2025, leaving free cash flow of $1,620.8 million after $609.2 million of equipment spending.
US$ · cash from operations minus spending on plants and equipment
See the numbers
See all yearly numbers
EBITDA here = operating income plus depreciation and amortization (from the cash flow statement). Fiscal years are the company's own: Fiscal year ends Dec 31 (the calendar year). Net income is the share belonging to the company's owners.
Learn: Fiscal years that don't end in December: Nvidia's FY2027 explained · Stock-based compensation and dilution: pay that becomes shares
Sources (22)
- Form 10-K for FY2021
- Form 10-K for FY2022
- Form 10-K for FY2023
- Form 10-K for FY2024
- Form 10-K for FY2025
- Form 10-Q for Q1 FY2024
- Q1 FY2025 earnings release (8-K, Exhibit 99.1)
- Form 10-Q for Q2 FY2024
- Q2 FY2025 earnings release (8-K, Exhibit 99.1)
- Form 10-Q for Q3 FY2024
- Q3 FY2025 earnings release (8-K, Exhibit 99.1)
- Q4 FY2024 earnings release (8-K, Exhibit 99.1)
- Q4 FY2025 earnings release (8-K, Exhibit 99.1)
- Form 10-Q for Q1 FY2025
- Form 10-Q for Q2 FY2025
- Form 10-Q for Q3 FY2025
- Form 10-Q for Q1 FY2026
- Q1 FY2026 earnings release (8-K, Exhibit 99.1)
- Form 10-Q for Q2 FY2026
- Q2 FY2026 earnings release (8-K, Exhibit 99.1)
- Form 10-Q for Q3 FY2026
- Q3 FY2026 earnings release (8-K, Exhibit 99.1)
07Who runs it
Who runs Quanta Services, and did they deliver?
Earl C. (Duke) Austin Jr.
President and Chief Executive Officer · since 2016
Also a director; the only board member who is not independent.
Jayshree S. Desai
Chief Financial Officer · since 2022
Earlier Chief Corporate Development Officer at Quanta Services (2020 to 2022).
Karl W. Studer
President, Electric Power · since 2022
Co-founded two electric contractors that Quanta Services bought in 2013.
Gerald A. (BJ) Ducey Jr.
President, Strategic Operations · since 2023
Donald C. Wayne
Executive Vice President and General Counsel · since 2017
Doyle N. Beneby
Independent Chairman of the Board · since 2024
Different people hold the chairman and CEO roles.
What they said, and what happened
2 delivered · 1 missed · 2 too early to tell
Said on Feb 20, 2025
FY2025 revenue of $26.60 billion to $27.10 billion.
DeliveredWhat happened
FY2025 revenue was $28.48 billion, above the range; the company raised the range three times during 2025.
Said on Feb 20, 2025
FY2025 diluted EPS (GAAP) of $6.85 to $7.45.
MissedWhat happened
FY2025 diluted EPS was $6.80, below the first range; the company had cut the range to $6.53 to $7.02 by Oct 30, 2025.
Said on Feb 20, 2025
FY2025 adjusted diluted EPS of $9.90 to $10.50.
DeliveredWhat happened
FY2025 adjusted diluted EPS was $10.75, above the range.
Said on Feb 19, 2026
Record backlog in 2026.
Too early to tellWhat happened
Backlog was $63.73 billion on Sep 30, 2026, against $43.98 billion at Dec 31, 2025; the year is not over.
Said on Apr 30, 2026
More than double adjusted EPS by 2030 (target set at the March 2026 Investor Day).
Too early to tellWhat happened
FY2025 adjusted diluted EPS, the base year, was $10.75.
Sources (6)
08What could go wrong
What could go wrong for Quanta Services?
- Execution
Finding enough skilled workers
The 10-K names the availability and cost of skilled labor as a risk. The work depends on line workers and other craft staff; about 36% of its roughly 69,500 employees are under union contracts.
Watch Employee count and segment margins in each 10-K and earnings release.
- Pricing
Fixed-price jobs
On fixed-price contracts the company bears cost overruns. Fixed-price work rose from 49.1% of revenue in FY2023 to 60.6% in FY2025 and 68.1% in Q3 FY2026.
Watch Fixed-price share and segment operating margins.
- Concentration
Big customers and short-notice contracts
The ten largest customers were 30% of FY2025 revenue, and the 10-K says many of its contracts may be canceled or suspended on short notice.
Watch Top-ten customer share in the next 10-K.
- Legal
Wildfires and site accidents
The 10-K names exposure to wildfires and other hazards, and says insurance for such events may not be available at reasonable rates.
Watch Legal proceedings and insurance notes in the 10-K and 10-Qs.
- Execution
Buying and integrating companies
Goodwill (the premium paid for bought businesses over their asset value) reached $8,081.6 million on Sep 30, 2026, from $5,316.4 million at Dec 31, 2024.
Watch Acquisition spending, deal costs and any goodwill write-down.
- Debt
Rising debt
Total debt was $6,991.1 million on Sep 30, 2026, against $4,162.4 million at Dec 31, 2024, after bond sales in August 2025 ($1.50 billion) and August 2026 ($2.00 billion).
Watch Net debt and credit ratings each quarter.
09Supporters vs. critics
What do supporters and critics point to?
What supporters point to
- Revenue rose every year, from $12,980.2 million in FY2021 to $28,479.7 million in FY2025.
- Backlog was $63,731.7 million on Sep 30, 2026, against $39,174.0 million a year earlier.
- Q3 FY2026 net income was $694.9 million, against $339.4 million in Q3 FY2025.
- Operating cash flow minus capital spending (Cityfort calculation from the 10-Ks) rose from $196.5 million in FY2021 to $1,620.8 million in FY2025.
- S&P raised its rating to BBB in March 2025 and Moody’s raised its notes rating to Baa2 in June 2026, as the company’s earnings releases state.
What critics point to
- Net income was $3.61 of each $100 of revenue in FY2025, against $3.74 in FY2021.
- Fixed-price work, where the company bears cost overruns, rose from 49.1% of revenue in FY2023 to 68.1% in Q3 FY2026.
- Total debt rose from $4,162.4 million at Dec 31, 2024 to $6,991.1 million on Sep 30, 2026.
- Reported growth includes bought businesses: eight in FY2025 and five in the first nine months of 2026. Goodwill reached $8,081.6 million on Sep 30, 2026.
- The ten largest customers were 30% of FY2025 revenue, and the 10-K says many of its contracts may be canceled or suspended on short notice.
10What to watch next
What should you watch next at Quanta Services?
Next event
Q4 FY2026 results
Date not announced yet.
Backlog against contracted work
Backlog was $63,731.7 million on Sep 30, 2026, while remaining performance obligationsSigned contracts with customers that have not been billed yet., the contracted amount, were $41,753.0 million. The FY2026 10-K will give the Dec 31, 2026 figures.
Fixed-price share and margins
Fixed-price work was 68.1% of Q3 FY2026 revenue. Electric operating income was 12.6% of segment revenue in Q3 FY2026, against 11.4% a year earlier.
Debt and acquisitions
Total debt was $6,991.1 million on Sep 30, 2026, after a $2.0 billion bond sale in August 2026. Quanta Services bought five businesses in the first nine months of 2026.
The FY2026 outlook
In its Oct 29, 2026 earnings release, Quanta Services raised its FY2026 outlook to revenue of $41.3 billion to $41.6 billion. The Q4 FY2026 release will show the full-year result.
11Key facts
Key facts about Quanta Services
- What does Quanta Services do?
- Quanta Services is a Houston contractor that designs, builds, repairs and maintains power lines, substations, power plants, data center electrical systems, communications networks and pipelines in the United States, Canada and Australia.
- How does Quanta Services make money?
- Quanta Services is paid for the work its crews do, and fixed-price contracts were 60.6% of its FY2025 revenue. In FY2025 Quanta Services had operating income of $1,611.5 million and kept $3.61 of each $100 of revenue as net income.
- Who are Quanta Services’ customers?
- Quanta Services’ customers are electric and gas utilities, power developers, technology and industrial companies, and communications and pipeline companies. In FY2025 its largest customer was 8% of revenue and its ten largest were 30%.
- How big is Quanta Services?
- Quanta Services had FY2025 revenue of $28,479.7 million and net income of $1,028.4 million. Its Q3 FY2026 revenue was $12,014.9 million, against $7,631.4 million in Q3 FY2025, including businesses it bought.
- Where does Quanta Services earn its revenue?
- In FY2025 Quanta Services’ Electric segment was 80.8% of revenue and its Underground and Infrastructure segment 19.2%. The United States was 93% of its FY2025 revenue.
- What is Quanta Services’ backlog?
- Quanta Services reported backlog of $63,731.7 million on Sep 30, 2026, against $39,174.0 million a year earlier. Backlog is the company’s own measure and includes estimated work under master service agreements; contracted remaining performance obligations were $41,753.0 million.
- How much debt does Quanta Services have?
- Quanta Services had total debt of $6,991.1 million and cash of $2,315.3 million on Sep 30, 2026, according to its Q3 FY2026 10-Q.
- Who owns Quanta Services?
- Quanta Services has one class of stock. Its 2026 proxy statementThe yearly filing about shareholder votes, the board and executive pay. Learn more lists The Vanguard Group with 12.1% (holdings as of Sep 30, 2025; Vanguard said on Mar 27, 2026 that it no longer counts its subsidiaries’ shares), BlackRock with 7.4% (as of Dec 31, 2023) and JPMorgan Chase with 5.1% (as of Sep 30, 2024); directors and executive officers as a group held 0.63% on Mar 26, 2026.
Terms on this page
- Backlog
- Capital expenditures (capex)
- Customer concentration
- Debt-to-equity
- Earnings per share (EPS)
- EBITDA
- Free cash flow
- Net debt
- Net margin
- Remaining performance obligations (RPO)
Each explains the term in plain English, with the same number from other companies on Cityfort.
Go deeper
More detail from the same filings. Open any section.
12What it sells
12What it sells
What does Quanta Services sell?
Electric grid work
Building and upgrading power lines and substations for utilities, including live-wire work and repairs after storms and fires.
Power plant construction
Engineering, buying equipment for and building wind, solar, hydropower, gas power and battery storage sites.
Large load centers
Electrical, mechanical and plumbing systems for big power users such as data centers, advanced factories and hospitals.
Communications networks
Building wired and wireless networks for phone, cable and technology companies.
Underground utility and pipeline work
Gas utility systems, pipelines, water and storage systems and work at downstream industrial plants.
Equipment it makes
Power transformers and other critical grid and power plant parts from its own plants, plus a stake in a wood utility pole maker.
What it does
- Does: Builds and repairs the lines, substations and pipes that utilities own.
- Does: Sends crews to restore power after storms and wildfires.
- Does: Wires and fits out data centers and factories.
- Does: Owns 50% of LUMA Energy, which operates Puerto Rico’s electric grid.
What it does not do
- Does not: Does not sell electricity or gas to homes; its customers are the utilities and companies that do.
- Does not: Does not own the power lines it builds for utility customers.
- Does not: Does not get guaranteed volumes: most customers can end contracts on short notice.
Sources (1)
13How the money flows
13How the money flows · FY2025
How does money flow through Quanta Services?
Money in
- Revenue$28.5B
- Affiliate earnings, interest and other income$95.1M
The company
Quanta Services
$28.6B came in
Money out
- Cost of services (crews, equipment, materials)$24.2B
- Selling, general and administrative$2.2B
- Amortization of acquired intangibles$499M
- Interest and financing costs$261M
- Income tax$348M
- Earn-out revaluation and minority partners’ share$44.7M
- Net income attributable to common stock$1.0B
- Customers paid Quanta Services $28,479.7 million in FY2025, and joint ventures, interest and other items added $95.1 million.
- Doing the work cost $24,204.6 million: crews’ wages, equipment, materials and subcontractors.
- Running the company took $2,189.2 million, and $498.8 million was amortization, the yearly charge for customer lists and other intangibles bought with acquired businesses.
- Interest took $261.4 million and income tax $347.6 million. A $31.2 million rise in the value of earn-outs (extra payments to sellers of bought businesses, tied to how those businesses perform) and $13.5 million for minority partners took the rest.
- That left $1,028.4 million of net income for common stockholders.
Sources (1)
14What it needs to run
14What it needs to run
What does Quanta Services need to run?
Skilled crews
About 69,500 employees at Dec 31, 2025, of whom about 55,700 were hourly workers; about 36% were covered by union contracts.
Training
Quanta Services runs its own training center in Texas and a school for line workers, alongside union apprenticeship programs.
Trucks, cranes and aircraft
Property and equipment was $3,455.2 million (after depreciation) at Dec 31, 2025; FY2025 equipment spending was $609.2 million.
Grid parts
It makes some power transformers and other parts itself, which the 10-K says can ease customers’ supply shortages.
Permits and approvals
Projects often wait for regulatory approvals, permits and rights of way before work starts.
Sources (1)
15Where it sells
15Where it sells · FY2025
Where does Quanta Services sell?
- United States93%
- Canada3.6%
- Australia2.7%
- Other0.7%
Sources (1)
16Where growth could come from
16Where growth could come from
Where could Quanta Services' growth come from?
In its Oct 29, 2026 earnings release, Quanta Services raised its FY2026 outlook to revenue of $41.3 billion to $41.6 billion, net income attributable to common stock of $1.92 billion to $1.98 billion and diluted EPS of $12.57 to $12.97. CEO Duke Austin said the company was “pacing ahead of the multi-year growth targets” set at its 2026 Investor Day.
Backlog
Working$63,731.7M on Sep 30, 2026, vs $39,174.0M a year earlier
Backlog is the company’s own estimate of revenue from work it has been awarded. It also counts the company’s estimate of work under master service agreements, so it is larger than remaining performance obligations (RPO), the contracted amount under accounting rules ($41,753.0 million).
Status: Working, on track against what the company said.
Electric segment
WorkingQ3 FY2026 revenue $9,799.8M, vs $6,172.0M in Q3 FY2025
Electric operating income was $1,238.1 million in Q3 FY2026, or 12.6% of segment revenue, against 11.4% a year earlier.
Status: Working, on track against what the company said.
Buying other contractors
WorkingFive businesses bought in the first nine months of 2026, eight in FY2025
The 2026 deals cost about $1.29 billion in cash plus shares valued at $299.6 million, and include Phalcon, Enerfab, Percheron and PSD. Reported growth includes these businesses.
Status: Working, on track against what the company said.
Investor Day target
EarlyAdjusted EPS $12.98 in the first nine months of 2026, vs $7.59 a year earlier
At its March 2026 Investor Day the company set a target of more than doubling adjusted EPS by 2030, CEO Duke Austin said on Apr 30, 2026. Adjusted EPS is a non-GAAPThe company's own "adjusted" numbers, not the official (GAAP) ones. Always read them next to the official figure. Learn more measure.
Status: Early, too early to judge.
Status compares progress with what the company itself said it would do: Working = on track against what the company said; Mixed = partly on track; Behind = behind the company's own plan; New = recently announced; Early = too early to judge.
17The company's own measures (non-GAAP)
17The company's own measures · FY2025 and Q3 FY2026, unless the row says otherwise
What do Quanta Services' own measures show?
Official (GAAP): Net income attributable to common stock, FY2025
$1.0B
Company's own measure: Adjusted EBITDA, FY2025
$2.9B
Adds back interest, tax, depreciation, amortization, stock-based payPay given as shares instead of cash, which spreads ownership more thinly. Learn more ($181.9 million), deal and integration costs ($94.1 million) and changes in the value of earn-outs owed to sellers of bought businesses.
Official (GAAP): Operating income, FY2025
$1.6B
Company's own measure: EBITDA (company definition), FY2025
$2.6B
Starts from net income and also adds Quanta Services’ share of joint ventures’ interest, tax and depreciation, so it differs from the $2,521.8 million EBITDAOperating profit before wear-and-tear charges (depreciation and amortization). As a margin: per $100 of sales. in “The numbers” (operating income plus depreciation and amortization).
Official (GAAP): Diluted EPS, FY2025
$6.80
Company's own measure: Adjusted diluted EPS, FY2025
$10.75
Leaves out amortization of acquired intangibles, stock-based pay, deal costs and other items, after tax.
Official (GAAP): Diluted EPS, Q3 FY2026
$4.55
Company's own measure: Adjusted diluted EPS, Q3 FY2026
$6.06
Same definition as the full year; Q3 FY2025 was $3.33 adjusted and $2.24 GAAP.
Official (GAAP): Operating cash flow, FY2025
$2.2B
Company's own measure: Free cash flow (company definition), FY2025
$1.7B
The company deducts net capital spending ($557.2 million, after equipment sale proceeds). The free cash flowCash from operations minus spending on buildings and equipment. Learn more in “The numbers” deducts gross spending of $609.2 million and is $1,620.8 million.
Official (GAAP): Remaining performance obligations, Sep 30, 2026
$41.8B
Company's own measure: Backlog, Sep 30, 2026
$63.7B
Backlog adds estimated work under master service agreements and short-term orders to RPO. Customers are not committed to those volumes.
These are the company's own measures, defined by the company. They are not comparable across companies, and they are not added together. Each sits beside the nearest official (GAAP) figure.
Learn: Non-GAAP measures: what a company's "adjusted" numbers leave out · Stock-based compensation and dilution: pay that becomes shares
18Financial strength and debt
18Financial strength · Sep 30, 2026
How much debt does Quanta Services have?
- Total debt$7.0B
- Cash and investments$2.3B
- Net debt (debt minus cash)$4.7B
- Net worth (shareholders' money)$10.6B
- Debt to equity
- 0.66×
- $ of debt for every $1 of shareholders' money
- Net debt = total debt of $6,991.1 million minus cash of $2,315.3 million (Cityfort calculation from the Q3 FY2026 10-Q). It was $5,555.4 million on Dec 31, 2025 (Cityfort calculation from the FY2025 10-K). Lease obligations not counted as debt are left out.
- In August 2026 Quanta Services sold $2.0 billion of new bonds due 2029, 2033 and 2036, and on Sep 1, 2026 it repaid its $618.8 million term loan early.
- It had no commercial paper (short-term company IOUs) outstanding on Sep 30, 2026, against $316.0 million at Dec 31, 2025.
- Net worth is total equity of $10,621.8 million, which includes $86.2 million owned by minority partners; debt to equity is total debt ÷ total equity (Cityfort calculation from the Q3 FY2026 10-Q).
19Who owns it
19Who owns it · ownership as of Mar 26, 2026
Who owns Quanta Services?
- Officers and directors (as a group), shares
- 0.6%
Share classes
Holders of 5% or more
From the company's proxy statement (DEF 14A), later Schedule 13G filings and the share counts on its latest annual or quarterly report. Each holder row shows the date of its own filing.
Learn: How to read a proxy statement (DEF 14A): Nvidia's 2026 proxy · Form 4 insider filings: who files, the codes and the footnotes
20What it does with profit
20What it does with profit
What does Quanta Services do with its profit?
Dividend per share
$0.41FY2025
Dividend paid for each share, by financial year.
$ per share
See the numbers
No buybacks or fund raises in the period covered.
Sources (1)
21Governance signals
21Governance signals
What do Quanta Services' governance filings show?
- Auditor
- PricewaterhouseCoopers LLP, since 2002
- Auditor changes
- None in the period covered
- Audit qualifications
- None reported
- Related-party dealings
- Quanta Services owns 50% of LUMA Energy, the joint venture that operates Puerto Rico’s electric grid, and provides services to LUMA at cost, according to the Q3 FY2026 10-Q. The 2026 proxy statement lists other related-person dealings in 2025: the company paid $516,960 in rent to an entity owned by CEO Duke Austin and $174,240 to Mr. Austin himself, paid rent to entities part-owned by Electric Power president Karl Studer (Three String $1,097,143; Kilo & Echo $874,686), and employed members of Mr. Austin’s family.
- Credit rating
- S&P Global Ratings and Moody’s (as stated in Quanta Services’ earnings releases) BBB issuer credit rating (S&P, raised from BBB- in March 2025) / Baa2 senior unsecured notes (Moody’s, raised from Baa3 in June 2026) (outlook Not stated in the filings), Jul 30, 2026
A credit rating describes the company's ability to repay debt. It is not a rating of the share.
22How it got here
22How it got here
How did Quanta Services get here?
2013
Milestone
Bought Probst Electric and Summit Line
Karl Studer, now President of Electric Power, co-founded both electric contractors.
2016
Milestone
Duke Austin became CEO
He has led the company since March 2016.
2024
Business-model change
Bought Cupertino Electric
An electrical contractor for technology, renewable and commercial sites, for total consideration of $2,035.2 million.
2025
Milestone
Two segments instead of three
From Q1 2025 the old Electric Power and Renewable Energy segments were reported together as Electric.
2025
Business-model change
Bought Dynamic Systems
A mechanical, plumbing and process contractor for technology, chip and health care sites, for $1,673.3 million; seven other deals cost $2,471.1 million.
2026
Milestone
Investor Day target
In March 2026 the company set a target of more than doubling adjusted EPS by 2030.
2026
Milestone
$2.0 billion bond sale
Sold notes due 2029, 2033 and 2036 in August 2026 and repaid its term loan early.
23Sources and changes
Where every number on this page comes from
Sources (23 documents)
- S1Form 10-Q for Q3 FY2026 · SEC EDGAR · Tier 1: company or exchange filing · Oct 29, 2026
- S2Form 10-Q for Q2 FY2026 · SEC EDGAR · Tier 1: company or exchange filing · Jul 30, 2026
- S3Form 10-Q for Q1 FY2026 · SEC EDGAR · Tier 1: company or exchange filing · Apr 30, 2026
- S4Form 10-K for FY2025 · SEC EDGAR · Tier 1: company or exchange filing · Feb 19, 2026
- S5Form 10-Q for Q3 FY2025 · SEC EDGAR · Tier 1: company or exchange filing · Oct 30, 2025
- S6Form 10-Q for Q2 FY2025 · SEC EDGAR · Tier 1: company or exchange filing · Jul 31, 2025
- S7Form 10-Q for Q1 FY2025 · SEC EDGAR · Tier 1: company or exchange filing · May 1, 2025
- S8Form 10-K for FY2024 · SEC EDGAR · Tier 1: company or exchange filing · Feb 20, 2025
- S9Form 10-Q for Q3 FY2024 · SEC EDGAR · Tier 1: company or exchange filing · Oct 31, 2024
- S10Form 10-Q for Q2 FY2024 · SEC EDGAR · Tier 1: company or exchange filing · Aug 1, 2024
- S11Form 10-Q for Q1 FY2024 · SEC EDGAR · Tier 1: company or exchange filing · May 2, 2024
- S12Form 10-K for FY2023 · SEC EDGAR · Tier 1: company or exchange filing · Feb 22, 2024
- S13Form 10-K for FY2022 · SEC EDGAR · Tier 1: company or exchange filing · Feb 23, 2023
- S14Form 10-K for FY2021 · SEC EDGAR · Tier 1: company or exchange filing · Feb 25, 2022
- S15Proxy statement (DEF 14A) for the 2026 annual meeting · SEC EDGAR · Tier 1: company or exchange filing · Apr 10, 2026
- S16Q3 FY2026 earnings release (8-K, Exhibit 99.1) · SEC EDGAR · Tier 1: company or exchange filing · Oct 29, 2026
- S17Q2 FY2026 earnings release (8-K, Exhibit 99.1) · SEC EDGAR · Tier 1: company or exchange filing · Jul 30, 2026
- S18Q1 FY2026 earnings release (8-K, Exhibit 99.1) · SEC EDGAR · Tier 1: company or exchange filing · Apr 30, 2026
- S19Q4 FY2025 earnings release (8-K, Exhibit 99.1) · SEC EDGAR · Tier 1: company or exchange filing · Feb 19, 2026
- S20Q3 FY2025 earnings release (8-K, Exhibit 99.1) · SEC EDGAR · Tier 1: company or exchange filing · Oct 30, 2025
- S21Q2 FY2025 earnings release (8-K, Exhibit 99.1) · SEC EDGAR · Tier 1: company or exchange filing · Jul 31, 2025
- S22Q1 FY2025 earnings release (8-K, Exhibit 99.1) · SEC EDGAR · Tier 1: company or exchange filing · May 1, 2025
- S23Q4 FY2024 earnings release (8-K, Exhibit 99.1) · SEC EDGAR · Tier 1: company or exchange filing · Feb 20, 2025
Changes to this page (v1 · Nov 20, 2026)
- v1 · Nov 20, 2026First version. (first version)
Numbers come only from tier 1 and tier 2 sources. Read how we research.
Disclaimer
For learning only. Cityfort is not a registered investment adviser or broker-dealer and does not recommend buying or selling any security. Prices shown are dated and may be out of date.
Investing in securities involves risk, including loss of capital. Before making any investment decision, do your own research and consider consulting a registered investment adviser or other qualified professional.
Cityfort, its owners and contributors may or may not hold securities of companies covered. Cityfort is not paid by any company it covers. Content is not an offer or solicitation to buy or sell any security, including in any initial public offering.
Read the positions policyRead the full disclaimerHide the full disclaimer
Cityfort publishes general educational content that explains how listed companies work. Cityfort is not registered with the US Securities and Exchange Commission or any state securities regulator as an investment adviser, and is not a broker-dealer or a member of FINRA. Cityfort does not provide investment, tax or legal advice, recommendations, ratings, price targets or any opinion on whether to buy, sell or hold any security. Nothing on the site is tailored to any person's circumstances.
All information is taken from publicly available sources, mainly company filings with the SEC, which are listed on each page with dates. We work to keep it accurate and correct errors publicly, but we do not guarantee that it is complete, accurate or up to date. Any market price or price-based ratio shown is dated, may be out of date by the time you read it, and is included only to explain concepts.
Statements by company management, including forward-looking statements and guidance, are reported as the company's statements, with their date and source; they are not our forecasts. Adjusted (non-GAAP) figures are the company's own measures and are shown next to the official (GAAP) figures.