Industrials · NASDAQ: PCAR
PACCAR: how the business works
PACCAR builds Kenworth, Peterbilt and DAF trucks, but in FY2025 its parts business made more pre-tax profit than its trucks, on $28.4 billion of revenue.
By Hardik Bhandare · Checked against filings: . Editorial policy. Corrections
Follow PACCAR
Email me when PACCAR's page is updated after earnings.
We'll send a confirmation email first. See our privacy policy.
PACCAR Inc · Bellevue, Washington · Founded 1905
Updated for Q3 FY2026 · checked
- Revenue, FY2025
- $28.4B
- Net income, FY2025
- $2.38B
- Trucks delivered, FY2025
- 144,200
- Employees, Dec 31, 2025
- About 25,900
- Roots go back to
- 1905
The short version
PACCAR in 5 points
1 · What it sells
PACCAR builds Kenworth, Peterbilt and DAF medium and heavy trucks, sells replacement parts and lends to truck buyers, with revenue of $28,444.8 million in FY2025.
2 · Who pays it
In FY2025, independent dealers buying trucks paid 68.1% of PACCAR's revenue, buyers of parts 24.2% and truck buyers borrowing or leasing from PACCAR Financial 7.8%.
3 · What it keeps from $100
Of every $100 that came in during FY2025, PACCAR kept $8.25 as net income, after a $350.0 million pre-tax charge for EC-related claims; PACCAR reports no operating income line.
4 · Where the operating profit comes from
In FY2025, Parts earned $1,668.0 million of pre-tax profit, Truck $870.8 million and Financial Services $485.4 million.
5 · The one thing to watch
PACCAR delivered 40,100 trucks in Q3 FY2026, up from 31,900 a year earlier, but 111,900 in the first nine months of 2026 against 111,300 in 2025.
Sources: From PACCAR's FY2025 10-K and the Q3 FY2026 earnings release · checked
01Where the money goes · FY2025
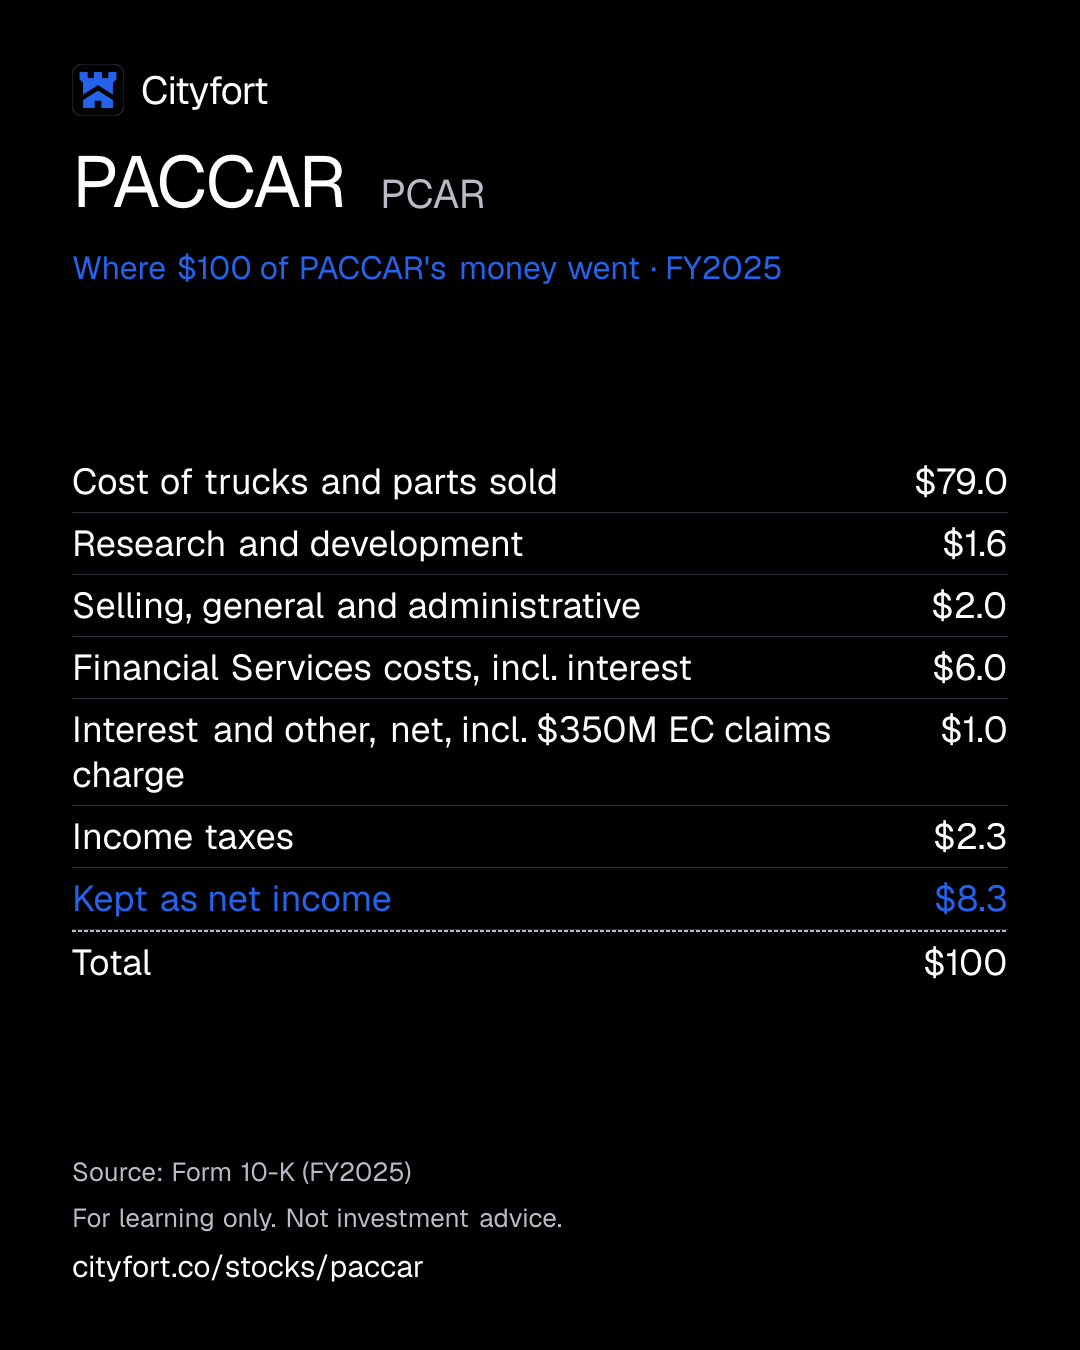
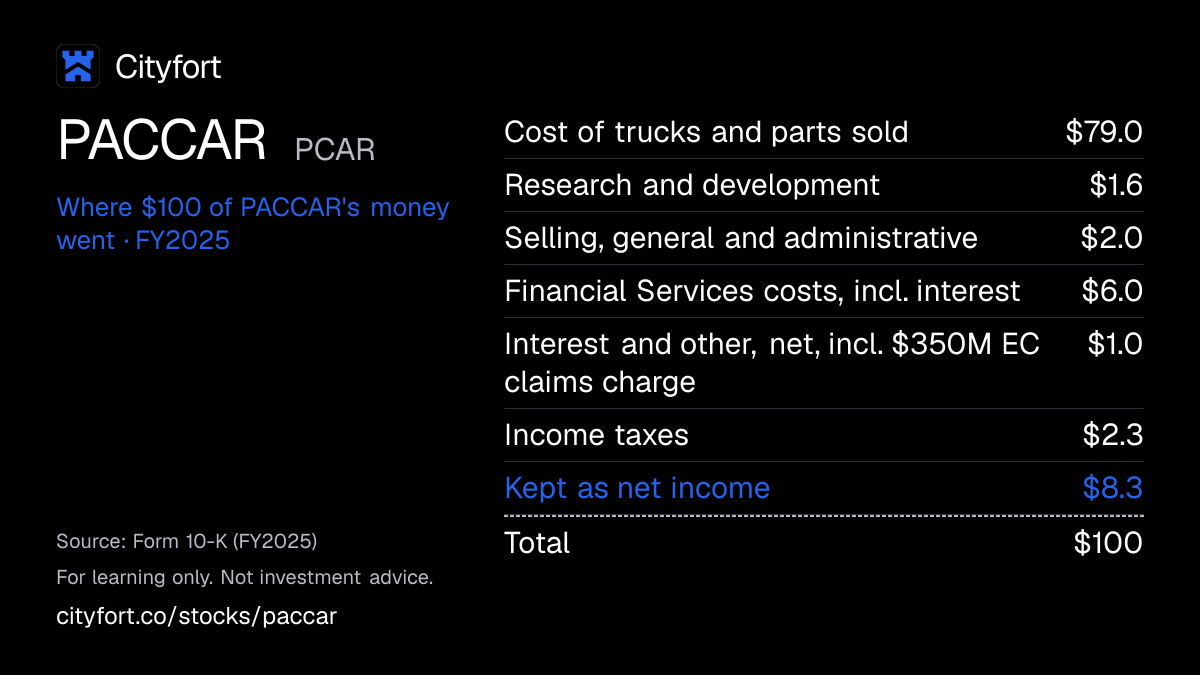
Where does $100 of PACCAR's money go?
PACCAR · FY2025
Receipt for every $100
| Cost of trucks and parts sold | $79.0 |
|---|---|
| Research and development | $1.6 |
| Selling, general and administrative | $2.0 |
| Financial Services costs, incl. interest | $6.0 |
| Interest and other, net, incl. $350M EC claims charge | $1.0 |
| Income taxes | $2.3 |
| Kept as net income | $8.3 |
| Total | $100 |
Each line = amount ÷ total money in × 100. Lines may not add to exactly $100 because of rounding.
How this is worked out
Cityfort calculation from FY2025 10-K. Of every $100 that came in during FY2025: each line = line ÷ $28,790.9 million of total money in (revenue plus $346.1 million of investment income) × 100. Financial Services costs are its $2,209.7 million of revenue minus its $485.4 million of pre-tax income.
Save this receipt as an image
Embed this receipt or the key numbers
Paste this code into a blog or website to show the card you choose, with a link back to this page.
Each week: the next company due to report earnings, explained in 5 points.
No tips. Unsubscribe anytime.
We'll send a confirmation email. See our privacy policy.
02The business in one line
What does PACCAR do?
Independent dealers pay PACCAR for trucks and parts, and truck buyers pay its finance arm interest; most of that money goes to building the trucks.
- Truck sales were 68.1% of FY2025 revenue, parts 24.2% and truck loans and leases 7.8%.
- Building trucks and parts cost $78.97 of every $100 that came in during FY2025; PACCAR kept $8.25 as net income.
03Who pays it
Who pays PACCAR?
Independent truck dealers
68.1%
of revenue
Buy substantially all Kenworth, Peterbilt and DAF trucks. Truck revenue was $19.37 billion in FY2025.
Dealers and TRP stores buying parts
24.2%
of revenue
Buy replacement parts for trucks already on the road. Parts revenue was $6.87 billion in FY2025.
Truck buyers who borrow or lease from PACCAR
7.8%
of revenue
Pay interest, lease and rental fees to PACCAR Financial Services. Its revenue was $2.21 billion in FY2025.
- Independent truck dealers68.1%
- Dealers and TRP stores buying parts24.2%
- Truck buyers who borrow or lease from PACCAR7.8%
How spread out the customers are
PACCAR says it is not dependent on any single customer, and no customer or dealer is over 5% of its finance portfolio. Shares above are of $28,444.8 million of FY2025 revenue (Cityfort calculation from FY2025 10-K).
Sources (1)
04How it makes money
How does PACCAR make money?
Truck profit rises and falls with the freight cycle; parts and finance change less.
Truck revenue fell from $26.8 billion in FY2023 to $19.4 billion in FY2025. Parts revenue grew every year from FY2021 to FY2025, reaching $6.87 billion. The 10-K says truck sales and margins "tend to be cyclical".
Truck segment pre-tax profit per $100 of truck revenue
$14.2$4.5
FY2023 to FY2025
- Freight volumes and rates shape how many trucks fleets buy.
- PACCAR builds trucks to dealer orders in its own factories.
- Truck pre-tax profit per $100 of truck revenue was $14.2 in FY2023 and $4.5 in FY2025.
- Trucks on the road need parts for years: Parts earned $24.3 per $100 in FY2025.
- PACCAR Financial financed 27.0% of new PACCAR trucks in FY2025, earning interest.
↺ Step 5 feeds back into step 1.
Sources (1)
05Business segments · FY2025
Which businesses make up PACCAR?
Truck
68.1%Kenworth, Peterbilt and DAF trucks. Pre-tax profit was $870.8 million in FY2025, down from $3,799.9 million in FY2023. Shares are of $28,444.8 million of total revenue (Cityfort calculation from FY2025 10-K).
Revenue $19.4B ($19,365M)
Parts
24.2%Replacement parts for trucks. Pre-tax profit was $1,668.0 million in FY2025, more than the Truck segment earned.
Revenue $6.9B ($6,874M)
Financial Services
7.8%Truck loans, leases and rentals. Pre-tax profit was $485.4 million in FY2025, up from $435.6 million in FY2024.
Revenue $2.2B ($2,210M)
How the mix changed
- Truck
- Parts
- Financial Services
Revenue by segment, FY2021 to FY2025.
US$
See the numbers
06The numbers · Consolidated · US$
How has PACCAR done?
Revenue
$28.4BFY2025
Revenue rose from $23.5 billion in FY2021 to $35.1 billion in FY2023, then fell to $28.4 billion in FY2025, when truck deliveries were 144,200 against 204,200 in FY2023.
US$
See the numbers
Net income
$2.4BFY2025
Net income peaked at $4.60 billion in FY2023 and was $2.38 billion in FY2025, which included a $264.5 million after-tax charge for EC-related civil claims.
US$
See the numbers
Net income for every $100 of revenue
$8.4FY2025
Net income was 8.4% of revenue in FY2025, down from 13.1% in FY2023 and 12.4% in FY2024.
Net margin: $ of net income per $100 of revenue
See the numbers
Free cash flow
$3.7BFY2025
Free cash flow (operating cash minus spending on plants and equipment) was $3.67 billion in FY2025, down from $3.80 billion in FY2024 and up from $1.63 billion in FY2021.
US$ · cash from operations minus spending on plants and equipment
See the numbers
See all yearly numbers
EBITDA here = operating income plus depreciation and amortization (from the cash flow statement). Fiscal years are the company's own: Fiscal year ends Dec 31 (the calendar year). Net income is the share belonging to the company's owners.
Learn: Fiscal years that don't end in December: Nvidia's FY2027 explained · Stock-based compensation and dilution: pay that becomes shares
Sources (16)
- Form 10-K for FY2021
- Form 10-K for FY2023
- Form 10-K for FY2022
- Form 10-K for FY2024
- Form 10-K for FY2025
- Form 10-Q for Q1 FY2024
- Form 10-Q for Q2 FY2024
- Form 10-Q for Q3 FY2024
- Earnings release for Q4 FY2024 (Form 8-K, Exhibit 99.1)
- Form 10-Q for Q1 FY2025
- Form 10-Q for Q2 FY2025
- Form 10-Q for Q3 FY2025
- Earnings release for Q4 FY2025 (Form 8-K, Exhibit 99.1)
- Form 10-Q for Q1 FY2026
- Form 10-Q for Q2 FY2026
- Form 10-Q for Q3 FY2026
07Who runs it
Who runs PACCAR, and did they deliver?
R. Preston Feight
Chief Executive Officer · since 2019
CEO since July 2019.
Mark C. Pigott
Executive Chairman · since 2014
Chairman and CEO from January 1997 to April 2014. His brother John M. Pigott is a director.
Brice J. Poplawski
Senior Vice President and Chief Financial Officer · since 2025
CFO since June 2025; vice president and controller from May 2023.
John Rich
Executive Vice President and Chief Technology Officer
Gives the truck market estimates in the Oct 27, 2026 earnings release.
Mark A. Schulz
Lead Independent Director
The board has 12 director nominees in 2026, 75% of them independent under Nasdaq rules.
What they said, and what happened
3 too early to tell
Said on Feb 18, 2026
The FY2025 10-K gave 2026 capital spending of $725 million to $775 million and R&D of $450 million to $500 million.
Too early to tellWhat happened
On Oct 27, 2026 the CFO gave new 2026 ranges: $650 million to $700 million for capital spending and $440 million to $460 million for R&D. Full-year figures come with the FY2026 10-K.
Said on Feb 18, 2026
The FY2025 10-K said 2026 parts sales were expected to increase 4% to 8% compared with 2025.
Too early to tellWhat happened
The Q3 FY2026 10-Q (Oct 28, 2026) said 2026 parts sales were expected to increase around 3% compared with 2025. Parts segment revenue was $5,237.0 million in the first nine months of 2026, against $5,135.4 million a year earlier, according to the same 10-Q.
Said on Oct 27, 2026
The Oct 27, 2026 release said PACCAR Connect will be available on Kenworth and Peterbilt trucks in early 2027.
Too early to tellWhat happened
Not yet reported.
08What could go wrong
What could go wrong for PACCAR?
- Demand
Truck demand swings with freight
The 10-K says Truck segment sales and margins tend to be cyclical, following overall economic activity, the availability of capital and the amount of freight being transported. Deliveries fell from 204,200 in FY2023 to 144,200 in FY2025.
Watch Quarterly truck deliveries and PACCAR's Class 8 market estimates in each earnings release.
- Legal
European truck claims
According to the FY2025 10-K, the European Commission (EC) concluded its investigation of all major European truck makers in 2016 and reached a settlement with PACCAR and DAF. The 10-K says EC-related claims and lawsuits were then filed against the company, including class actions in the UK, the Netherlands and Israel. PACCAR took pre-tax charges of $600.0 million in Q1 FY2023 and $350.0 million in Q1 FY2025. The company says it has settled with a significant majority of claimants and believes it has meritorious defenses to all pending claims.
Watch Any further EC-related charge in the 10-Q legal note.
- Regulation
Tariffs on trucks and parts
U.S. Section 232 tariffs on trucks began in November 2025. PACCAR says building trucks locally for the U.S., Canada and Mexico keeps its exposure low.
Watch Truck gross margin and cost per truck in the 10-Q.
- Debt
Lending and funding risk in PACCAR Financial
PACCAR Financial had $14.96 billion of borrowings at Sep 30, 2026, and $8.29 billion of debt was due within a year of Dec 31, 2025. Its provision for loan losses rose from $0.5 million in FY2021 to $124.5 million in FY2025.
Watch The provision for losses and the A+/A1 credit ratings.
- Technology
Emissions rules and new powertrains
The 10-K lists the cost of meeting emissions rules and of developing battery-electric and hydrogen trucks as risks. PACCAR put $201.8 million into the Amplify battery venture in FY2025.
Watch R&D spending and Amplify contributions in the 10-K.
- Currency
Currency moves
PACCAR reports in U.S. dollars, but 45.8% of FY2025 revenue was booked outside the U.S., including 24.4% in Europe (Cityfort calculation from FY2025 10-K).
Watch Europe revenue in each earnings release.
09Supporters vs. critics
What do supporters and critics point to?
What supporters point to
- Parts revenue grew every year from FY2021 to FY2025, reaching $6.87 billion, and hit a record $1,780.0 million in Q3 FY2026.
- Parts earned $1,668.0 million of pre-tax profit in FY2025, more than the $870.8 million from trucks.
- On Sep 30, 2026, all borrowings sat in PACCAR Financial, and the truck and parts business held $9.24 billion of cash and marketable securities.
- PACCAR delivered 40,100 trucks in Q3 FY2026, up from 31,900, and truck gross margin was 10.2%, up from 5.8%.
- The 2026 proxy says PACCAR has paid annual dividends every year since 1941.
What critics point to
- Truck revenue fell from $26.8 billion in FY2023 to $19.4 billion in FY2025, and deliveries fell from 204,200 to 144,200.
- Net income fell from $4.60 billion in FY2023 to $2,375.8 million in FY2025.
- According to the FY2025 10-K, EC-related claims and lawsuits were filed against PACCAR, including class actions in the UK, the Netherlands and Israel. PACCAR took pre-tax charges of $600.0 million in Q1 FY2023 and $350.0 million in Q1 FY2025.
- PACCAR Financial's provision for loan losses rose from $0.5 million in FY2021 to $124.5 million in FY2025.
- Deliveries in the first nine months of 2026 were 111,900, against 111,300 a year earlier.
10What to watch next
What should you watch next at PACCAR?
Next event
Q4 FY2026 results
Date not announced yet.
Truck deliveries
PACCAR delivered 40,100 trucks in Q3 FY2026, up from 31,900, but 111,900 in the first nine months against 111,300. Its Oct 27, 2026 release put 2027 U.S. and Canada Class 8 retail sales at 240,000 to 280,000 trucks.
Parts growth against the 10-K range
The FY2025 10-K said 2026 parts sales were expected to increase 4% to 8% compared with 2025. The Q3 FY2026 10-Q (Oct 28, 2026) said 2026 parts sales were expected to increase around 3% compared with 2025. Parts segment revenue was $5,237.0 million in the first nine months of 2026, against $5,135.4 million a year earlier, according to the Q3 FY2026 10-Q.
EC-related claims
PACCAR took a $350.0 million pre-tax charge in Q1 FY2025. The 10-Q legal note shows whether any further charge is taken.
Loan losses at PACCAR Financial
The provision for loan losses was $124.5 million in FY2025, up from $0.5 million in FY2021. PACCAR Financial earned $138.1 million pre-tax in Q3 FY2026.
11Key facts
Key facts about PACCAR
- What does PACCAR do?
- PACCAR Inc, based in Bellevue, Washington, designs and builds medium and heavy trucks under the Kenworth, Peterbilt and DAF names. It also sells replacement parts and lends to truck buyers. PACCAR's FY2025 revenue was $28,444.8 million.
- How does PACCAR make money?
- PACCAR earned 68.1% of its FY2025 revenue from trucks, but its Parts segment made the most pre-tax profit in FY2025: $1,668.0 million, against $870.8 million for Truck and $485.4 million for Financial Services.
- Who are PACCAR's customers?
- PACCAR sells substantially all its Kenworth, Peterbilt and DAF trucks to independent dealers. In FY2025, 54.2% of PACCAR's revenue came from the United States, 24.4% from Europe and 21.3% from other countries.
- How big is PACCAR?
- PACCAR delivered 144,200 trucks in FY2025, down from 204,200 in FY2023, and had about 25,900 employees on Dec 31, 2025. Its FY2025 net income was $2,375.8 million.
- How much of each $100 does PACCAR keep?
- Of every $100 that came in during FY2025, PACCAR kept $8.25 as net income. The cost of trucks and parts sold took $78.97.
- How did PACCAR do in Q3 FY2026?
- PACCAR's revenue was $7,936.5 million in Q3 FY2026, up from $6,671.8 million in Q3 FY2025. Net income rose to $847.5 million from $590.0 million.
- Does PACCAR have debt?
- On Sep 30, 2026, all of PACCAR's $14.96 billion of borrowings sat in PACCAR Financial, which lends to truck buyers. PACCAR's truck and parts business held $9.24 billion of cash and marketable securities.
- Who owns PACCAR?
- PACCAR has one class of common stock, with 526,505,329 shares on Oct 23, 2026. PACCAR's directors and executive officers held 1.99% per the 2026 proxy. Vanguard reported 11.9% and BlackRock 7.0% in Schedule 13GA filing by anyone who owns more than 5% of a company's shares and does not seek control. Learn more filings from early 2024.
- Does PACCAR pay dividends?
- PACCAR declared $2.72 per share of dividends for FY2025, including a $1.40 year-end extra dividend. The 2026 proxy says PACCAR has paid annual dividends every year since 1941.
Terms on this page
- Capital expenditures (capex)
- Debt-to-equity
- Earnings per share (EPS)
- Free cash flow
- Net debt
- Net margin
- Revenue vs net income
Each explains the term in plain English, with the same number from other companies on Cityfort.
Go deeper
More detail from the same filings. Open any section.
12What it sells
12What it sells
What does PACCAR sell?
Kenworth and Peterbilt trucks
Long-nose ("conventional") trucks for North America and Australia, built in Ohio, Texas, Washington, Mexico and Canada. Heavy trucks here weigh over 33,000 lbs (Class 8).
DAF trucks
Flat-front trucks with the cab over the engine, built in the Netherlands, the UK and Brazil for Europe, South America and other markets.
PACCAR engines
Diesel engines made in Columbus, Mississippi; Eindhoven, the Netherlands; and Ponta Grossa, Brazil. They went into about 29% of Kenworth and Peterbilt heavy trucks in the U.S. and Canada in 2025.
PACCAR Parts
Aftermarket parts shipped from 21 distribution centers to over 2,000 dealer locations and over 350 TRP stores. TRP is its parts brand for all makes of truck.
PACCAR Financial Services
Loans, finance leases and truck rentals (PacLease) in 26 countries. At Sep 30, 2026 its portfolio covered 222,000 trucks and trailers.
Think of it like this
Like a car brand that also runs the spare-parts counter and the loan desk, except that independent dealers own the showrooms.
What it does
- Does: Sells substantially all its trucks to independent dealers
- Does: Dealers order most of its trucks to customer specifications, the 10-K says
- Does: Earns interest and lease income from truck buyers through its own finance arm
What it does not do
- Does not: Make all its engines: the ones it does not build come from Cummins
- Does not: Make its own transmissions: it buys a large share from Eaton and ZF
- Does not: Build the cabs for DAF's European light and medium trucks: Renault V.I. supplies them
13How the money flows
13How the money flows · FY2025
How does money flow through PACCAR?
Money in
- Truck, parts and other sales$26.2B
- Financial Services revenue$2.2B
- Investment income$346M
The company
PACCAR
$28.8B came in
Money out
- Cost of trucks and parts sold$22.7B
- Research and development$446M
- Selling, general and administrative$577M
- Financial Services costs, incl. interest$1.7B
- Interest and other, net, incl. $350M EC claims charge$284M
- Income taxes$648M
- Net income$2.4B
- In FY2025 PACCAR took in $26.24 billion from trucks and parts, $2.21 billion from its finance arm and $346 million of investment income.
- Building trucks and buying parts to resell cost $22.74 billion, the largest cost by far.
- Engineering took $446 million, and selling and office costs took $577 million.
- The finance arm's costs were $1.72 billion, including $783 million of interest on its borrowings and $125 million set aside for loan losses.
- Other costs of $284 million included a $350 million charge for EC-related civil claims; taxes took $648 million, leaving $2.38 billion of net income.
Sources (1)
14What it needs to run
14What it needs to run
What does PACCAR need to run?
Steel, copper, aluminum and fuel
The 10-K says truck costs are mainly materials, whose prices follow these commodities. PACCAR uses long-term supply deals and some hedging.
Bought-in components
Engines from Cummins, transmissions from Eaton and ZF, and North American cab stampings from Magna, under long-term agreements.
Factories and people
Truck plants in the U.S. (3), Europe (3), Australia, Brazil, Canada and Mexico, and about 25,900 employees at Dec 31, 2025, about 40% of them in the U.S.
Borrowed money for lending
PACCAR Financial borrows through commercial paper, bank loans and term notes to fund its loans. It owed $14.96 billion at Sep 30, 2026.
Sources (2)
15Where it sells
15Where it sells · FY2025
Where does PACCAR sell?
- United States54.2%
- Europe24.4%
- Other countries21.3%
Sources (1)
16Competitors and what protects it
16Competitors and what protects it
Who does PACCAR compete with?
Renault V.I.
The 10-K calls Renault V.I. a competitor. It also supplies the fully built cabs for DAF's European light and medium trucks, which made about 2% of PACCAR's FY2025 revenue.
What protects the business
Each strength is scored 1 (weak) to 5 (strong) for the business, with the reason. It is not a rating of the share.
- Truck brands and market share4 of 5
Kenworth and Peterbilt had 29.9% of U.S. and Canada Class 8 retail sales in 2025 (30.7% in 2024); DAF had 13.5% of Europe's heavy-truck market.
- Parts network4 of 5
Parts reach over 2,000 dealer locations and over 350 TRP stores from 21 distribution centers. Parts earned $24.3 of pre-tax profit per $100 of parts revenue in FY2025.
- Own finance arm3 of 5
PACCAR Financial financed 27.0% of new PACCAR trucks in FY2025, up from 25.0% in FY2024. The 10-K says it competes with banks that may borrow more cheaply.
- Own engines3 of 5
PACCAR engines went into about 29% of Kenworth and Peterbilt heavy trucks in the U.S. and Canada in 2025 and substantially all DAF heavy trucks.
Weak spot
Truck demand swings
Deliveries fell from 204,200 trucks in FY2023 to 144,200 in FY2025, and Truck pre-tax profit fell from $3,799.9 million to $870.8 million.
Sources (1)
17Where growth could come from
17Where growth could come from
Where could PACCAR's growth come from?
In its Oct 27, 2026 earnings release, PACCAR put 2026 U.S. and Canada Class 8 retail sales at 240,000 to 260,000 trucks and 2027 at 240,000 to 280,000. John Rich, executive vice president and chief technology officer, said, "We are experiencing a good year of truck demand in 2026 and we anticipate this to continue next year." CFO Brice Poplawski gave 2026 capital spending of $650 million to $700 million.
Parts
WorkingRecord $1.78B, Q3 FY2026
Parts revenue reached a record $1,780.0 million in Q3 FY2026, up from $1,724.6 million a year earlier. The Oct 27, 2026 release says PACCAR will add a parts distribution center in France.
Status: Working, on track against what the company said.
Truck deliveries (worldwide)
Mixed40,100 trucks, Q3 FY2026
PACCAR delivered 40,100 trucks worldwide in Q3 FY2026 against 31,900 a year earlier, but 111,900 in the first nine months against 111,300. Truck gross margin was 10.2% in Q3 FY2026, up from 5.8%.
Status: Mixed, partly on track.
Financial Services
Working$138.1M pre-tax, Q3 FY2026
Pre-tax profit was $138.1 million in Q3 FY2026, up from $126.2 million a year earlier. PACCAR Financial issued $2.38 billion of medium-term notes in the first nine months of 2026.
Status: Working, on track against what the company said.
Amplify Cell Technologies (batteries)
Early30% stake
A battery-cell joint venture with Cummins, Daimler Truck and EVE Energy, planning a 21 GWh plant in Marshall County, Mississippi. PACCAR put in $201.8 million in FY2025; the 10-K says the timing of investments is under review.
Status: Early, too early to judge.
PACCAR Connect
NewEarly 2027
The Oct 27, 2026 release says this platform for Kenworth and Peterbilt trucks will be available in early 2027.
Status: New, recently announced.
Status compares progress with what the company itself said it would do: Working = on track against what the company said; Mixed = partly on track; Behind = behind the company's own plan; New = recently announced; Early = too early to judge.
18The company's own measures (non-GAAP)
18The company's own measures · FY2025
What do PACCAR's own measures show?
Official (GAAP): Net income
$2.4B
Company's own measure: Adjusted net income
$2.6B
PACCAR's own measure leaves out the $264.5 million after-tax charge for EC-related civil claims recorded in Q1 FY2025. Per diluted share it was $5.01, against $4.51 under GAAP.
Official (GAAP): After-tax return on beginning equity
13.6%
Company's own measure: Adjusted after-tax return on beginning equity
15.1%
Net income as a share of equity at the start of the year, leaving out the same charge.
These are the company's own measures, defined by the company. They are not comparable across companies, and they are not added together. Each sits beside the nearest official (GAAP) figure.
Learn: Non-GAAP measures: what a company's "adjusted" numbers leave out
Sources (1)
19Financial strength and debt
19Financial strength · Sep 30, 2026
How much debt does PACCAR have?
- Total debt$15.0B
- Cash and investments$9.2B
- Net debt (debt minus cash)$5.7B
- Net worth (shareholders' money)$20.9B
- Debt to equity
- 0.71×
- $ of debt for every $1 of shareholders' money
- Borrowings of $14,959.1 million are PACCAR Financial's $4,559.1 million of commercial paper and bank loans plus $10,400.0 million of term notes (Cityfort calculation from the Q3 FY2026 10-Q). They were $15,636.3 million at Dec 31, 2025.
- Net debt of $5,720.9 million is those borrowings minus the truck and parts business's $9,238.2 million of cash and marketable securities (Cityfort calculation from the Q3 FY2026 10-Q). The borrowings fund $19,521.2 million of loans and finance leases owed by customers and dealers and $1,990.4 million of trucks leased out.
- Cash of $9,238.2 million is the truck and parts business's $5,990.2 million of cash plus $3,248.0 million of marketable securities (Cityfort calculation from the Q3 FY2026 10-Q). PACCAR Financial held another $161.5 million.
- Debt to equity of 0.71 uses stockholders' equity of $20,929.7 million (Cityfort calculation from the Q3 FY2026 10-Q). PACCAR had $4.00 billion of committed bank facilities.
- Interest cover is left blank: PACCAR Financial's $783.0 million of FY2025 interest is the cost of the money it lends, part of its running costs.
Sources (2)
20Who owns it
20Who owns it · ownership as of Dec 31, 2025
Who owns PACCAR?
- Officers and directors (as a group), shares
- 2.0%
Share classes
Holders of 5% or more
From the company's proxy statement (DEF 14A), later Schedule 13G filings and the share counts on its latest annual or quarterly report. Each holder row shows the date of its own filing.
Learn: How to read a proxy statement (DEF 14A): Nvidia's 2026 proxy · Form 4 insider filings: who files, the codes and the footnotes
21What it does with profit
21What it does with profit
What does PACCAR do with its profit?
Dividend per share
$2.72FY2025
Dividend paid for each share, by financial year.
$ per share
See the numbers
No buybacks or fund raises in the period covered.
Sources (1)
22Governance signals
22Governance signals
What do PACCAR's governance filings show?
- Auditor
- Ernst & Young LLP, since 1945
- Auditor changes
- None in the period covered
- Audit qualifications
- None reported
- Related-party dealings
- The board's Audit Committee reviews and approves related-person transactions under SEC rules, using written procedures to flag them. Executive Chairman Mark C. Pigott and director John M. Pigott are brothers.
- Credit rating
- Not named in the filing (PACCAR states its ratings as "A+/A1") A+/A1 (outlook Not stated in the filing), Oct 28, 2026
A credit rating describes the company's ability to repay debt. It is not a rating of the share.
23How it got here
23How it got here
How did PACCAR get here?
1905
Milestone
Seattle Car Manufacturing Company formed
PACCAR traces its roots to this Seattle company.
1924
Milestone
Pacific Car and Foundry Company incorporated
Incorporated in Washington; PACCAR is its successor.
1941
Milestone
Start of an unbroken dividend record
The 2026 proxy says PACCAR has paid annual dividends every year since 1941.
1971
Milestone
PACCAR Inc incorporated in Delaware
The company in its current legal form.
2016
Crisis
EC settlement
According to the FY2025 10-K, the EC concluded its investigation of all major European truck makers and reached a settlement with PACCAR and DAF; claims and lawsuits followed.
2023
Milestone
204,200 trucks delivered
PACCAR delivered 204,200 trucks and earned $4.60 billion, after a $600.0 million pre-tax charge for EC-related claims.
2025
Crisis
Truck downturn and tariffs
Deliveries fell to 144,200, PACCAR took a further $350.0 million EC-related charge, and U.S. truck tariffs began in November.
24Sources and changes
Where every number on this page comes from
Sources (19 documents)
- S1Form 10-Q for Q3 FY2026 · SEC EDGAR · Tier 1: company or exchange filing · Oct 28, 2026
- S2Form 10-Q for Q2 FY2026 · SEC EDGAR · Tier 1: company or exchange filing · Jul 29, 2026
- S3Form 10-Q for Q1 FY2026 · SEC EDGAR · Tier 1: company or exchange filing · Apr 29, 2026
- S4Form 10-K for FY2025 · SEC EDGAR · Tier 1: company or exchange filing · Feb 18, 2026
- S5Form 10-Q for Q3 FY2025 · SEC EDGAR · Tier 1: company or exchange filing · Oct 30, 2025
- S6Form 10-Q for Q2 FY2025 · SEC EDGAR · Tier 1: company or exchange filing · Jul 31, 2025
- S7Form 10-Q for Q1 FY2025 · SEC EDGAR · Tier 1: company or exchange filing · May 1, 2025
- S8Form 10-K for FY2024 · SEC EDGAR · Tier 1: company or exchange filing · Feb 19, 2025
- S9Form 10-Q for Q3 FY2024 · SEC EDGAR · Tier 1: company or exchange filing · Oct 30, 2024
- S10Form 10-Q for Q2 FY2024 · SEC EDGAR · Tier 1: company or exchange filing · Jul 31, 2024
- S11Form 10-Q for Q1 FY2024 · SEC EDGAR · Tier 1: company or exchange filing · May 2, 2024
- S12Form 10-K for FY2023 · SEC EDGAR · Tier 1: company or exchange filing · Feb 21, 2024
- S13Form 10-K for FY2022 · SEC EDGAR · Tier 1: company or exchange filing · Feb 22, 2023
- S14Form 10-K for FY2021 · SEC EDGAR · Tier 1: company or exchange filing · Feb 23, 2022
- S152026 proxy statement (DEF 14A) · SEC EDGAR · Tier 1: company or exchange filing · Mar 18, 2026
- S16Earnings release for Q3 FY2026 (Form 8-K, Exhibit 99.1) · SEC EDGAR · Tier 1: company or exchange filing · Oct 27, 2026
- S19Earnings release for Q4 FY2025 (Form 8-K, Exhibit 99.1) · SEC EDGAR · Tier 1: company or exchange filing · Jan 27, 2026
- S20Earnings release for Q4 FY2024 (Form 8-K, Exhibit 99.1) · SEC EDGAR · Tier 1: company or exchange filing · Jan 28, 2025
- S21Earnings release for Q3 FY2025 (Form 8-K, Exhibit 99.1) · SEC EDGAR · Tier 1: company or exchange filing · Oct 21, 2025
Changes to this page (v1 · Nov 20, 2026)
- v1 · Nov 20, 2026First version. (first version)
Numbers come only from tier 1 and tier 2 sources. Read how we research.
Disclaimer
For learning only. Cityfort is not a registered investment adviser or broker-dealer and does not recommend buying or selling any security. Prices shown are dated and may be out of date.
Investing in securities involves risk, including loss of capital. Before making any investment decision, do your own research and consider consulting a registered investment adviser or other qualified professional.
Cityfort, its owners and contributors may or may not hold securities of companies covered. Cityfort is not paid by any company it covers. Content is not an offer or solicitation to buy or sell any security, including in any initial public offering.
Read the positions policyRead the full disclaimerHide the full disclaimer
Cityfort publishes general educational content that explains how listed companies work. Cityfort is not registered with the US Securities and Exchange Commission or any state securities regulator as an investment adviser, and is not a broker-dealer or a member of FINRA. Cityfort does not provide investment, tax or legal advice, recommendations, ratings, price targets or any opinion on whether to buy, sell or hold any security. Nothing on the site is tailored to any person's circumstances.
All information is taken from publicly available sources, mainly company filings with the SEC, which are listed on each page with dates. We work to keep it accurate and correct errors publicly, but we do not guarantee that it is complete, accurate or up to date. Any market price or price-based ratio shown is dated, may be out of date by the time you read it, and is included only to explain concepts.
Statements by company management, including forward-looking statements and guidance, are reported as the company's statements, with their date and source; they are not our forecasts. Adjusted (non-GAAP) figures are the company's own measures and are shown next to the official (GAAP) figures.