Industrials · NYSE: PH
Parker-Hannifin: how the business works
Parker-Hannifin makes hydraulics, filters, pneumatics and aircraft systems that other companies build into machines and planes, with net sales of $21,499 million in FY2026.
By Hardik Bhandare · Checked against filings: . Editorial policy. Corrections
Follow Parker-Hannifin
Email me when Parker-Hannifin's page is updated after earnings.
We'll send a confirmation email first. See our privacy policy.
Parker-Hannifin Corporation · Cleveland, Ohio
Updated for Q1 FY2027 · checked
- Net sales, FY2026
- $21.5B
- Net income, FY2026
- $3.65B
- Aftermarket share of Aerospace sales, FY2026
- 49%
- Team members, Jun 30, 2026
- About 59,850
- Directors and officers' stake, Jul 31, 2026
- 0.35%
The short version
Parker-Hannifin in 5 points
1 · What it sells
Parker-Hannifin makes hydraulics, pneumatics, filters and aircraft systems in eight core technologies, with net sales of $21,499 million in FY2026.
2 · Who pays it
Industrial equipment makers and distributors paid 67.2% of FY2026 sales, the commercial aircraft aftermarket 11.7%, commercial aircraft makers 10.8%, defense aircraft makers 5.9% and the defense aftermarket 4.4% (Cityfort calculation from the FY2026 10-K).
3 · What it keeps from $100
Of every $100 that came in during FY2026, Parker kept $16.72 as net income, including $330 million of non-operating other income; segment operating income was 24.5% of sales, as Parker reported.
4 · Where the operating profit comes from
Diversified Industrial brought 67.2% of FY2026 sales and Aerospace Systems 32.8%, or $7,061 million (Cityfort calculation from the FY2026 10-K); Aerospace had the higher segment operating margin, 26.0%, against 24.5% for both segments together.
5 · The one thing to watch
Total debt rose from $8,520 million on Jun 30, 2026 to $17,478 million on Sep 30, 2026 (Cityfort calculation from the Q1 FY2027 10-Q), after the $9.25 billion Filtration Group purchase.
Sources: From Parker-Hannifin's FY2026 10-K, the Q1 FY2027 10-Q and its Aug 13, 2026 Filtration Group 8-K · checked
01Where the money goes · FY2026
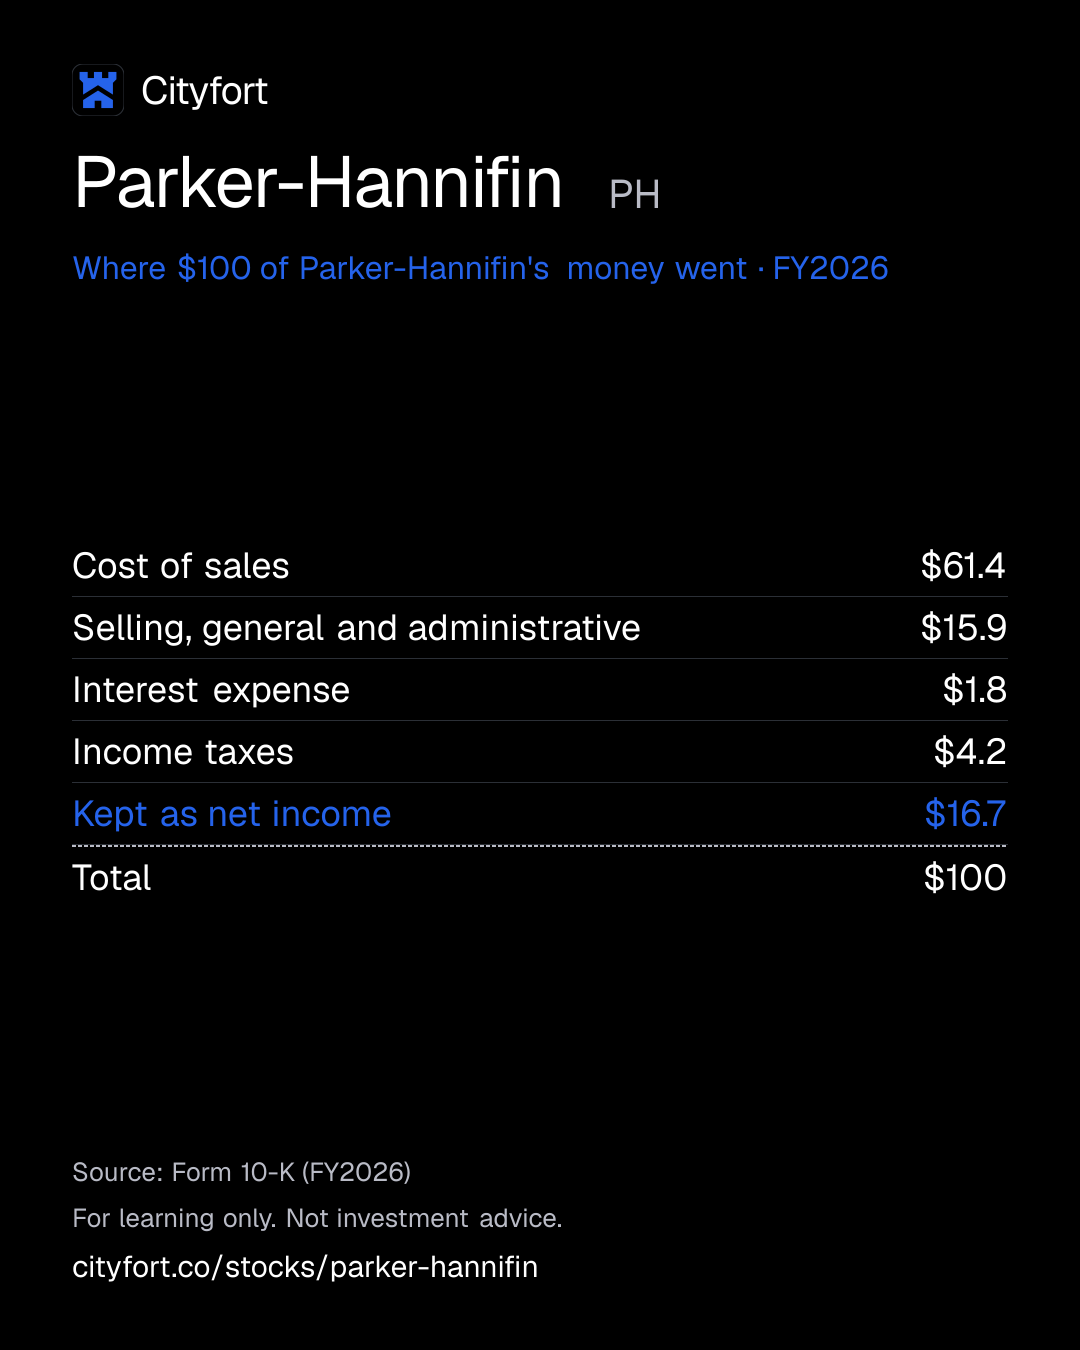
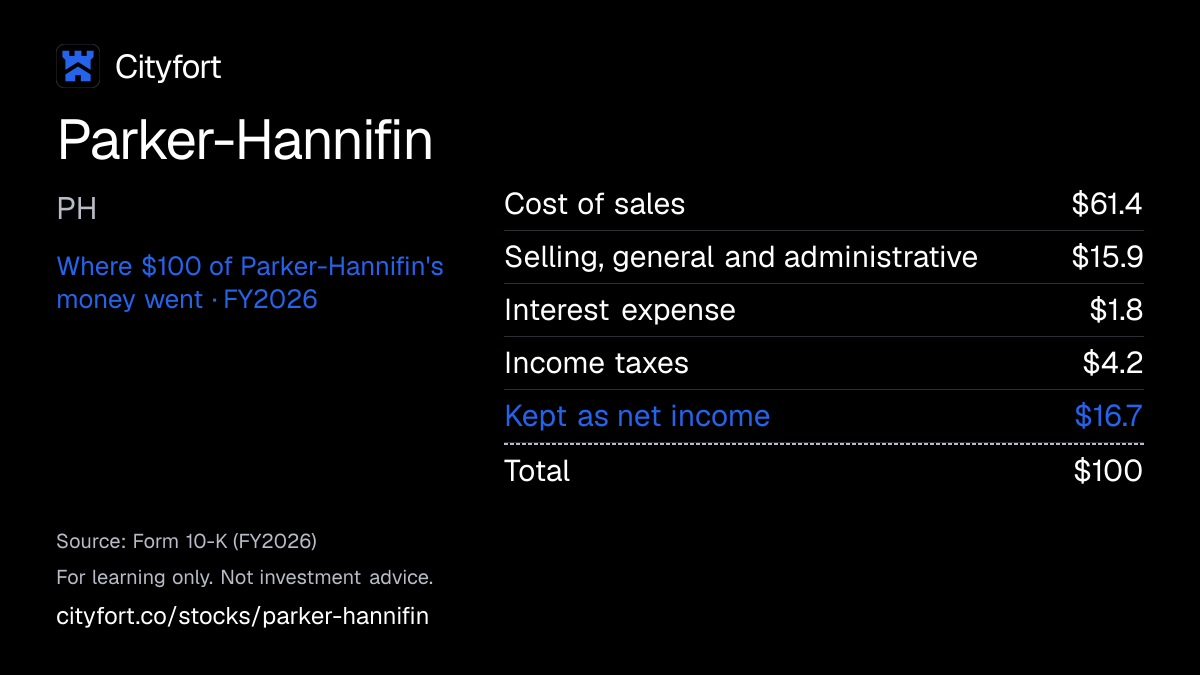
Where does $100 of Parker-Hannifin's money go?
Parker-Hannifin · FY2026
Receipt for every $100
| Cost of sales | $61.4 |
|---|---|
| Selling, general and administrative | $15.9 |
| Interest expense | $1.8 |
| Income taxes | $4.2 |
| Kept as net income | $16.7 |
| Total | $100 |
Each line = amount ÷ total money in × 100. Lines may not add to exactly $100 because of rounding.
How this is worked out
Cityfort calculation from the FY2026 10-K. Of every $100 that came in during FY2026: each line = line ÷ $21,829 million × 100 (net sales $21,499 million + other income $330 million).
Save this receipt as an image
Embed this receipt or the key numbers
Paste this code into a blog or website to show the card you choose, with a link back to this page.
Each week: the next company due to report earnings, explained in 5 points.
No tips. Unsubscribe anytime.
We'll send a confirmation email. See our privacy policy.
02The business in one line
What does Parker-Hannifin do?
Machine makers, distributors and aircraft builders pay Parker for parts that move and control fluids and air; making those parts takes $61.36 of every $100.
- Industrial equipment makers and distributors paid 67.2% of FY2026 sales, and aircraft makers and operators the other 32.8% (Cityfort calculation from the FY2026 10-K).
- After selling costs, interest and tax, $16.72 of every $100 was left as net income in FY2026 (Cityfort calculation from the FY2026 10-K).
03Who pays it
Who pays Parker-Hannifin?
Industrial equipment makers and distributors
67.2%
of revenue
Buyers in factories, trucks, off-highway machines (farm and construction), energy and HVAC, through the Diversified Industrial segment.
Commercial aircraft aftermarket
11.7%
of revenue
Spare parts and repairs for airliners already flying.
Commercial aircraft makers
10.8%
of revenue
Parts and systems for new commercial aircraft.
Defense aircraft makers
5.9%
of revenue
Parts and systems for new military aircraft.
Defense aftermarket
4.4%
of revenue
Spare parts and repairs for military aircraft in service.
- Industrial equipment makers and distributors67.2%
- Commercial aircraft aftermarket11.7%
- Commercial aircraft makers10.8%
- Defense aircraft makers5.9%
- Defense aftermarket4.4%
How spread out the customers are
Shares of FY2026 net sales of $21,499 million are a Cityfort calculation from the FY2026 10-K. The 10-K names no major customer; it says Parker serves several hundred thousand OEM and distribution customer locations.
Sources (1)
04How it makes money
How does Parker-Hannifin make money?
Parts go into new machines and aircraft, then keep selling as spares for years
Parker wins a place on a machine or aircraft, then sells replacement parts and repairs while it runs. In FY2026 aftermarket sales were $3,460 million, 49% of Aerospace sales (Cityfort calculation from the FY2026 10-K). Segment operating income per $100 of sales rose from $20.14 in FY2022 (Cityfort calculation from the FY2024 10-K) to $24.50 in FY2026, as stated in the Q4 FY2026 earnings release.
Segment operating income per $100 of sales
$20.1$24.5
FY2022 to FY2026
- Win a place on a new machine or aircraft program
- Supply parts while the equipment is built
- Sell replacement parts through distributors as parts wear out
- Sell aerospace spares and maintenance to aircraft operators
- Use the cash for acquisitions, dividends and buybacks
↺ Step 5 feeds back into step 1.
05Business segments · FY2026
Which businesses make up Parker-Hannifin?
Diversified Industrial
67.2%Motion, flow, process control and filtration products for industrial customers, sold to equipment makers and distributors.
Revenue $14.4B ($14,438M) · Operating profit $3.4B ($3,440M)
Aerospace Systems
32.8%Aircraft and engine components, spare parts and maintenance for commercial and defense aviation.
Revenue $7.1B ($7,061M) · Operating profit $1.8B ($1,833M)
How the mix changed
- Diversified Industrial
- Aerospace Systems
Revenue by segment, FY2022 to FY2026.
US$
See the numbers
06The numbers · Consolidated · US$
How has Parker-Hannifin done?
Revenue
$21.5BFY2026
Net sales grew from $15,862 million in FY2022 to $21,499 million in FY2026, with one dip, to $19,850 million in FY2025.
US$
See the numbers
Net income
$3.6BFY2026
Net income rose every year, from $1,316 million in FY2022 to $3,648 million in FY2026.
US$
See the numbers
Net income for every $100 of revenue
$17.0FY2026
Net income per $100 of sales rose from $8.29 in FY2022 to $16.97 in FY2026.
Net margin: $ of net income per $100 of revenue
See the numbers
Free cash flow
$3.9BFY2026
Free cash flow (operating cash flow minus capital spending) rose every year, from $2,212 million in FY2022 to $3,905 million in FY2026.
US$ · cash from operations minus spending on plants and equipment
See the numbers
See all yearly numbers
EBITDA here = operating income plus depreciation and amortization (from the cash flow statement). Fiscal years are the company's own: Fiscal year ends Jun 30. Net income is the share belonging to the company's owners.
Learn: Fiscal years that don't end in December: Nvidia's FY2027 explained · Stock-based compensation and dilution: pay that becomes shares
Sources (22)
- Form 10-K for FY2022
- Form 10-K for FY2023
- Form 10-K for FY2024
- Form 10-K for FY2025
- Form 10-K for FY2026
- Form 10-Q for Q2 FY2024
- Form 10-Q for Q3 FY2024
- Earnings release (8-K Ex. 99.1), Q3 FY2025
- Earnings release (8-K Ex. 99.1), Q2 FY2025
- Earnings release (8-K Ex. 99.1), Q4 FY2025
- Form 10-Q for Q1 FY2025
- Earnings release (8-K Ex. 99.1), Q1 FY2026
- Form 10-Q for Q2 FY2025
- Form 10-Q for Q3 FY2025
- Form 10-Q for Q1 FY2026
- Form 10-Q for Q2 FY2026
- Earnings release (8-K Ex. 99.1), Q2 FY2026
- Form 10-Q for Q3 FY2026
- Earnings release (8-K Ex. 99.1), Q3 FY2026
- Earnings release (8-K Ex. 99.1), Q4 FY2026
- Form 10-Q for Q1 FY2027
- Earnings release (8-K Ex. 99.1), Q1 FY2027
07Who runs it
Who runs Parker-Hannifin, and did they deliver?
Jennifer A. Parmentier
Chairman and Chief Executive Officer · since 2015
Executive officer since 2015, as the FY2026 10-K lists.
Todd M. Leombruno
Executive Vice President and Chief Financial Officer · since 2017
Executive officer since 2017.
Andrew D. Ross
President and Chief Operating Officer · since 2012
Executive officer since 2012.
Jay P. Reidy
Vice President and President, Aerospace Group · since 2024
Executive officer since 2024.
Matthew A. Jacobson
Vice President and President, Filtration Group · since 2025
Executive officer since 2025.
What they said, and what happened
1 delivered · 3 too early to tell
Said on Aug 7, 2025
Parker said it expected FY2026 adjusted EPS of $28.40 to $29.40 and reported sales growth of 2% to 5%.
DeliveredWhat happened
FY2026 adjusted EPS was $32.31 and reported sales growth 8.3%. Parker raised the EPS range on Nov 6, 2025, Jan 29, 2026 and Apr 30, 2026.
Said on Aug 21, 2026
The CIRCOR Aerospace purchase, about $2.55 billion in cash, is expected to close in the second half of calendar 2026.
Too early to tellWhat happened
Still pending in the Q1 FY2027 10-Q filed Nov 5, 2026.
Said on Aug 6, 2026
FY2031 targets: adjusted segment operating margin of 30%, organic growth of 4% to 6%, a free cash flowCash from operations minus spending on buildings and equipment. Learn more margin of 17% and adjusted EPS growth above 10%.
Too early to tellWhat happened
The 30% margin target replaced a 27% target that Parker said it passed in FY2026 (27.3%).
Said on Aug 21, 2026
Capital spending of about 2.5% of sales in FY2027 and 2.0% over the long term.
Too early to tellWhat happened
Q1 FY2027 capital spending was $109 million on sales of $5,992 million.
Sources (8)
08What could go wrong
What could go wrong for Parker-Hannifin?
- Debt
Much more debt after the Filtration Group purchase
Total debt rose from $8,520 million on Jun 30, 2026 to $17,478 million on Sep 30, 2026 (Cityfort calculation from the FY2026 10-K and Q1 FY2027 10-Q). The 10-K lists debt and loan covenants as a risk to Parker's flexibility.
Watch Net debt each quarter, and any change to the A- (Fitch), A3 (Moody's) and BBB+ (S&P) ratings.
- Execution
Fitting in two large acquisitions
Filtration Group ($9.25 billion) closed on Aug 13, 2026, and CIRCOR Aerospace (about $2.55 billion) was still pending on Nov 5, 2026. The 10-K warns that the expected benefits of acquisitions may not be realized.
Watch The CIRCOR closing and Diversified Industrial margins in the next releases.
- Demand
Industrial demand moves with the economy
Diversified Industrial sales fell from $14,458 million in FY2024 to $13,665 million in FY2025. The 10-K names declines in industrial production as a risk to demand.
Watch Diversified Industrial organic growth and order rates in each earnings release.
- Demand
Aircraft programs and government budgets
Aerospace Systems was 33% of FY2026 sales, and defense aircraft makers and users bought $2,208 million (Cityfort calculation from the FY2026 10-K). The 10-K names future US government spending as a risk.
Watch Aerospace backlog, $8,498 million on Jun 30, 2026.
- Other
Goodwill could be written down
Goodwill and acquired intangibles were 67% of total assets on Sep 30, 2026 (Cityfort calculation from the Q1 FY2027 10-Q). The 10-K says an impairment could bring large non-cash charges.
Watch Impairment tests reported in the annual 10-K.
- Regulation
Tariffs, trade limits and currencies
About 36% of FY2026 sales came from outside the US (Cityfort calculation from the FY2026 10-K). The 10-K lists tariffs, trade restrictions, possible obstacles to business in China and currency swings as risks.
Watch Tariff effects named in each earnings release.
- Legal
Environmental cleanup costs
Parker is named a "potentially responsible party" at some waste sites under the US Superfund law, and is involved in remediation at current and former plants. It says compliance has not had a material adverse effect.
Watch The environmental reserve in Note 17 of each 10-K.
09Supporters vs. critics
What do supporters and critics point to?
What supporters point to
- Segment operating margin rose from 23.0% in FY2025 to 24.5% in FY2026, and Aerospace Systems reached 26.0% (Q4 FY2026 earnings release).
- Aftermarket sales, spare parts and repairs for aircraft already flying, were 49% of FY2026 Aerospace sales (Cityfort calculation from the FY2026 10-K).
- Free cash flow rose every year, from $2,212 million in FY2022 to $3,905 million in FY2026 (Cityfort calculation from the FY2024 to FY2026 10-Ks).
- The Aerospace backlog, firm orders not yet delivered, reached $8,498 million on Jun 30, 2026.
- Parker says it has raised its annual dividend for 70 consecutive fiscal years (Q1 FY2027 10-Q).
What critics point to
- Total debt rose from $8,520 million on Jun 30, 2026 to $17,478 million on Sep 30, 2026 (Cityfort calculation from the FY2026 10-K and Q1 FY2027 10-Q).
- Goodwill and acquired intangibles were 67% of total assets on Sep 30, 2026 (Cityfort calculation from the Q1 FY2027 10-Q); the 10-K says an impairment could bring large non-cash charges.
- Diversified Industrial sales fell from $14,458 million in FY2024 to $13,665 million in FY2025, and FY2026 sales of $14,438 million were still below FY2023.
- GAAP diluted EPS rose 5% in FY2026, while Parker's adjusted EPS, which leaves out acquisition amortization and costs, rose 18%.
- The CIRCOR Aerospace purchase, about $2.55 billion, was still pending in the Q1 FY2027 10-Q filed Nov 5, 2026.
10What to watch next
What should you watch next at Parker-Hannifin?
Next event
Q2 FY2027 results
Date not announced yet.
Debt after Filtration Group
Net debt was $16,767 million on Sep 30, 2026, against $8,019 million on Jun 30, 2026 (Cityfort calculation from the Q1 FY2027 10-Q and FY2026 10-K). The next 10-Q will show the Dec 31, 2026 figure.
The CIRCOR Aerospace closing
The FY2026 10-K expected the purchase, about $2.55 billion, to close in the second half of calendar 2026. It was still pending in the Q1 FY2027 10-Q filed Nov 5, 2026.
FY2027 outlook against results
Parker said on Nov 5, 2026 that it expects FY2027 GAAP EPS of $29.65 to $30.45 and organic growth of 7.5% to 10.5%. Q1 FY2027 diluted EPS was $6.92.
Industrial demand
Diversified Industrial organic sales grew 3.4% in FY2026 after FY2025 sales fell. In Q1 FY2027 its North American organic growth was 9.4%.
11Key facts
Key facts about Parker-Hannifin
- What does Parker-Hannifin do?
- Parker-Hannifin designs and makes motion and control parts, such as hydraulics, pneumatics, filters and aircraft systems, for other companies' machines and planes. Its net sales were $21,499 million in FY2026, the year to Jun 30, 2026.
- How does Parker-Hannifin make money?
- Parker-Hannifin sells parts for new equipment and then replacement parts and repairs. In FY2026 its Diversified Industrial segment brought $14,438 million of sales and Aerospace Systems $7,061 million. Aftermarket sales were $3,460 million of the Aerospace total.
- Who are Parker-Hannifin's customers?
- Parker-Hannifin's FY2026 10-K names no major customer and says it serves several hundred thousand OEM and distribution customer locations. Industrial equipment makers and distributors paid 67.2% of FY2026 sales (Cityfort calculation from the FY2026 10-K).
- How big is Parker-Hannifin?
- Parker-Hannifin had net sales of $21,499 million and net income of $3,648 million in FY2026, with diluted EPS of $28.48. It had about 59,850 team members on Jun 30, 2026.
- Who owns Parker-Hannifin?
- No holder controls Parker-Hannifin. The 2026 proxy lists State Street at 7.78% (filing of Feb 4, 2025), Vanguard Capital Management at 7.48% (Apr 30, 2026) and BlackRock at 6.77% (Jan 26, 2024). Directors and executive officers held 0.35%.
- How much debt does Parker-Hannifin have?
- Parker-Hannifin's total debt was $17,478 million on Sep 30, 2026, up from $8,520 million on Jun 30, 2026 (Cityfort calculation from the Q1 FY2027 10-Q and FY2026 10-K). The rise came after it paid $9.25 billion in cash for Filtration Group on Aug 13, 2026.
- When does Parker-Hannifin's fiscal year end?
- Parker-Hannifin's fiscal yearThe company's own 12-month year, which may not end in December. Learn more ends on Jun 30, so FY2026 is the year from Jul 1, 2025 to Jun 30, 2026.
- Does Parker-Hannifin pay a dividend?
- Parker-Hannifin paid dividends of $7.40 per share in FY2026, up from $4.42 in FY2022. Parker says it has raised its annual dividend for 70 consecutive fiscal years (Q1 FY2027 10-Q).
Terms on this page
- Capital expenditures (capex)
- Debt-to-equity
- Dividend payout ratio
- Earnings per share (EPS)
- EBITDA
- Free cash flow
- Net debt
- Net margin
- Revenue vs net income
- Stock buyback
Each explains the term in plain English, with the same number from other companies on Cityfort.
Go deeper
More detail from the same filings. Open any section.
12What it sells
12What it sells
What does Parker-Hannifin sell?
Filtration and engineered materials
Filters and engineered materials for equipment makers and distributors: $6,048 million of sales in FY2026, the biggest industrial product group.
Flow and process control
Products that handle fluids and gases and control industrial processes: $4,810 million of sales in FY2026.
Motion systems
The third industrial product group, with $3,580 million of sales in FY2026.
Aerospace systems
Airframe and engine components and systems for commercial and military aircraft, plus spare parts and maintenance: $7,061 million in FY2026.
What it does
- Does: Sells parts to equipment makers (OEMs, original equipment manufacturers) for new machines and aircraft
- Does: Sells replacement parts through distributors who serve repair markets
- Does: Supplies aerospace spare parts and maintenance directly to aircraft operators
What it does not do
- Does not: Does not build whole aircraft, trucks or machines
- Does not: Does not rely on any single patent or license to a material extent, its FY2026 10-K says
Sources (1)
13How the money flows
13How the money flows · FY2026
How does money flow through Parker-Hannifin?
Money in
- Net sales$21.5B
- Other income, net$330M
The company
Parker-Hannifin
$21.8B came in
Money out
- Cost of sales$13.4B
- Selling, general and administrative$3.5B
- Interest expense$401M
- Income taxes$914M
- Net income$3.6B
- Customers paid Parker $21,499 million in FY2026 for parts, systems and aftermarket service.
- Cost of sales, the cost of making what it sold, took $13,397 million.
- Selling, general and administrative costs took $3,468 million, and interest on debt $401 million.
- Other income added $330 million, including $218 million from joint ventures.
- After $914 million of income tax, $3,649 million was left as net income; $1 million of it belonged to minority partners in subsidiaries.
Sources (1)
14What it needs to run
14What it needs to run
What does Parker-Hannifin need to run?
Factories
About 323 manufacturing plants, with divisions in 44 countries (FY2026 10-K).
People
About 59,850 team members on Jun 30, 2026, of whom about 30,830 worked for foreign subsidiaries.
Raw materials
Mainly steel, brass, copper, aluminum, nickel, rubber, thermoplastics and chemicals, bought from many suppliers.
Engineering
Research and development spending of $267 million in FY2026, up from $240 million in FY2025.
Sources (1)
15Where it sells
15Where it sells · FY2026
Where does Parker-Hannifin sell?
- North America66.9%
- Europe, Middle East and Africa19.4%
- Asia Pacific12.6%
- Latin America1%
Sources (1)
16Competitors and what protects it
16Competitors and what protects it
Who does Parker-Hannifin compete with?
Bosch Rexroth AG
Named in the FY2026 10-K as a primary global competitor for Diversified Industrial products.
Danaher Corporation
NYSE: DHR
Named in the FY2026 10-K as a primary global competitor for Diversified Industrial products.
Donaldson Company
Named in the FY2026 10-K as a primary global competitor for Diversified Industrial products.
Eaton Corporation
Named in the FY2026 10-K as a primary global competitor for Aerospace Systems products.
RTX Corporation
NYSE: RTX
Named in the FY2026 10-K as a primary global competitor for Aerospace Systems products.
What protects the business
Each strength is scored 1 (weak) to 5 (strong) for the business, with the reason. It is not a rating of the share.
- Spare parts on equipment already in use4 of 5
Original equipment wins bring follow-on repair and replacement business, the 10-K says; aftermarket was 49% of FY2026 Aerospace sales.
- Breadth of products4 of 5
Eight core technologies, and the 10-K says no single competitor competes with Parker across all its products.
- Reach4 of 5
Several hundred thousand OEM and distribution customer locations, about 323 plants and divisions in 44 countries.
Weak spot
Industrial cycles
Diversified Industrial sales fell from $14,458 million in FY2024 to $13,665 million in FY2025; FY2026 sales of $14,438 million were still below FY2023.
Sources (2)
17Where growth could come from
17Where growth could come from
Where could Parker-Hannifin's growth come from?
Parker said on Nov 5, 2026 that it expects FY2027 sales growth of 16.0% to 19.0%, including 7.5% to 10.5% organic growth (growth without acquisitions and currency). It expects GAAP EPS of $29.65 to $30.45 ($36.45 to $37.25 adjusted) and free cash flow of $3,500 to $4,000 million.
Aerospace
WorkingSales +14.2% in FY2026
Aerospace Systems sales rose from $6,185 million in FY2025 to $7,061 million in FY2026, with organic growth of 13.4%. Its backlog (firm orders not yet delivered) reached $8,498 million on Jun 30, 2026.
Status: Working, on track against what the company said.
Filtration Group purchase
New$281 million of Q1 FY2027 sales
Completed Aug 13, 2026 for $9.25 billion in cash and reported in Diversified Industrial. Acquisitions added 6.9 percentage points to the 17.9% sales growth of Q1 FY2027.
Status: New, recently announced.
Industrial recovery
MixedOrganic +3.4% in FY2026
Diversified Industrial organic sales grew 3.4% in FY2026 after FY2025 sales fell. In Q1 FY2027 its North American organic growth was 9.4%.
Status: Mixed, partly on track.
CIRCOR Aerospace purchase
EarlyAbout $2.55 billion, pending
Agreed May 21, 2026 and still pending in the Q1 FY2027 10-Q. A delayed-draw term loan of up to $2.0 billion was signed for it in Sep 2026.
Status: Early, too early to judge.
Wider segment margins
Working24.5% in FY2026
Segment operating margin rose from 23.0% in FY2025 to 24.5% in FY2026; Aerospace reached 26.0%.
Status: Working, on track against what the company said.
Status compares progress with what the company itself said it would do: Working = on track against what the company said; Mixed = partly on track; Behind = behind the company's own plan; New = recently announced; Early = too early to judge.
18The company's own measures (non-GAAP)
18The company's own measures · FY2026, unless the row says otherwise
What do Parker-Hannifin's own measures show?
Official (GAAP): Diluted EPS, FY2026
$28.48
Company's own measure: Adjusted EPS, FY2026
$32.31
Parker leaves out amortization of acquired intangibles, realignment, integration and acquisition costs. Adjusted EPS rose 18% from FY2025; GAAP EPS rose 5%.
Official (GAAP): Segment operating income, FY2026
$5.3B
Company's own measure: Adjusted segment operating income, FY2026
$5.9B
The same exclusions applied to the two segments' operating income.
Official (GAAP): Segment operating margin, FY2026
24.5%
Company's own measure: Adjusted segment operating margin, FY2026
27.3%
Segment operating income divided by sales. The adjusted margin rose 1.2 points from FY2025 and the GAAP margin 1.5 points.
Official (GAAP): Reported net sales growth, FY2026
8.3%
Company's own measure: Organic sales growth, FY2026
6.6%
Organic growth leaves out currency (+1.2 points), acquisitions (+1.2 points) and divestitures (−0.7 points).
Official (GAAP): Diluted EPS, Q1 FY2027
$6.92
Company's own measure: Adjusted EPS, Q1 FY2027
$8.90
Q1 FY2027 adjustments included $189 million of amortization of acquired intangibles and $78 million of acquisition-related costs, before tax.
Official (GAAP): Segment operating margin, Q1 FY2027
24.4%
Company's own measure: Adjusted segment operating margin, Q1 FY2027
28.6%
The first quarter that includes Filtration Group, from Aug 13, 2026.
These are the company's own measures, defined by the company. They are not comparable across companies, and they are not added together. Each sits beside the nearest official (GAAP) figure.
Learn: Non-GAAP measures: what a company's "adjusted" numbers leave out
19Financial strength and debt
19Financial strength · Sep 30, 2026
How much debt does Parker-Hannifin have?
- Total debt$17.5B
- Cash and investments$711M
- Net debt (debt minus cash)$16.8B
- Net worth (shareholders' money)$16.0B
- Debt to equity
- 1.09×
- $ of debt for every $1 of shareholders' money
- Total debt of $17,478 million is notes payable and debt due within a year ($4,744 million) plus long-term debt ($12,734 million); net debt subtracts $711 million of cash (Cityfort calculation from the Q1 FY2027 10-Q).
- Debt rose with the Filtration Group purchase, which was partly paid with $5.25 billion and $2.50 billion term loans. In Sep 2026 Parker sold US$2.4 billion and €2.025 billion of notes (bonds) to repay the 364-day loan.
- Goodwill ($16,216 million) and acquired intangible assets ($11,686 million) were 67% of total assets of $41,927 million on Sep 30, 2026 (Cityfort calculation from the Q1 FY2027 10-Q).
- Parker's credit agreement caps debt at 0.65 of debt plus equity; the FY2026 10-K says Parker was in compliance on Jun 30, 2026.
20Who owns it
20Who owns it · ownership as of Jul 31, 2026
Who owns Parker-Hannifin?
- Officers and directors (as a group), shares
- 0.4%
Share classes
Holders of 5% or more
From the company's proxy statement (DEF 14A), later Schedule 13G filings and the share counts on its latest annual or quarterly report. Each holder row shows the date of its own filing.
Learn: How to read a proxy statement (DEF 14A): Nvidia's 2026 proxy · Form 4 insider filings: who files, the codes and the footnotes
21What it does with profit
21What it does with profit
What does Parker-Hannifin do with its profit?
Dividend per share
$7.40FY2026
Dividend paid for each share, by financial year.
$ per share
See the numbers
Buyback · Jun 30, 2022
Payments for common shares in FY2022.
$460M
Buyback · Jun 30, 2023
Payments for common shares in FY2023.
$297M
Buyback · Jun 30, 2024
Payments for common shares in FY2024.
$332M
Buyback · Jun 30, 2025
Payments for common shares in FY2025.
$1.8B
Buyback · Jun 30, 2026
Payments for common shares in FY2026, including shares withheld for employees' taxes; 1.2 million shares cost $1.0 billion under the buyback program.
$1.3B
22Governance signals
22Governance signals
What do Parker-Hannifin's governance filings show?
- Auditor
- Deloitte & Touche LLP, since 2008
- Auditor changes
- None in the period covered
- Audit qualifications
- None reported
- Related-party dealings
- The 2026 proxy says that in fiscal 2026 no material related-party transactions existed that required disclosure under SEC rules.
- Credit rating
- Fitch, Moody's and S&P, as stated in Parker's FY2026 10-K A- (Fitch) / A3 (Moody's) / BBB+ (S&P), long-term senior debt (outlook Not stated in the 10-K), Jun 30, 2026
A credit rating describes the company's ability to repay debt. It is not a rating of the share.
23How it got here
23How it got here
How did Parker-Hannifin get here?
1938
Milestone
Incorporated in Ohio
Parker-Hannifin Corporation was incorporated in Ohio in 1938; it is based in Cleveland.
2022
Business-model change
Bought Meggitt
The Sep 2022 Meggitt purchase added $2.1 billion of FY2023 sales; Aerospace sales rose from $2,520 million in FY2022 to $4,360 million in FY2023.
2023
Milestone
Sold the aircraft wheel and brake business
Parker recorded a $374 million gain on the sale in FY2023.
2025
Milestone
Sold two non-core businesses
In FY2025 it sold its composites and fuel containment business and a non-core filtration business, booking a $253 million gain on business sales.
2025
Milestone
Bought Curtis Instruments
Completed on Sep 18, 2025 for about $1.0 billion net of cash; reported in Diversified Industrial.
2026
Business-model change
Completed the Filtration Group purchase
Agreed in Nov 2025 for $9.25 billion in cash and completed on Aug 13, 2026, with $5.25 billion and $2.50 billion term loans.
2026
Milestone
Agreed to buy CIRCOR Aerospace
Agreed on May 21, 2026 for about $2.55 billion in cash; still pending on Nov 5, 2026.
2026
Milestone
Replaced the bridge loan with bonds
In Sep 2026 Parker sold US$2.4 billion and €2.025 billion of senior notes and repaid the 364-day loan.
Sources (7)
- Form 10-K for FY2026
- Form 10-K for FY2024
- 8-K: Filtration Group merger agreement (Items 1.01, 9.01)
- 8-K: Filtration Group acquisition completed, term loan draws (Items 2.01, 2.03)
- Form 10-Q for Q1 FY2027
- 8-K: senior notes offering priced, US$2.4bn and EUR 2.025bn (Item 8.01)
- 8-K: senior notes offerings completed (Item 8.01)
24Sources and changes
Where every number on this page comes from
Sources (29 documents)
- S1Form 10-Q for Q1 FY2027 · SEC EDGAR · Tier 1: company or exchange filing · Nov 5, 2026
- S2Form 10-K for FY2026 · SEC EDGAR · Tier 1: company or exchange filing · Aug 21, 2026
- S3Form 10-Q for Q3 FY2026 · SEC EDGAR · Tier 1: company or exchange filing · May 1, 2026
- S4Form 10-Q for Q2 FY2026 · SEC EDGAR · Tier 1: company or exchange filing · Jan 30, 2026
- S5Form 10-Q for Q1 FY2026 · SEC EDGAR · Tier 1: company or exchange filing · Nov 7, 2025
- S6Form 10-K for FY2025 · SEC EDGAR · Tier 1: company or exchange filing · Aug 22, 2025
- S7Form 10-Q for Q3 FY2025 · SEC EDGAR · Tier 1: company or exchange filing · May 6, 2025
- S8Form 10-Q for Q2 FY2025 · SEC EDGAR · Tier 1: company or exchange filing · Jan 31, 2025
- S9Form 10-Q for Q1 FY2025 · SEC EDGAR · Tier 1: company or exchange filing · Nov 5, 2024
- S10Form 10-K for FY2024 · SEC EDGAR · Tier 1: company or exchange filing · Aug 22, 2024
- S11Form 10-Q for Q3 FY2024 · SEC EDGAR · Tier 1: company or exchange filing · May 3, 2024
- S12Form 10-Q for Q2 FY2024 · SEC EDGAR · Tier 1: company or exchange filing · Feb 6, 2024
- S13Form 10-K for FY2023 · SEC EDGAR · Tier 1: company or exchange filing · Aug 24, 2023
- S14Form 10-K for FY2022 · SEC EDGAR · Tier 1: company or exchange filing · Aug 24, 2022
- S152026 Proxy Statement (DEF 14A) · Parker-Hannifin Corporation (SEC EDGAR) · Tier 1: company or exchange filing · Sep 18, 2026
- S16Earnings release (8-K Ex. 99.1), Q1 FY2027 · Parker-Hannifin Corporation (SEC EDGAR) · Tier 1: company or exchange filing · Nov 5, 2026
- S17Earnings release (8-K Ex. 99.1), Q4 FY2026 · Parker-Hannifin Corporation (SEC EDGAR) · Tier 1: company or exchange filing · Aug 6, 2026
- S18Earnings release (8-K Ex. 99.1), Q3 FY2026 · Parker-Hannifin Corporation (SEC EDGAR) · Tier 1: company or exchange filing · Apr 30, 2026
- S19Earnings release (8-K Ex. 99.1), Q2 FY2026 · Parker-Hannifin Corporation (SEC EDGAR) · Tier 1: company or exchange filing · Jan 29, 2026
- S20Earnings release (8-K Ex. 99.1), Q1 FY2026 · Parker-Hannifin Corporation (SEC EDGAR) · Tier 1: company or exchange filing · Nov 6, 2025
- S21Earnings release (8-K Ex. 99.1), Q4 FY2025 · Parker-Hannifin Corporation (SEC EDGAR) · Tier 1: company or exchange filing · Aug 7, 2025
- S22Earnings release (8-K Ex. 99.1), Q3 FY2025 · Parker-Hannifin Corporation (SEC EDGAR) · Tier 1: company or exchange filing · May 1, 2025
- S23Earnings release (8-K Ex. 99.1), Q2 FY2025 · Parker-Hannifin Corporation (SEC EDGAR) · Tier 1: company or exchange filing · Jan 30, 2025
- S248-K: Filtration Group merger agreement (Items 1.01, 9.01) · Parker-Hannifin Corporation (SEC EDGAR) · Tier 1: company or exchange filing · Nov 12, 2025
- S258-K: 364-day and three-year term loan agreements (Items 1.01, 2.03) · Parker-Hannifin Corporation (SEC EDGAR) · Tier 1: company or exchange filing · Dec 10, 2025
- S268-K: Filtration Group acquisition completed, term loan draws (Items 2.01, 2.03) · Parker-Hannifin Corporation (SEC EDGAR) · Tier 1: company or exchange filing · Aug 13, 2026
- S278-K: revolving credit agreement, CIRCOR Aerospace term loan (Item 8.01) · Parker-Hannifin Corporation (SEC EDGAR) · Tier 1: company or exchange filing · Sep 8, 2026
- S288-K: senior notes offering priced, US$2.4bn and EUR 2.025bn (Item 8.01) · Parker-Hannifin Corporation (SEC EDGAR) · Tier 1: company or exchange filing · Sep 10, 2026
- S298-K: senior notes offerings completed (Item 8.01) · Parker-Hannifin Corporation (SEC EDGAR) · Tier 1: company or exchange filing · Sep 14, 2026
Changes to this page (v1 · Nov 20, 2026)
- v1 · Nov 20, 2026First version. (first version)
Numbers come only from tier 1 and tier 2 sources. Read how we research.
Disclaimer
For learning only. Cityfort is not a registered investment adviser or broker-dealer and does not recommend buying or selling any security. Prices shown are dated and may be out of date.
Investing in securities involves risk, including loss of capital. Before making any investment decision, do your own research and consider consulting a registered investment adviser or other qualified professional.
Cityfort, its owners and contributors may or may not hold securities of companies covered. Cityfort is not paid by any company it covers. Content is not an offer or solicitation to buy or sell any security, including in any initial public offering.
Read the positions policyRead the full disclaimerHide the full disclaimer
Cityfort publishes general educational content that explains how listed companies work. Cityfort is not registered with the US Securities and Exchange Commission or any state securities regulator as an investment adviser, and is not a broker-dealer or a member of FINRA. Cityfort does not provide investment, tax or legal advice, recommendations, ratings, price targets or any opinion on whether to buy, sell or hold any security. Nothing on the site is tailored to any person's circumstances.
All information is taken from publicly available sources, mainly company filings with the SEC, which are listed on each page with dates. We work to keep it accurate and correct errors publicly, but we do not guarantee that it is complete, accurate or up to date. Any market price or price-based ratio shown is dated, may be out of date by the time you read it, and is included only to explain concepts.
Statements by company management, including forward-looking statements and guidance, are reported as the company's statements, with their date and source; they are not our forecasts. Adjusted (non-GAAP) figures are the company's own measures and are shown next to the official (GAAP) figures.