Consumer Discretionary · NASDAQ: ORLY
O'Reilly: how the business works
O'Reilly sells car parts, tools and supplies to drivers and repair shops from 6,585 stores, with sales of $17.78 billion in FY2025.
By Hardik Bhandare · Checked against filings: . Editorial policy. Corrections
Follow O'Reilly
Email me when O'Reilly's page is updated after earnings.
We'll send a confirmation email first. See our privacy policy.
O'Reilly Automotive, Inc. · Springfield, Missouri · Founded 1957
Updated for Q3 FY2026 · checked
- Sales, FY2025
- $17.78B
- Net income, FY2025
- $2.54B
- Stores, Dec 31, 2025
- 6,585
- Employees, Jan 31, 2026
- 92,923
- Founded
- 1957
The short version
O'Reilly in 5 points
1 · What it sells
O'Reilly sells replacement car parts, tools, fluids and accessories through 6,585 stores in the US, Mexico and Canada at Dec 31, 2025, with sales of $17.78 billion in FY2025.
2 · Who pays it
Drivers who fix their own cars paid 49.3% of O'Reilly's FY2025 sales and repair shops paid 48.7%; the other 2.1% was other sales and adjustments, such as sales to its own staff and to other parts retailers.
3 · What it keeps from $100
Of every $100 that came in during FY2025, O'Reilly kept $14.3 as net income; operating income was $3.46 billion, and interest income and other added only $14.6 million.
4 · Where the operating profit comes from
O'Reilly reports one operating segment, so all of its $3.46 billion of FY2025 operating income came from selling parts in stores, online and by delivery to repair shops.
5 · The one thing to watch
Comparable store sales (sales at US stores open at least a year) rose 7.2% in Q3 FY2026, and on Oct 28, 2026 O'Reilly raised its FY2026 range for them to 5.5% to 6.5%, from 4.0% to 6.0% on Jul 29, 2026.
Sources: From O'Reilly's FY2025 10-K, its Q3 FY2026 10-Q and its earnings releases of Jul 29 and Oct 28, 2026 · checked
01Where the money goes · FY2025
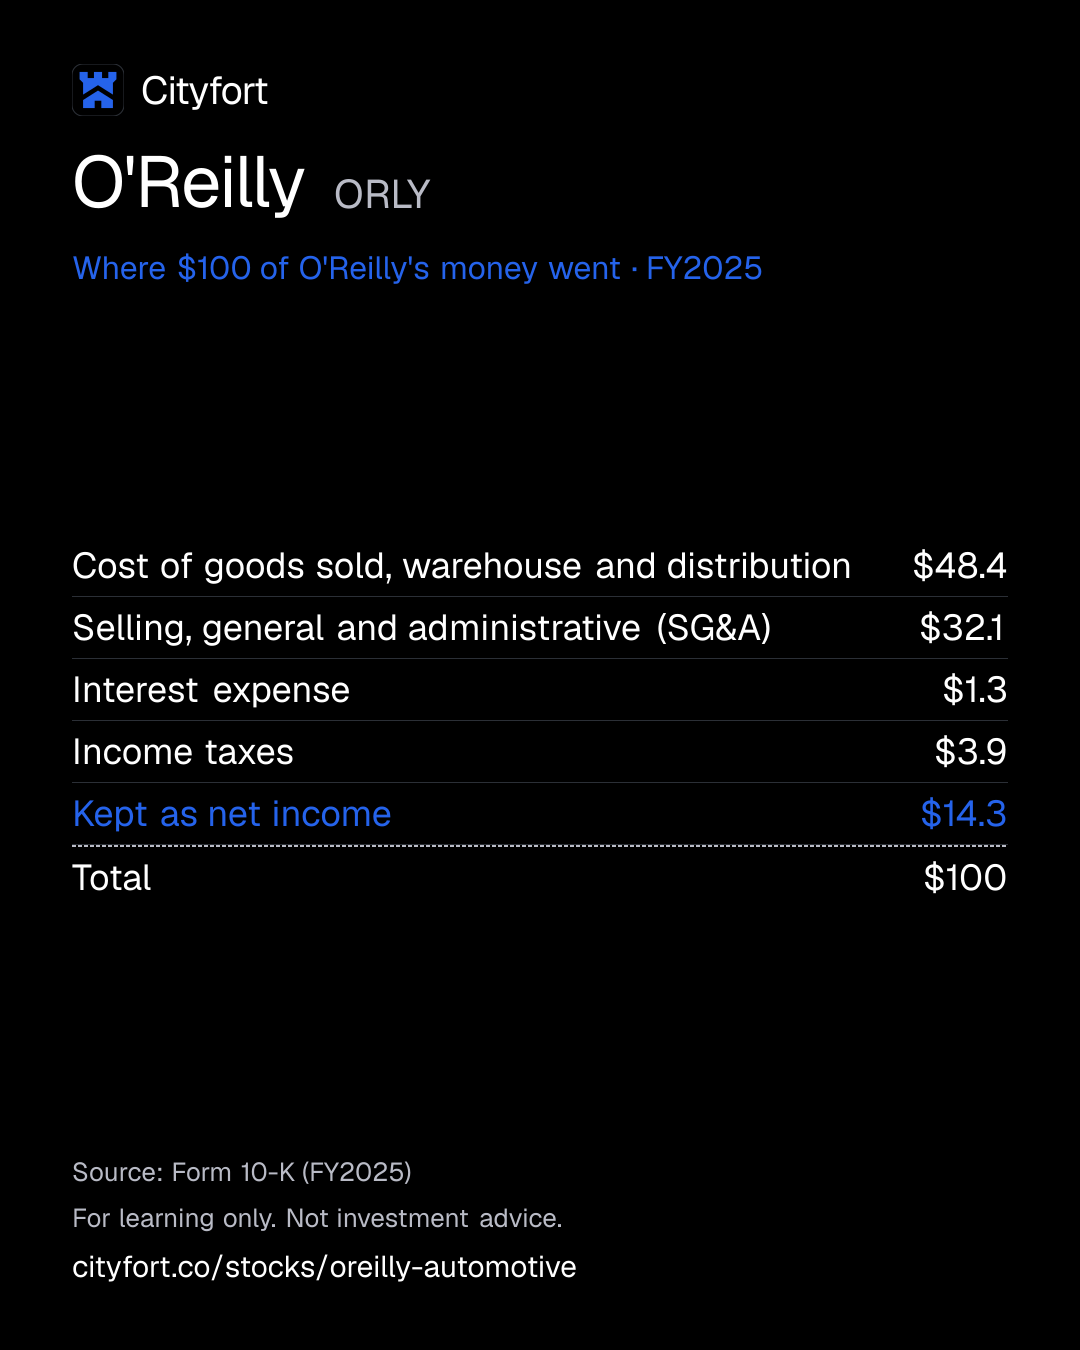
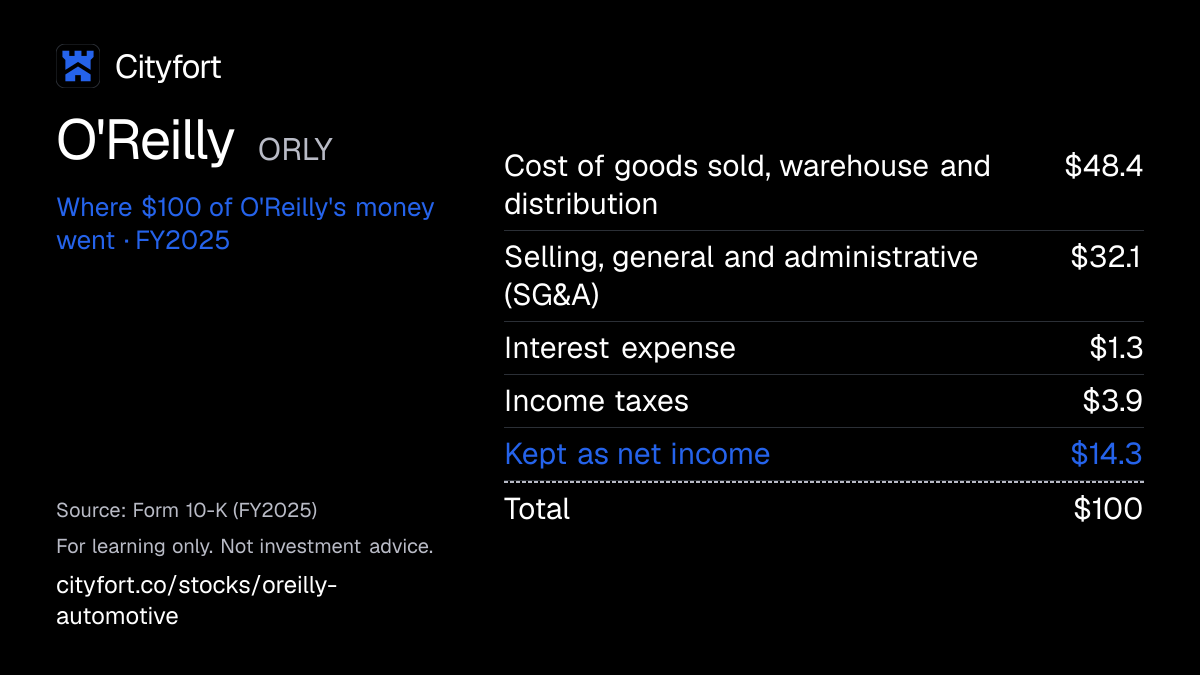
Where does $100 of O'Reilly's money go?
O'Reilly · FY2025
Receipt for every $100
| Cost of goods sold, warehouse and distribution | $48.4 |
|---|---|
| Selling, general and administrative (SG&A) | $32.1 |
| Interest expense | $1.3 |
| Income taxes | $3.9 |
| Kept as net income | $14.3 |
| Total | $100 |
Each line = amount ÷ total money in × 100. Lines may not add to exactly $100 because of rounding.
How this is worked out
Cityfort calculation from FY2025 10-K. Of every $100 that came in during FY2025 (sales plus $14.6 million of interest income and other): each line = line ÷ $17.80 billion × 100.
Save this receipt as an image
Embed this receipt or the key numbers
Paste this code into a blog or website to show the card you choose, with a link back to this page.
Each week: the next company due to report earnings, explained in 5 points.
No tips. Unsubscribe anytime.
We'll send a confirmation email. See our privacy policy.
02The business in one line
What does O'Reilly do?
Drivers and repair shops pay O'Reilly for car parts it keeps in stock near them. Of every $100, $48.4 pays for those parts and $14.3 is left as profit.
- People who fix their own cars and professional repair shops each paid about half of O'Reilly's $17.78 billion of FY2025 sales.
- Store staff, rent and other selling costs took $32.1 of every $100 in FY2025. O'Reilly pays no dividend and uses spare cash to buy back its own shares.
03Who pays it
Who pays O'Reilly?
DIY customers
49.3%
of revenue
People who buy parts in stores or online to fix their own cars. They paid $8.77 billion in FY2025, up from $8.47 billion in FY2024.
Professional service providers
48.7%
of revenue
Repair shops and other installers that order parts for their customers' cars. They paid $8.65 billion in FY2025, up from $7.84 billion in FY2024.
Other sales and adjustments
2.1%
of revenue
Sales to its own staff (Team Members) and to other parts retailers, equipment sales, and adjustments for discounts, rebates and returns. $365 million in FY2025.
- DIY customers49.3%
- Professional service providers48.7%
- Other sales and adjustments2.1%
How spread out the customers are
O'Reilly discloses no customer that is a large share of sales. On the buying side, its five largest suppliers were about 23% of its 2025 purchases.
Sources (1)
04How it makes money
How does O'Reilly make money?
Parts close at hand, with suppliers' credit carrying the shelves
O'Reilly keeps many parts in each store and refills them from 32 distribution centers, often the same day. Its unpaid supplier bills were larger than its inventory: 123.9% of it in FY2025, up from 114.5% in FY2021. Cash from sales then pays for new stores and share buybacks.
Accounts payable as a share of inventory
114.5%123.9%
FY2021 to FY2025
- Stores and Hub stores hold parts near drivers and repair shops
- Distribution centers refill stores the same day or overnight
- Parts on the shelf win sales from DIY customers and repair shops
- Supplier payment terms cover the cost of the inventory
- Cash from sales pays for new stores and buybacks
↺ Step 5 feeds back into step 1.
Sources (1)
05The numbers · Consolidated · US$
How has O'Reilly done?
Revenue
$17.8BFY2025
Sales rose in each year shown, from $13.3 billion in FY2021 to $17.8 billion in FY2025, and reached $5.1 billion in Q3 FY2026.
US$
See the numbers
Net income
$2.5BFY2025
Net income rose from $2.16 billion in FY2021 to $2.54 billion in FY2025; Q3 FY2026 includes a $39 million benefit from tariff refunds, the company said.
US$
See the numbers
Net income for every $100 of revenue
$14.3FY2025
Net income per $100 of sales fell from $16.2 in FY2021 to $14.3 in FY2024 and was $14.3 again in FY2025.
Net margin: $ of net income per $100 of revenue
See the numbers
Free cash flow
$1.6BFY2025
Free cash flow (operating cash minus capital spending) fell from $2.76 billion in FY2021 to $1.59 billion in FY2025, while capital spending rose from $443 million to $1.17 billion.
US$ · cash from operations minus spending on plants and equipment
See the numbers
See all yearly numbers
EBITDA here = operating income plus depreciation and amortization (from the cash flow statement). Fiscal years are the company's own: Fiscal year ends Dec 31. Net income is the share belonging to the company's owners.
Learn: Fiscal years that don't end in December: Nvidia's FY2027 explained · Stock-based compensation and dilution: pay that becomes shares
Sources (22)
- Form 10-K for FY2021
- Form 10-K for FY2025
- Form 10-K for FY2022
- Form 10-K for FY2023
- Form 10-K for FY2024
- Form 10-Q for Q1 FY2024
- Q1 FY2025 earnings release (8-K, Ex. 99.1)
- Form 10-Q for Q2 FY2024
- Form 10-Q for Q2 FY2025
- Q2 FY2025 earnings release (8-K, Ex. 99.1)
- Form 10-Q for Q3 FY2024
- Form 10-Q for Q3 FY2025
- Q3 FY2025 earnings release (8-K, Ex. 99.1)
- Q4 FY2025 earnings release (8-K, Ex. 99.1)
- Q4 FY2024 earnings release (8-K, Ex. 99.1)
- Form 10-Q for Q1 FY2025
- Form 10-Q for Q1 FY2026
- Q1 FY2026 earnings release (8-K, Ex. 99.1)
- Form 10-Q for Q2 FY2026
- Q2 FY2026 earnings release (8-K, Ex. 99.1)
- Form 10-Q for Q3 FY2026
- Q3 FY2026 earnings release (8-K, Ex. 99.1)
06Who runs it
Who runs O'Reilly, and did they deliver?
Brad Beckham
Chief Executive Officer · since 2024
Joined O'Reilly 29 years ago as a parts specialist. 2025 total pay in the proxy: $4.23 million.
Brent Kirby
President
Jeremy Fletcher
Executive Vice President and Chief Financial Officer
With O'Reilly for 20 years.
Greg Henslee
Executive Chairman
The 2026 proxy says he served as Chief Executive Officer from 2005 to 2018.
David O'Reilly
Executive Vice Chairman
A director since 1972. The 2026 proxy says he served as Chief Executive Officer from 1993 to 2005.
What they said, and what happened
1 delivered · 2 too early to tell
Said on Feb 28, 2025
O'Reilly said it expected 200 to 210 net new store openings in 2025.
DeliveredWhat happened
It opened 207 net new stores in 2025.
Said on Feb 27, 2026
O'Reilly said it expected 225 to 235 net new store openings in 2026.
Too early to tellWhat happened
173 net new stores in the first nine months of 2026; on Oct 28, 2026 the CEO said it was on track.
Said on Jul 29, 2026
O'Reilly guided 2026 comparable store sales growth of 4.0% to 6.0%.
Too early to tellWhat happened
Nine-month growth was 7.1%; on Oct 28, 2026 the range was raised to 5.5% to 6.5%.
07What could go wrong
What could go wrong for O'Reilly?
- Competition
Many sellers of the same parts
The 10-K lists AutoZone, Advance Auto Parts, NAPA, wholesalers, car dealers, Walmart and Amazon as rivals. It calls the market highly competitive.
Watch Comparable store sales: 7.2% in Q3 FY2026, against 5.6% a year earlier.
- Debt
More debt while buybacks continue
Debt rose from $6.02 billion at Dec 31, 2025 to $7.71 billion at Sep 30, 2026. The 10-K warns a credit downgrade would raise its cost of capital and could limit supplier financing programs.
Watch The company's adjusted debt to EBITDAR (profit before interest, tax, depreciation, amortization and rent): 2.26 times for the 12 months to Sep 30, 2026.
- Concentration
Reliance on suppliers and their credit
The five largest of more than 655 suppliers supplied about 23% of 2025 purchases. Supplier finance programs held $5.15 billion of O'Reilly invoices at Dec 31, 2025.
Watch Accounts payable to inventory: 121.8% at Sep 30, 2026, against 125.9% a year earlier.
- Regulation
Trade policy and tariffs
The 10-K names changes in trade policies as a supply risk. Q3 FY2026 results included a $39 million benefit from tariff refunds, the CEO said.
Watch Gross margin against the 51.6% to 52.1% of sales the company guided for FY2026 on Oct 28, 2026.
- Demand
Weather and the economy
O'Reilly says its business is partly seasonal, mainly because weather affects buying patterns. It also names economic conditions as a risk to costs and sales.
Watch Quarterly comparable store sales, against the 5.5% to 6.5% the company guided for FY2026 in its Oct 28, 2026 release.
- Technology
Systems and data
The 10-K says failures of its information systems, or a breach of customer or supplier data, could disrupt operations, harm its reputation or lead to litigation.
Watch Any 8-K reporting a cybersecurity incident.
08Supporters vs. critics
What do supporters and critics point to?
What supporters point to
- Sales rose in each year from FY2021 to FY2025, from $13.3 billion to $17.8 billion.
- Comparable store sales rose 7.2% in Q3 FY2026. Repair shop sales were $2.60 billion, against $2.31 billion a year earlier.
- O'Reilly added 207 net new stores in 2025, within the 200 to 210 it had said it expected.
- Unpaid supplier bills were 123.9% of inventory in FY2025, up from 114.5% in FY2021. Above 100% means the bills it still owed suppliers were larger than the stock it held.
- In FY2025, operating income was 14.7 times interest expense (Cityfort calculation from the FY2025 10-K).
What critics point to
- Debt exceeded cash by $7.52 billion at Sep 30, 2026 (Cityfort calculation from the Q3 FY2026 10-Q), and shareholders' equity was negative $2.09 billion.
- Free cash flow (operating cash minus capital spending) fell from $2.76 billion in FY2021 to $1.59 billion in FY2025 (Cityfort calculation from the FY2021 and FY2025 10-Ks), while capital spending rose from $443 million to $1.17 billion.
- The company said Q3 FY2026 results included a $39 million benefit from tariff refunds.
- The 10-K names AutoZone, Advance Auto Parts, NAPA, Walmart and Amazon among sellers of the same kinds of parts.
- O'Reilly's largest supplier was about 8% of its 2025 purchases, and the next four were each about 3% to 5%.
09What to watch next
What should you watch next at O'Reilly?
Next event
Q4 FY2026 results (expected; last year's came on Feb 4, 2026)
Feb 4, 2027
Expected, based on last year's date
Full-year comparable store sales
Comparable store sales rose 7.1% in the first nine months of FY2026. On Oct 28, 2026, O'Reilly said it expects 5.5% to 6.5% for the full year.
New stores
O'Reilly added 173 net new stores in the first nine months of 2026. On Oct 28, 2026, it said it expects 225 to 235 for the year.
Debt and buybacks
Debt was $7.71 billion at Sep 30, 2026. Buybacks were $1.51 billion in Q2 and $1.03 billion in Q3 FY2026, with $931.3 million of authorization left.
Tariff refunds
The company said Q3 FY2026 included a $39 million benefit from tariff refunds. Later releases will show whether such items recur.
10Key facts
Key facts about O'Reilly
- What does O'Reilly do?
- O'Reilly Automotive, Inc. runs auto parts stores in the US, Mexico and Canada. It sells replacement parts, tools, fluids and accessories, and had 6,585 stores at Dec 31, 2025.
- How does O'Reilly make money?
- O'Reilly Automotive makes money by selling parts for more than they cost. Of every $100 that came in during FY2025, $48.4 paid for the goods sold and $14.3 was left as net income, as shares of sales stated in the FY2025 10-K.
- Who are O'Reilly's customers?
- Two groups: people who fix their own cars (DIY) and professional repair shops. In FY2025, DIY customers paid $8.77 billion and professional customers $8.65 billion of its $17.78 billion of sales.
- How big is O'Reilly?
- In FY2025, the year to Dec 31, 2025, O'Reilly Automotive had sales of $17.78 billion and net income of $2.54 billion. It employed 92,923 Team Members at Jan 31, 2026.
- Who owns O'Reilly?
- O'Reilly Automotive has one class of common stock, with about 802 million shares outstanding on Nov 2, 2026. Its 2026 proxy lists The Vanguard Group with 8.5% and BlackRock with 6.9%, from filings of early 2024. Directors and executive officers as a group held under 1%.
- How much does O'Reilly borrow?
- On Sep 30, 2026, O'Reilly Automotive had $7.71 billion of debt and $194.4 million of cash, plus $2.58 billion of operating lease liabilities (Cityfort calculation from the Q3 FY2026 10-Q). Its shareholders' equity was negative $2.09 billion on that date.
- Does O'Reilly pay a dividend?
- No. O'Reilly Automotive has declared no cash dividend since its shares began trading on Nasdaq on Apr 22, 1993. It bought back $2,096.8 million of its own shares in FY2025.
Terms on this page
- Capital expenditures (capex)
- Earnings per share (EPS)
- EBITDA
- Free cash flow
- Net debt
- Net margin
- Revenue vs net income
- Stock buyback
Each explains the term in plain English, with the same number from other companies on Cityfort.
Go deeper
More detail from the same filings. Open any section.
11What it sells
11What it sells
What does O'Reilly sell?
Parts and maintenance items
New and rebuilt parts for repairs, plus maintenance items. Brands include Bosch, Denso and Monroe, and its own brands such as BrakeBest and Super Start.
Tools, paint and shop equipment
Automotive tools, auto body paint and related materials, and service equipment for professional repair shops.
Same-day delivery to repair shops
Repair shops order parts and O'Reilly delivers them the same day, usually to the shop. The sale is recorded on delivery.
Online ordering
Customers can order on OReillyAuto.com for shipping or store pickup; shops use OReillyPro.com. Online sales are counted with DIY sales.
What it does
- Does: Sells parts over the counter to drivers who do their own repairs (DIY, do-it-yourself)
- Does: Delivers parts to independent repair shops and other professional installers
- Does: Runs 32 distribution centers that restock its stores
What it does not do
- Does not: Does not repair cars itself; its professional customers do
- Does not: Does not make the parts; it buys them from more than 655 suppliers
- Does not: Does not pay a dividend; it has declared no cash dividend since its shares began trading in 1993
Sources (2)
12How the money flows
12How the money flows · FY2025
How does money flow through O'Reilly?
Money in
- Sales$17.8B
- Interest income and other, net$14.6M
The company
O'Reilly
$17.8B came in
Money out
- Cost of goods sold, including warehouse and distribution$8.6B
- Selling, general and administrative (SG&A)$5.7B
- Interest expense$235M
- Income taxes$702M
- Net income$2.5B
- Drivers and repair shops paid O'Reilly $17.78 billion for parts and supplies in FY2025.
- The goods it sold, plus warehouse and distribution costs, took $8.61 billion, leaving $9.17 billion of gross profit.
- Selling, general and administrative costs, which include store staff and rent, took $5.71 billion.
- That left $3.46 billion of operating income. Interest took $235 million and income tax $702 million.
- $2.54 billion was left as net income.
Sources (1)
13What it needs to run
13What it needs to run
What does O'Reilly need to run?
Stores
6,585 stores at Dec 31, 2025: 2,791 owned, 3,728 leased from unrelated landlords and 66 leased from entities linked to affiliated directors or their families. The average store is about 8,000 square feet with about 24,000 items.
Distribution centers and Hub stores
32 distribution centers stock more than 156,000 items and reach stores the same day or overnight. 399 larger Hub stores also restock nearby stores the same day.
Suppliers and their payment terms
More than 655 suppliers; the largest was about 8% of 2025 purchases. At Dec 31, 2025, $5.15 billion of O'Reilly's supplier invoices sat in supplier finance programs; the invoices in these programs generally have one-year terms.
Team Members
92,923 Team Members (staff) at Jan 31, 2026, of whom 76,467 worked in stores. The company says most senior, district and store managers were promoted from within.
Sources (2)
14Competitors and what protects it
14Competitors and what protects it
Who does O'Reilly compete with?
AutoZone
Named in O'Reilly's 10-K as a national retail and wholesale auto parts chain.
Advance Auto Parts
The 10-K puts it in the same group: a national retail and wholesale auto parts chain.
NAPA
Also a national chain. Some of the wholesalers and jobber stores (independent parts stores) that compete with O'Reilly are associated with NAPA.
Walmart
NASDAQ: WMT
The 10-K lists it as a mass merchandiser (a large general store) that carries replacement parts, maintenance items and accessories.
Amazon
NASDAQ: AMZN
An online retailer that carries the same kinds of parts and accessories, according to the 10-K.
What protects the business
Each strength is scored 1 (weak) to 5 (strong) for the business, with the reason. It is not a rating of the share.
- Distribution network4 of 5
32 distribution centers carry more than 156,000 items and reach stores the same day or overnight; 399 Hub stores add same-day access.
- Store count4 of 5
6,585 stores at Dec 31, 2025, in 48 US states, Puerto Rico, Mexico and Canada, after 207 net new stores in 2025.
- Supplier terms3 of 5
Accounts payable were 123.9% of inventory in FY2025, so supplier credit exceeded the stock on hand.
- Two customer groups3 of 5
The company says its 2025 sales were split about evenly between DIY customers and professional repair shops.
Weak spot
Capital-heavy model
The 10-K says its dual-market strategy needs significant capital for stores, distribution and inventory. Capital spending rose from $443 million in FY2021 to $1.17 billion in FY2025.
15Where growth could come from
15Where growth could come from
Where could O'Reilly's growth come from?
On Oct 28, 2026, O'Reilly raised its FY2026 outlook to comparable store sales growth of 5.5% to 6.5%, from 4.0% to 6.0% on Jul 29, 2026. It guided revenue of $19.0 billion to $19.3 billion, diluted EPS of $3.25 to $3.35 and 225 to 235 net new stores.
New stores
Working173 net new, 9M 2026
O'Reilly added 207 net new stores in 2025 and 173 in the first nine months of 2026. The CEO said on Oct 28, 2026 it was on track for 225 to 235 this year.
Status: Working, on track against what the company said.
Repair shop sales
Working$2.60B in Q3 FY2026
Professional sales were $2.60 billion in Q3 FY2026, against $2.31 billion a year earlier. The CEO cited double-digit growth in this business.
Status: Working, on track against what the company said.
DIY sales
Mixed$2.45B in Q3 FY2026
DIY sales were $2.45 billion in Q3 FY2026, against $2.30 billion a year earlier. The CEO cited mid-single-digit growth, slower than the professional side.
Status: Mixed, partly on track.
Comparable store sales
Working7.2% in Q3 FY2026
Sales at US stores open at least a year rose 7.2% in Q3 FY2026 and 7.1% in the first nine months. The company said on Oct 28, 2026 it expects 5.5% to 6.5% for the full year.
Status: Working, on track against what the company said.
Mexico and Canada
Early163 stores, Sep 30, 2026
O'Reilly had 134 stores in Mexico and 29 in Canada at Sep 30, 2026, against 25 in Mexico and none in Canada at the end of 2021.
Status: Early, too early to judge.
Status compares progress with what the company itself said it would do: Working = on track against what the company said; Mixed = partly on track; Behind = behind the company's own plan; New = recently announced; Early = too early to judge.
16The company's own measures (non-GAAP)
16The company's own measures · FY2025, Q3 FY2026 and Sep 30, 2026
What do O'Reilly's own measures show?
Official (GAAP): Net cash from operating activities, FY2025
$2.8B
Company's own measure: Free cash flow (company measure), FY2025
$1.6B
O'Reilly subtracts capital spending, the excess tax benefit from share-based pay and tax credit equity investments. Operating cash minus capital spending alone was $1,593 million.
Official (GAAP): Net cash from operating activities, Q3 FY2026
$559M
Company's own measure: Free cash flow (company measure), Q3 FY2026
$252M
Same definition. It was $297.0 million in Q3 FY2025.
Official (GAAP): Sales growth, Q3 FY2026
9.0%
Company's own measure: Comparable store sales growth, Q3 FY2026
7.2%
Sales at US stores open at least one year. It leaves out specialty machinery, sales to independent parts stores and sales to Team Members.
Official (GAAP): Debt (GAAP), Sep 30, 2026
$7.7B
Company's own measure: Adjusted debt, Sep 30, 2026
$11.0B
O'Reilly adds letters of credit, unamortized debt costs and six times yearly rent. Divided by its EBITDAR of $4.87 billion, that gives 2.26 times, against 2.04 a year earlier.
These are the company's own measures, defined by the company. They are not comparable across companies, and they are not added together. Each sits beside the nearest official (GAAP) figure.
Learn: Non-GAAP measures: what a company's "adjusted" numbers leave out
17Financial strength and debt
17Financial strength · Sep 30, 2026
How much debt does O'Reilly have?
- Total debt$7.7B
- Cash and investments$194M
- Net debt (debt minus cash)$7.5B
- Net worth (shareholders' money)−$2.1B
- Debt is senior notes and commercial paper. It leaves out $2.58 billion of operating lease liabilities (Cityfort calculation from Q3 FY2026 10-Q). Net debt is a Cityfort calculation from Q3 FY2026 10-Q.
- Shareholders' equity was negative $2.09 billion at Sep 30, 2026, after years of buybacks; the FY2025 10-K showed a retained deficit of $2.33 billion. Debt-to-equity is not meaningful.
- O'Reilly repaid $500 million of 3.550% notes on Mar 15, 2026. It issued $850 million of notes due 2036 in March, and $700 million, $500 million and $400 million of notes in August 2026.
- Nothing was borrowed on the $2.25 billion revolving credit line at Sep 30, 2026. Its covenants require fixed charge coverage of at least 2.50 times and leverage of at most 3.50 times.
- In FY2025, operating income was 14.7 times interest expense (Cityfort calculation from FY2025 10-K).
Sources (2)
18Who owns it
18Who owns it · ownership as of Mar 5, 2026
Who owns O'Reilly?
Share classes
Holders of 5% or more
From the company's proxy statement (DEF 14A), later Schedule 13G filings and the share counts on its latest annual or quarterly report. Each holder row shows the date of its own filing.
Learn: How to read a proxy statement (DEF 14A): Nvidia's 2026 proxy · Form 4 insider filings: who files, the codes and the footnotes
19What it does with profit
19What it does with profit
What does O'Reilly do with its profit?
Buyback · Dec 31, 2024
FY2024: bought back 29.0 million shares (split-adjusted) at an average of $71.50, for $2,076.5 million.
$2.1B
Buyback · Dec 31, 2025
FY2025: bought back 22.7 million shares at an average of $92.26, for $2,096.8 million.
$2.1B
Buyback · Mar 31, 2026
Q1 FY2026: bought back 10.0 million shares at an average of $92.45, for $923 million.
$923M
Buyback · Jun 30, 2026
Q2 FY2026: bought back 16.7 million shares at an average of $90.40, for $1.51 billion.
$1.5B
Buyback · Sep 30, 2026
Q3 FY2026: bought back 11.8 million shares at an average of $87.34, for $1.03 billion.
$1.0B
20Governance signals
20Governance signals
What do O'Reilly's governance filings show?
- Auditor
- Ernst & Young LLP, since 1992
- Auditor changes
- None in the period covered
- Audit qualifications
- None reported
- Related-party dealings
- O'Reilly leases 66 stores and one surplus property from entities that include affiliated directors or their family members. Lease payments were $4.6 million in 2025; the company says the terms are comparable to those from third parties.
- Credit rating
- No public credit rating found in a search of rating agency sites on Nov 20, 2026
Flags to know about
shares as collateral
O'Reilly shares as collateral
The 2026 proxy states a policy that bars its directors and named executive officers from hedging O'Reilly shares or using them as collateral for loans.
other
Former CEOs on the board
The 2026 proxy says David O'Reilly served as CEO from 1993 to 2005 and Greg Henslee from 2005 to 2018. They are now Executive Vice Chairman and Executive Chairman. Thomas Hendrickson is Lead Independent Director.
other
Say-on-pay votes
The proxy says say-on-pay, the shareholders' advisory vote on executive pay, received over 90% support in 2025 and has not fallen below 85% since 2011.
disclosure
What O'Reilly does not report
Filings give no sales by product category or by country, and the 10-K does not state credit ratings. No earnings-call transcripts or investor presentations were used for this page.
21How it got here
21How it got here
How did O'Reilly get here?
1957
Milestone
Founded by the O'Reilly family
The company was founded in 1957 by the O'Reilly family.
1993
Milestone
Shares listed on Nasdaq
Trading began on Apr 22, 1993. No cash dividend has been declared since.
2011
Business-model change
Buyback program starts
The board approved share repurchases in January 2011; total authorization reached $31.8 billion by 2026.
2018
Milestone
Regional chains acquired
O'Reilly bought Bond Auto Parts in 2016 and Bennett Auto Supply, with 33 stores, at the end of 2018.
2019
Business-model change
Into Mexico
The Mayasa acquisition added 21 stores in Mexico. O'Reilly had 134 stores there at Sep 30, 2026.
2024
Business-model change
Into Canada; new CEO
Buying Vast Auto in January 2024 added 23 stores in Canada. Brad Beckham became CEO in February 2024.
2025
Milestone
15-for-1 stock split
Each share became 15 on Jun 10, 2025. Per-share figures in the 10-Ks after the split are restated for it.
22Sources and changes
Where every number on this page comes from
Sources (23 documents)
- S1Form 10-Q for Q3 FY2026 · SEC EDGAR · Tier 1: company or exchange filing · Nov 6, 2026
- S2Form 10-Q for Q2 FY2026 · SEC EDGAR · Tier 1: company or exchange filing · Aug 7, 2026
- S3Form 10-Q for Q1 FY2026 · SEC EDGAR · Tier 1: company or exchange filing · May 8, 2026
- S4Form 10-K for FY2025 · SEC EDGAR · Tier 1: company or exchange filing · Feb 27, 2026
- S5Form 10-Q for Q3 FY2025 · SEC EDGAR · Tier 1: company or exchange filing · Nov 7, 2025
- S6Form 10-Q for Q2 FY2025 · SEC EDGAR · Tier 1: company or exchange filing · Aug 8, 2025
- S7Form 10-Q for Q1 FY2025 · SEC EDGAR · Tier 1: company or exchange filing · May 9, 2025
- S8Form 10-K for FY2024 · SEC EDGAR · Tier 1: company or exchange filing · Feb 28, 2025
- S9Form 10-Q for Q3 FY2024 · SEC EDGAR · Tier 1: company or exchange filing · Nov 8, 2024
- S10Form 10-Q for Q2 FY2024 · SEC EDGAR · Tier 1: company or exchange filing · Aug 8, 2024
- S11Form 10-Q for Q1 FY2024 · SEC EDGAR · Tier 1: company or exchange filing · May 9, 2024
- S12Form 10-K for FY2023 · SEC EDGAR · Tier 1: company or exchange filing · Feb 28, 2024
- S13Form 10-K for FY2022 · SEC EDGAR · Tier 1: company or exchange filing · Feb 28, 2023
- S14Form 10-K for FY2021 · SEC EDGAR · Tier 1: company or exchange filing · Feb 28, 2022
- S15Q3 FY2026 earnings release (8-K, Ex. 99.1) · SEC EDGAR · Tier 1: company or exchange filing · Oct 28, 2026
- S16Q2 FY2026 earnings release (8-K, Ex. 99.1) · SEC EDGAR · Tier 1: company or exchange filing · Jul 29, 2026
- S17Q1 FY2026 earnings release (8-K, Ex. 99.1) · SEC EDGAR · Tier 1: company or exchange filing · Apr 29, 2026
- S18Q4 FY2025 earnings release (8-K, Ex. 99.1) · SEC EDGAR · Tier 1: company or exchange filing · Feb 4, 2026
- S19Q3 FY2025 earnings release (8-K, Ex. 99.1) · SEC EDGAR · Tier 1: company or exchange filing · Oct 22, 2025
- S20Q2 FY2025 earnings release (8-K, Ex. 99.1) · SEC EDGAR · Tier 1: company or exchange filing · Jul 23, 2025
- S21Q1 FY2025 earnings release (8-K, Ex. 99.1) · SEC EDGAR · Tier 1: company or exchange filing · Apr 23, 2025
- S22Q4 FY2024 earnings release (8-K, Ex. 99.1) · SEC EDGAR · Tier 1: company or exchange filing · Feb 5, 2025
- S232026 proxy statement (DEF 14A) · SEC EDGAR · Tier 1: company or exchange filing · Mar 27, 2026
Changes to this page (v1 · Nov 20, 2026)
- v1 · Nov 20, 2026First version. (first version)
Numbers come only from tier 1 and tier 2 sources. Read how we research.
Disclaimer
For learning only. Cityfort is not a registered investment adviser or broker-dealer and does not recommend buying or selling any security. Prices shown are dated and may be out of date.
Investing in securities involves risk, including loss of capital. Before making any investment decision, do your own research and consider consulting a registered investment adviser or other qualified professional.
Cityfort, its owners and contributors may or may not hold securities of companies covered. Cityfort is not paid by any company it covers. Content is not an offer or solicitation to buy or sell any security, including in any initial public offering.
Read the positions policyRead the full disclaimerHide the full disclaimer
Cityfort publishes general educational content that explains how listed companies work. Cityfort is not registered with the US Securities and Exchange Commission or any state securities regulator as an investment adviser, and is not a broker-dealer or a member of FINRA. Cityfort does not provide investment, tax or legal advice, recommendations, ratings, price targets or any opinion on whether to buy, sell or hold any security. Nothing on the site is tailored to any person's circumstances.
All information is taken from publicly available sources, mainly company filings with the SEC, which are listed on each page with dates. We work to keep it accurate and correct errors publicly, but we do not guarantee that it is complete, accurate or up to date. Any market price or price-based ratio shown is dated, may be out of date by the time you read it, and is included only to explain concepts.
Statements by company management, including forward-looking statements and guidance, are reported as the company's statements, with their date and source; they are not our forecasts. Adjusted (non-GAAP) figures are the company's own measures and are shown next to the official (GAAP) figures.