Consumer Discretionary · NYSE: RCL
Royal Caribbean: how the business works
Royal Caribbean sells cruise vacations under the Royal Caribbean, Celebrity Cruises and Silversea brands, with a German joint venture making 69 ships in all, and had revenue of $17.94 billion in FY2025.
By Hardik Bhandare · Checked against filings: . Editorial policy. Corrections
Follow Royal Caribbean
Email me when Royal Caribbean's page is updated after earnings.
We'll send a confirmation email first. See our privacy policy.
Royal Caribbean Cruises Ltd. · Miami, Florida · Founded 1968
Updated for Q3 FY2026 · checked
- Revenue, FY2025
- $17.94B
- Net income, FY2025
- $4.27B
- Ships, Dec 31, 2025 (incl. joint venture)
- 69
- Guests carried, FY2025
- 9.45 million
- Employees, Dec 31, 2025
- About 108,000
The short version
Royal Caribbean in 5 points
1 · What it sells
Royal Caribbean sells cruise vacations under the Royal Caribbean, Celebrity Cruises and Silversea brands, with a German joint venture making 69 ships in all, and had revenue of $17.94 billion in FY2025.
2 · Who pays it
Cruise guests pay all of it: in FY2025 fares were 69.8% of revenue and onboard spending and other items, such as drinks, casinos, shore tours and insurance, were 30.2%.
3 · What it keeps from $100
Of every $100 that came in during FY2025, Royal Caribbean kept $23.2 as net income, which includes $414 million of joint venture profit (mainly TUI Cruises) outside operations, while operating income was $27.4 per $100 of revenue.
4 · Where the operating profit comes from
Royal Caribbean reports one business segment and no profit by brand or region, so its $4,910 million of FY2025 operating income comes from the whole fleet, where 64.4% of revenue was from North American sailings.
5 · The one thing to watch
At Sep 30, 2026 Royal Caribbean had $22,355 million of debt and $14,950 million of ship purchase obligations, and it has agreed to pay about $3.0 billion for half of Sandals.
Sources: From Royal Caribbean's FY2025 10-K, Q3 FY2026 10-Q and 8-K filed Sep 23, 2026 · checked
See the full receipt and the management scorecard below
01Where the money goes · FY2025
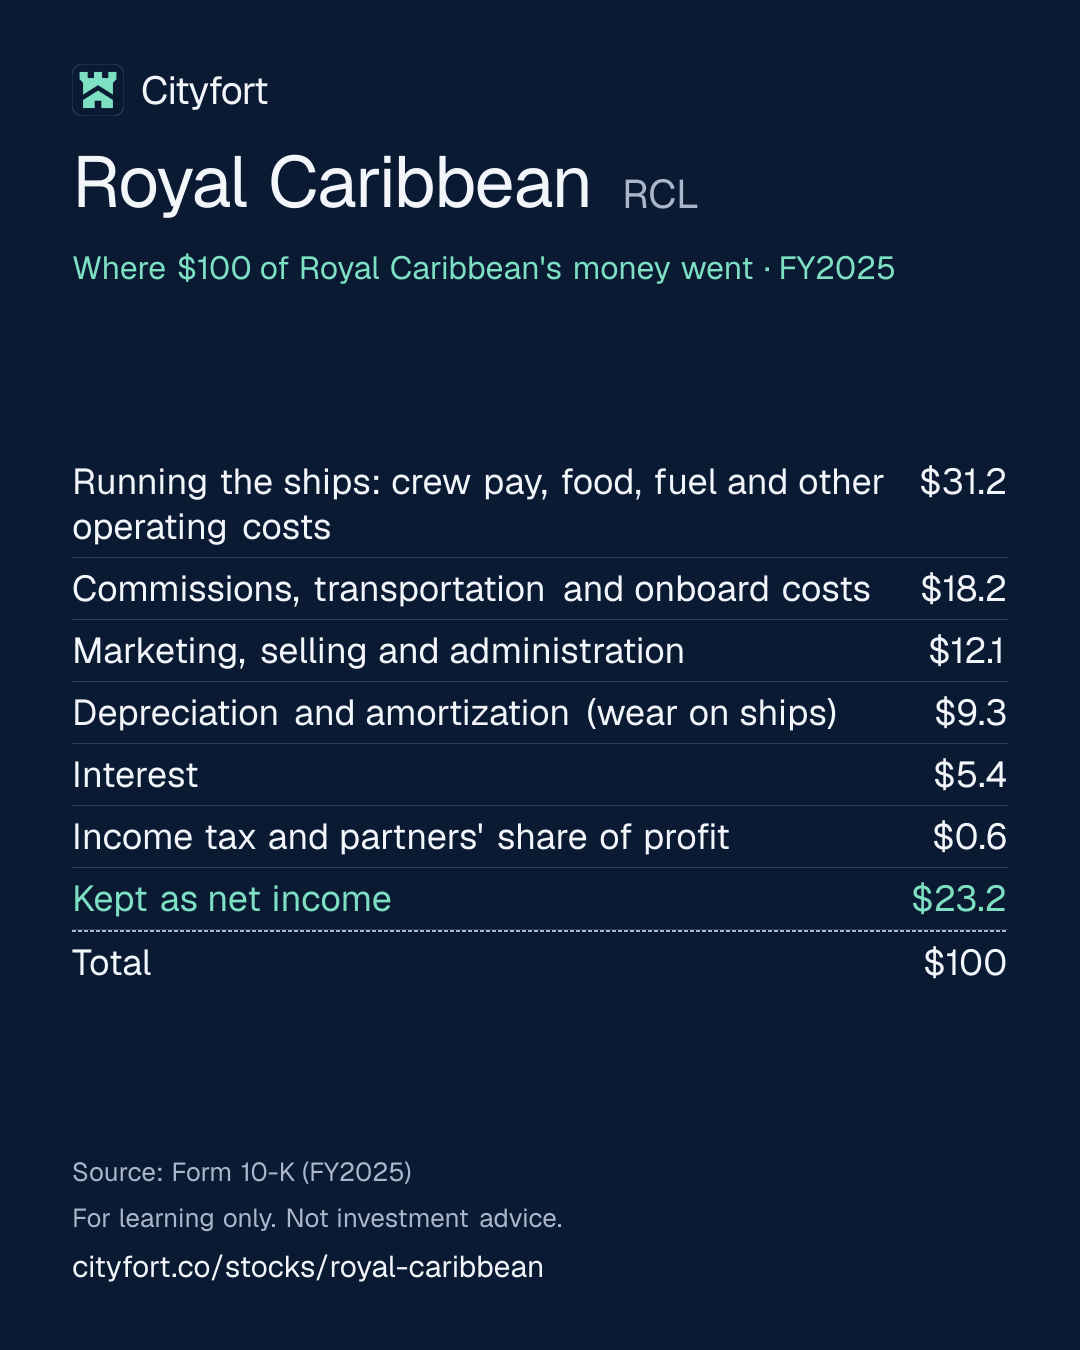
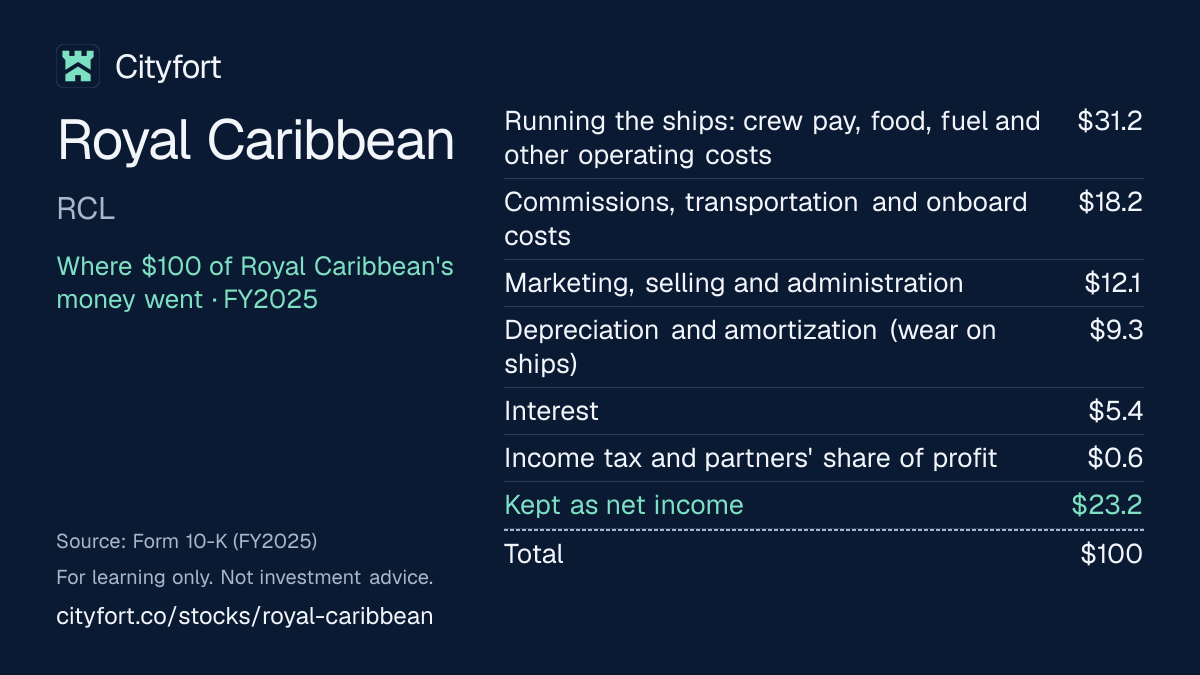
Where does $100 of Royal Caribbean's money go?
Royal Caribbean · FY2025
Receipt for every $100
| Running the ships: crew pay, food, fuel and other operating costs | $31.2 |
|---|---|
| Commissions, transportation and onboard costs | $18.2 |
| Marketing, selling and administration | $12.1 |
| Depreciation and amortization (wear on ships) | $9.3 |
| Interest | $5.4 |
| Income tax and partners' share of profit | $0.6 |
| Kept as net income | $23.2 |
| Total | $100 |
Each line = amount ÷ total money in × 100. Lines may not add to exactly $100 because of rounding.
How this is worked out
Cityfort calculation from the FY2025 10-K. Of every $100 that came in during FY2025 (revenue of $17,935 million plus $414 million of equity investment income, mainly TUI Cruises, $24 million of interest income and $17 million of other income): each line = line ÷ $18,390 million × 100. The last cost line is $82 million of income tax and $23 million of profit belonging to minority partners.
Save this receipt as an image:
1080 × 1350 PNG for Instagram, LinkedIn1200 × 675 PNG for X
Embed this receipt
Paste this code into a blog or website to show the receipt, with a link back to this page:
Each week: one company explained in 5 points, picked by earnings date.
Free, no tips, unsubscribe anytime.
We'll send a confirmation email. See our privacy policy.
02The business in one line
What does Royal Caribbean do?
Guests pay Royal Caribbean for cruise fares and for spending on board; most of the money goes on running the ships, travel agent commissions and marketing, and $23.2 of every $100 that came in during FY2025 was left as net income.
- In FY2025 cruise fares were 69.8% of revenue and onboard spending and other items 30.2%; guests who booked in the U.S. paid 74% of ticket revenue.
- Crew, fuel and wear on a ship cost much the same whether it sails full or not, so filling ships matters: occupancy was 109.7% in FY2025.
03Who pays it
Who pays Royal Caribbean?
Guests: cruise fares
70%
of revenue
Passenger ticket revenues of $12,515 million in FY2025, including $1.3 billion of port costs charged to guests. Guests who booked in the U.S. paid 74% of ticket revenue.
Guests: onboard spending and other
30%
of revenue
Onboard and other revenues of $5,419 million: goods and services on board, casinos, cancellation fees, vacation protection insurance, pre- and post-cruise tours and port operations.
- Guests: cruise fares70%
- Guests: onboard spending and other30%
How spread out the customers are
Royal Caribbean sells to millions of individual guests: 9.45 million in FY2025. No single customer is named; the U.S. was the only country paying more than 10% of ticket revenue (74%).
04Why it makes money
Why does Royal Caribbean make money?
Crew, fuel and wear on a ship cost much the same whether it sails full or not, so extra guests and onboard spending add mostly to profit.
Much of a sailing's cost is fixed once the ship leaves port. From FY2023 to FY2025 occupancy rose from 105.6% to 109.7% and Net Yields (the company's revenue-per-berth measure) from $236.38 to $273.51 a day, while operating income per $100 of revenue rose from $20.7 to $27.4.
Operating income per $100 of revenue
$20.7$27.4
FY2023 to FY2025
- New, larger ships add berths
- Ships sail full, with some cabins holding three or more guests
- Guests pay a fare, then spend more on board and at private destinations
- Higher prices and spending meet costs that are largely fixed per sailing
- Operating income pays interest and funds new ships, dividends and buybacks
- New ships and destinations draw more guests
↺ Step 6 feeds back into step 1.
05Business segments · FY2025
Which businesses make up Royal Caribbean?
North America
64%Royal Caribbean reports one business segment, so these are revenues by where the ships sailed, with no profit shown. North America includes the U.S., Canada, Mexico and the Caribbean.
Revenue $11.5B
Europe
17%Cruises sailing in Europe.
Revenue $3.0B
Asia/Pacific
10%Cruises sailing in Asia and the Pacific, up from $993 million in FY2023.
Revenue $1.7B
Other regions
5%Mainly South America and Antarctica.
Revenue $862M
Other revenues
5%Not tied to a sailing region: cancellation fees, vacation protection insurance, pre- and post-cruise tours and port operations.
Revenue $864M
How the mix changed
- North America
- Europe
- Asia/Pacific
- Other regions
- Other revenues
Revenue by segment, FY2021 to FY2025.
US$
See the numbers
06The numbers · Consolidated · US$
How has Royal Caribbean done?
Revenue
$17.9BFY2025
Revenue rose every year from $1.53 billion in FY2021, while cruising restarted after the 2020 pause, to $17.94 billion in FY2025; since FY2022 the July to September quarter has been the largest each year.
US$
See the numbers
Net profit
$4.3BFY2025
Royal Caribbean lost $5,260 million in FY2021 and $2,156 million in FY2022 as cruising restarted, then earned $1,697 million in FY2023 and $4,268 million in FY2025.
US$
See the numbers
Profit kept per $100 of revenue
$23.8FY2025
FY2021 and FY2022 margins reflect the restart years rather than normal sailing; EBITDA (operating income plus depreciation) was $37.0 per $100 of revenue in FY2025, up from $31.2 in FY2023.
$ of profit per $100 of revenue (net margin)
See the numbers
Free cash flow
$1.2BFY2025
Free cash flow (cash from operations minus capital expenditures) was $1,236 million in FY2025, down from $1,997 million in FY2024, as spending rose to $5,229 million with two new ships and the Costa Maya port.
US$ · cash from operations minus spending on plants and equipment
See the numbers
See all yearly numbers
EBITDA here = operating income plus depreciation and amortization (from the cash flow statement). Fiscal years are the company's own (Calendar year (Dec 31); quarters end Mar 31, Jun 30, Sep 30 and Dec 31). Net profit is the share belonging to the company's owners.
Download Royal Caribbean's yearly and quarterly numbers (CSV, with source ids)
Learn: Fiscal years that don't end in December: Nvidia's FY2027 explained · Stock-based compensation and dilution: pay that becomes shares
Sources (9)
- Form 10-K, fiscal year 2023 (ended Dec 31, 2023)
- Form 10-K, fiscal year 2025 (ended Dec 31, 2025)
- Q4 and full-year 2025 earnings release (8-K Exhibit 99.1, Jan 29, 2026)
- Q1 2026 earnings release (8-K Exhibit 99.1, Apr 30, 2026)
- Q2 2026 earnings release (8-K Exhibit 99.1, Jul 28, 2026)
- Q3 2026 earnings release (8-K Exhibit 99.1, Oct 27, 2026)
- Form 10-Q, Q1 2026 (quarter ended Mar 31, 2026)
- Form 10-Q, Q2 2026 (quarter ended Jun 30, 2026)
- Form 10-Q, Q3 2026 (quarter ended Sep 30, 2026)
07Who runs it
Who runs Royal Caribbean, and did they deliver?
Jason T. Liberty
Chairman and Chief Executive Officer · since 2022
CEO since January 2022 and also Chairman since November 2025; with the company since 2005 and CFO from 2013. Total 2025 pay was $23,978,813.
Naftali Holtz
Chief Financial Officer · since 2022
CFO since January 2022; joined in 2019 from Goldman Sachs.
Richard D. Fain
Director · since 1981
Chairman and CEO from 1988 to January 2022, and Chairman until November 2025; still a director.
John F. Brock
Lead Independent Director
Named Lead Independent Director in the 2026 proxy. Two directors joined in 2026: Christopher Wiernicki in February and Tara Bunch in July.
What they said, and what happened
3 delivered · 3 too early to tell
Said on Jan 29, 2026
In its Q4 FY2025 earnings release, Royal Caribbean said it expected Q1 FY2026 Adjusted EPS (a company measure) of $3.18 to $3.28.
DeliveredWhat happened
Q1 FY2026 Adjusted EPS was $3.60; GAAP diluted EPS was $3.48.
Said on Apr 30, 2026
In its Q1 FY2026 earnings release, Royal Caribbean said it expected Q2 FY2026 Adjusted EPS of $3.83 to $3.93.
DeliveredWhat happened
Q2 FY2026 Adjusted EPS was $4.21; GAAP diluted EPS was $4.20.
Said on Jul 28, 2026
In its Q2 FY2026 earnings release, Royal Caribbean said it expected Q3 FY2026 Adjusted EPS of $6.26 to $6.36.
DeliveredWhat happened
Q3 FY2026 Adjusted EPS was $6.57; GAAP diluted EPS was $6.45.
Said on Jan 29, 2026
In January 2026 Royal Caribbean gave FY2026 Adjusted EPS guidance of $17.70 to $18.10. It cut this to $17.10 to $17.50 on Apr 30, 2026, saying the new range reflected higher fuel costs and the effect of geopolitical events on TUI Cruises' Middle Eastern itineraries, partly offset by lower non-fuel costs and recent share buybacks.
Too early to tellWhat happened
The Oct 27, 2026 guidance was $17.85 to $17.95, within the January range. Full-year results are due after the year ends.
Said on Oct 27, 2026
Under its Perfecta program, Royal Caribbean targets 20% average annual Adjusted EPS growth from 2024 to 2027 and return on invested capital of 17% or higher by the end of 2027.
Too early to tellWhat happened
The company reported ROIC (its own measure) of 18.0% for FY2025; Adjusted EPS was $11.80 in FY2024 and $15.64 in FY2025.
Said on Feb 11, 2026
Royal Caribbean said its private destinations would expand from 3 to 8 by 2028, including Perfect Day Mexico, expected to open in 2027.
Too early to tellWhat happened
On May 20, 2026 the company said Mexico's environment ministry would deny its first permit application for Perfect Day Mexico, and that it would re-engage stakeholders.
Sources (9)
- 2026 proxy statement (DEF 14A)
- Form 10-K, fiscal year 2025 (ended Dec 31, 2025)
- 8-K filed Feb 17, 2026: Christopher Wiernicki appointed director (Item 5.02)
- 8-K filed Jul 20, 2026: Tara Bunch appointed director (Item 5.02)
- Q4 and full-year 2025 earnings release (8-K Exhibit 99.1, Jan 29, 2026)
- Q1 2026 earnings release (8-K Exhibit 99.1, Apr 30, 2026)
- Q2 2026 earnings release (8-K Exhibit 99.1, Jul 28, 2026)
- Q3 2026 earnings release (8-K Exhibit 99.1, Oct 27, 2026)
- 8-K filed May 20, 2026: statement on SEMARNAT and Perfect Day Mexico permits (Item 7.01)
08What could go wrong
What could go wrong for Royal Caribbean?
- Debt
Debt and new ship commitments
Total debt was $22,355 million at Sep 30, 2026, with $2.4 billion due in 2027 and $3.2 billion in 2028. Ship purchase obligations were another $14,950 million, and a $3.0 billion loan is committed for the Sandals stake.
Watch Total debt and scheduled maturities in each earnings release, and new note issues in 8-Ks.
- Raw-material prices
Fuel prices
Fuel cost $1,146 million in FY2025. In April 2026 the company raised its FY2026 fuel estimate to about $1.3 billion; its October estimate was $1,345 million; 58% of the rest of 2026 was hedged.
Watch Fuel expense and the hedged share in each earnings release.
- Demand
Wars, unrest and travel demand
On Apr 30, 2026 the company said bookings for the Mediterranean and the West Coast of Mexico had moderated in March and early April after geopolitical developments and had since recovered; the same release cut its FY2026 Adjusted EPS guidance, citing fuel costs and TUI Cruises' Middle Eastern itineraries. Terrorism, war and weather are named risk factors in the 10-K.
Watch Net Yields growth and booking comments in each earnings release.
- Other
Disease outbreaks
Cruising was suspended in 2020 and restarted slowly through mid-2022. Occupancy was 49.3% in FY2021, and the company lost $5,260 million that year.
Watch Health-related itinerary changes or sailing pauses in 8-Ks and earnings releases.
- Competition
More cruise ships across the industry
At Dec 31, 2025, 47 new ships with about 113,000 berths were on order across the cruise industry for delivery through 2029, the 10-K said. Royal Caribbean's brands and TUI Cruises had twelve ships on order, for delivery from 2026 to 2032. The 10-K says extra capacity without more demand could push prices down.
Watch Net Yields compared with capacity growth in each earnings release.
- Execution
New ventures and permits
The company plans to grow private destinations from 3 to 8 by 2028, but said in May 2026 that Mexico would deny its first permit application for Perfect Day Mexico. The $3.0 billion Sandals stake still needs approvals.
Watch Permit news on Perfect Day Mexico and the Sandals closing, expected in early 2027.
- Legal
Havana Docks lawsuit
Havana Docks Corporation sued in August 2019 under the Helms-Burton Act, alleging the company trafficked in an expropriated Havana cruise terminal by using it for passengers. A $112 million judgment of December 2022 was reversed on appeal in October 2024; on May 21, 2026 the U.S. Supreme Court vacated that ruling and sent the case back.
Watch Case updates in the legal proceedings note of each 10-Q; the company calls the outcome inherently unpredictable.
Sources (7)
- Form 10-Q, Q3 2026 (quarter ended Sep 30, 2026)
- Q3 2026 earnings release (8-K Exhibit 99.1, Oct 27, 2026)
- Form 10-K, fiscal year 2025 (ended Dec 31, 2025)
- Q1 2026 earnings release (8-K Exhibit 99.1, Apr 30, 2026)
- Form 10-K, fiscal year 2023 (ended Dec 31, 2023)
- 8-K filed Sep 23, 2026: agreement to acquire 50% of Sandals and Beaches Resorts (Item 8.01, Exhibit 99.1)
- 8-K filed May 20, 2026: statement on SEMARNAT and Perfect Day Mexico permits (Item 7.01)
09Both sides
What do supporters and critics point to?
What supporters point to
- Revenue rose from $13,900 million in FY2023 to $17,935 million in FY2025, and net income from $1,697 million to $4,268 million.
- Occupancy was 112.4% in Q3 FY2026, and the company said in its Oct 27, 2026 earnings release that 2027 bookings were pacing ahead of historical levels at higher rates.
- Equity investment income, mainly TUI Cruises, rose from $200 million in FY2023 to $414 million in FY2025.
- Quarterly Adjusted EPS (a company measure) came in above the company's own guidance range in each quarter of FY2026 so far; GAAP diluted EPS was $6.45 in Q3 FY2026.
- The dividend was reinstated in 2024 and reached $1.50 a share a quarter in 2026.
What critics point to
- Total debt was $22,355 million at Sep 30, 2026, against $851 million of cash, before the $3.0 billion Sandals purchase.
- Net Yields growth slowed from 3.6% in Q1 FY2026 to 0.9% in Q3 FY2026.
- Free cash flow was $1,236 million in FY2025 while buybacks and dividends paid were $1,983 million.
- Fuel cost $355 million in Q2 FY2026, up from $279 million a year earlier.
- Mexico's environment ministry said in May 2026 it would deny the first permit application for Perfect Day Mexico.
10What to watch next
What should you watch next at Royal Caribbean?
Next event
Q4 FY2026 results
Date not announced yet.
Net Yields against new capacity
Net Yields rose 0.9% in Q3 FY2026 while capacity rose 8%. The company's October 2026 outlook is for about 2.7% Net Yields growth in FY2026.
The Sandals deal
The 50% stake for about $3.0 billion is expected to close in early 2027, funded by a committed loan; its profit would be reported one quarter late.
Fuel costs
Fuel was $1,146 million in FY2025; the company's October 2026 estimate for FY2026 is $1,345 million, with 53% of 2027 fuel hedged.
11Key dates
What are the key dates for Royal Caribbean?
| Event | Date | Source |
|---|---|---|
| Expected closing of the 50% Sandals and Beaches Resorts stakeEarly 2027, subject to customary approvals, as stated in the 8-K filed Sep 23, 2026. | Not yet stated | 8-K filed Sep 23, 2026: agreement to acquire 50% of Sandals and Beaches Resorts (Item 8.01, Exhibit 99.1) |
| Celebrity River Cruises launchPlanned for 2027, according to the FY2025 10-K. | Not yet stated | Form 10-K, fiscal year 2025 (ended Dec 31, 2025) |
12Key facts
Key facts about Royal Caribbean
- What does Royal Caribbean do?
- Royal Caribbean Cruises Ltd. runs the Royal Caribbean, Celebrity Cruises and Silversea cruise brands and owns 50% of TUI Cruises, a German joint venture. Together they had 69 ships with about 179,720 berths at Dec 31, 2025. Royal Caribbean carried 9.45 million guests in FY2025 and had revenue of $17.94 billion.
- How does Royal Caribbean make money?
- Royal Caribbean makes money from cruise fares and from what guests spend on board. In FY2025 passenger ticket revenues were $12,515 million (69.8% of revenue) and onboard and other revenues, such as drinks, casinos, shore tours and vacation protection insurance, were $5,419 million (30.2%).
- Who are Royal Caribbean's customers?
- Royal Caribbean's customers are individual cruise guests, many of whom book through travel advisors. Guests who booked in the U.S. paid 74% of Royal Caribbean's passenger ticket revenue in FY2025, and no other country paid more than 10%.
- Is Royal Caribbean profitable?
- Yes. Royal Caribbean had operating income of $4,910 million and net income of $4,268 million in FY2025, on revenue of $17,935 million. In Q3 FY2026 (the quarter to Sep 30, 2026) net income was $1,728 million, up from $1,575 million a year earlier. It lost $5,260 million in FY2021, when cruising was restarting.
- What is Royal Caribbean's revenue by segment?
- Royal Caribbean reports one business segment. By where its ships sailed, FY2025 revenue was 64.4% North America (including the Caribbean), 16.5% Europe, 9.6% Asia/Pacific and 4.8% other regions, with another 4.8% from items such as cancellation fees, insurance and port operations.
- How much does Royal Caribbean earn from onboard spending?
- Royal Caribbean's onboard and other revenues were $5,419 million in FY2025, 30.2% of revenue, up from $4,332 million in FY2023. The direct cost of those sales was $981 million in FY2025. In Q3 FY2026 onboard and other revenues were $1,706 million.
- How much does Royal Caribbean earn from cruise tickets?
- Royal Caribbean's passenger ticket revenues were $12,515 million in FY2025, up from $9,568 million in FY2023. They include $1.3 billion of port costs charged to guests in FY2025. In Q3 FY2026 ticket revenues were $3,885 million.
- How much does Royal Caribbean earn from TUI Cruises?
- Royal Caribbean owns 50% of TUI Cruises and records its share of the profit, not its sales. Equity investment income, mainly from TUI Cruises, was $414 million in FY2025, up from $200 million in FY2023.
- Who owns Royal Caribbean?
- Royal Caribbean Cruises Ltd. has one class of common stock with one vote per share. Filings show Capital International Investors with 9.5% and Capital World Investors with 7.6% (Mar 31, 2026), BlackRock with 7.5%, Vanguard Capital Management with 6.86% (Mar 31, 2026), Capital Research Global Investors with 6.4% (Sep 30, 2026) and AWILHELMSEN AS, a Wilhelmsen family company, with 6.1% (Mar 31, 2026).
- How much debt does Royal Caribbean have?
- Royal Caribbean had total debt of $22,355 million and cash of $851 million at Sep 30, 2026, all of the debt unsecured. Ship purchase obligations for ships on order were $14,950 million at that date.
Sources (10)
- Form 10-K, fiscal year 2025 (ended Dec 31, 2025)
- Form 10-K, fiscal year 2023 (ended Dec 31, 2023)
- Q3 2026 earnings release (8-K Exhibit 99.1, Oct 27, 2026)
- 2026 proxy statement (DEF 14A)
- Schedule 13G/A (Amendment 8), Capital Research Global Investors: 17,152,902 shares, 6.4%, as of Sep 30, 2026
- Schedule 13G/A (Amendment 6), Capital International Investors: 25,763,011 shares, 9.5%, as of Mar 31, 2026
- Schedule 13G/A (Amendment 2), Capital World Investors: 20,614,423 shares, 7.6%, as of Mar 31, 2026
- Schedule 13G, Vanguard Capital Management: 18,582,413 shares, 6.86%, as of Mar 31, 2026
- Schedule 13G/A (Amendment 7), AWILHELMSEN AS: 16,435,910 shares, 6.1%, as of Mar 31, 2026
- Form 10-Q, Q3 2026 (quarter ended Sep 30, 2026)
Terms on this page
- Capital expenditures (capex)
- Debt-to-equity
- Dividend payout ratio
- Earnings per share (EPS)
- EBITDA
- Free cash flow
- Interest coverage
- Market cap
- Net debt
- Net margin
Each explains the term in plain English, with the same number from other companies on Cityfort.
Go deeper
More detail from the same filings. Open any section.
13What it sells
13What it sells
What does Royal Caribbean sell?
Royal Caribbean (29 ships)
The family and couples brand, with cruises of generally three to 14 nights; the 10-K calls it the world's largest cruise vacation brand. About 111,000 berths at Dec 31, 2025, with four ships on order.
Celebrity Cruises (15 ships)
A premium cruise brand with about 38,900 berths at Dec 31, 2025. Celebrity River Cruises is set to launch in 2027.
Silversea (12 ships)
Smaller luxury and expedition ships, about 5,500 berths at Dec 31, 2025, including Antarctica expeditions.
TUI Cruises (50% joint venture)
TUI Cruises and Hapag-Lloyd Cruises, two German brands, had 13 ships at Dec 31, 2025. Royal Caribbean records half of the joint venture's profit, not its sales.
Private destinations
Perfect Day at CocoCay and Royal Beach Club Paradise Island in Nassau, Bahamas, are among three in operation; the company plans 8 by 2028.
What it does
- Does: Owns and runs its ships, and orders new ones from shipyards years ahead
- Does: Sells onboard extras such as drinks, specialty dining, casinos, shore tours and vacation protection insurance
- Does: Runs private destinations and some port facilities, such as the Port of Costa Maya in Mexico bought in July 2025
What it does not do
- Does not: Does not count TUI Cruises' sales as its revenue: it books half of that joint venture's profit as equity investment income
- Does not: Does not own Sandals and Beaches Resorts: it agreed in September 2026 to buy 50%, with closing expected in early 2027
- Does not: Does not rely only on its own sales: travel advisors are a significant sourcing channel of bookings, according to the FY2025 10-K
14How the money flows
14How the money flows · FY2025
How does money flow through Royal Caribbean?
Money in
- Cruise fares (passenger ticket revenues)$12.5B
- Onboard and other revenues$5.4B
- Share of TUI Cruises and other joint venture profit, interest and other income$455M
The company
Royal Caribbean
$18.4B came in
Money out
- Running the ships: crew pay, food, fuel and other operating costs$5.7B
- Commissions, transportation and onboard costs$3.4B
- Marketing, selling and administration$2.2B
- Depreciation and amortization (wear on ships)$1.7B
- Interest$992M
- Income tax and partners' share of profit$105M
- Net income$4.3B
- Guests paid $12.5 billion in cruise fares and $5.4 billion for onboard spending and other items in FY2025.
- Running the ships took $5.7 billion, including $1,366 million of payroll, $1,019 million of food and $1,146 million of fuel.
- Travel agent commissions, guest transportation and onboard costs took $3.4 billion, and marketing and administration $2.2 billion.
- Wear on the ships (depreciation) was $1.7 billion, leaving $4,910 million of operating income.
- Joint ventures, mainly TUI Cruises, added $414 million and interest and other income $41 million; after $992 million of interest, $82 million of tax and $23 million owed to minority partners, $4,268 million was left.
15What it needs to run
15What it needs to run
What does Royal Caribbean need to run?
Ships
69 ships with about 179,720 berths across its brands and TUI Cruises at Dec 31, 2025. Ship purchase obligations for ships on order were $14,950 million at Sep 30, 2026.
Fuel
Fuel cost $1,146 million in FY2025. In Q3 FY2026 the ships used 446,000 metric tons at $778 a ton after hedging.
Crew
About 96,500 shipboard employees at Dec 31, 2025, about 87% of them covered by collective bargaining agreements, plus about 11,400 full-time shoreside staff.
Ports and private destinations
Ships call on more than 1,000 destinations. Royal Caribbean runs three private destinations and plans 8 by 2028.
Travel advisors
Travel advisors are a significant sourcing channel of bookings, paid through commissions and incentives, according to the FY2025 10-K.
Borrowed money
Total debt was $22,355 million at Sep 30, 2026, all unsecured. Many ship loans are 95% to 100% guaranteed by export credit agencies such as Finnvera, Euler Hermes and BpiFrance.
16Competitors and what protects it
16Competitors and what protects it
Who does Royal Caribbean compete with?
Carnival Corporation & plc
Named in Royal Caribbean's FY2025 10-K as a principal cruise competitor; its brands include Carnival Cruise Line, Princess Cruises, Holland America Line, Costa Cruises and AIDA Cruises.
Norwegian Cruise Line Holdings
Named in the FY2025 10-K as a principal cruise competitor; it owns Norwegian Cruise Line, Oceania Cruises and Regent Seven Seas Cruises.
MSC Cruises
Named in the FY2025 10-K as a principal cruise competitor.
Disney Cruise Line
Named in the FY2025 10-K as a principal cruise competitor.
Viking
Named in the FY2025 10-K as a principal cruise competitor, alongside Virgin Voyages.
What protects the business
Each strength is scored 1 (weak) to 5 (strong) for the business, with the reason. It is not a rating of the share.
- Size of the fleet4 of 5
69 ships with about 179,720 berths at Dec 31, 2025, with twelve more on order at Dec 31, 2025 for its brands and TUI Cruises, for delivery from 2026 to 2032.
- Private destinations3 of 5
Three private destinations in operation, with plans for 8 by 2028; Mexico's environment ministry said in May 2026 it would deny the first permit application for Perfect Day Mexico.
- Full ships3 of 5
Occupancy was 109.7% in FY2025 and 112.4% in Q3 FY2026, meaning some cabins held three or more guests.
- Access to ship financing3 of 5
Many ship loans are 95% to 100% guaranteed by export credit agencies, and the company had about $17 billion of committed financing for ships on order at Sep 30, 2026.
Weak spot
Fixed costs and debt when sailing stops
When cruising was suspended in 2020 and restarted slowly, Royal Caribbean lost $5,260 million in FY2021. Total debt was $22,355 million at Sep 30, 2026.
17Where growth could come from
17Where growth could come from
Where could Royal Caribbean's growth come from?
In its Q3 FY2026 earnings release (Oct 27, 2026), Royal Caribbean said it expects FY2026 revenue to rise about 9%, Adjusted EPS (a company measure) of $17.85 to $17.95, and capital expenditure of about $4.6 billion. It expects capacity to grow about 4.5% in 2027 and 6.0% in 2028.
New ships
WorkingCapacity +8%, Q3 FY2026
Legend of the Seas joined the fleet in Q2 FY2026, after Star of the Seas and Celebrity Xcel in 2025. The number of guests rose 9% in Q3 FY2026, the company said.
Status: Working, on track against what the company said.
Prices and onboard spending
MixedNet Yields +0.9%, Q3 FY2026
Net Yields (the company's revenue per berth per day, after commissions and onboard costs) rose 3.6% in Q1 FY2026, 1.9% in Q2 and 0.9% in Q3, as reported, after 3.8% in FY2025.
Status: Mixed, partly on track.
Private destinations
Mixed3 operating, 8 planned by 2028
Royal Beach Club Paradise Island opened in December 2025. Perfect Day Mexico was expected to open in 2027, but in May 2026 the company said Mexico's environment ministry would deny its first permit application.
Status: Mixed, partly on track.
Sandals and Beaches Resorts
New50% stake for about $3.0 billion
Agreed on Sep 23, 2026, paid in cash with a committed loan from Morgan Stanley; expected to close in early 2027, subject to approvals. It would be accounted for like TUI Cruises, as a share of profit.
Status: New, recently announced.
Celebrity River Cruises
EarlyLaunch planned for 2027
Ten river ships committed, then ten more in January 2026, according to the company's filings.
Status: Early, too early to judge.
Status compares progress with what the company itself said it would do: Working = on track against what the company said; Mixed = partly on track; Behind = behind the company's own plan; New = recently announced; Early = too early to judge.
Sources (7)
- Q3 2026 earnings release (8-K Exhibit 99.1, Oct 27, 2026)
- Form 10-K, fiscal year 2025 (ended Dec 31, 2025)
- Q2 2026 earnings release (8-K Exhibit 99.1, Jul 28, 2026)
- Q1 2026 earnings release (8-K Exhibit 99.1, Apr 30, 2026)
- 8-K filed May 20, 2026: statement on SEMARNAT and Perfect Day Mexico permits (Item 7.01)
- 8-K filed Sep 23, 2026: agreement to acquire 50% of Sandals and Beaches Resorts (Item 8.01, Exhibit 99.1)
- Form 10-Q, Q3 2026 (quarter ended Sep 30, 2026)
18The company's own measures (non-GAAP)
18The company's own measures · FY2025 and Q3 FY2026
What do Royal Caribbean's own measures show?
Official (GAAP): Operating income, FY2025
$4.9B
Company's own measure: Adjusted EBITDA, FY2025 (Royal Caribbean's measure)
$7.0B
Royal Caribbean adds back depreciation and amortization, interest and tax, and includes its share of joint venture profit ($414 million, mainly TUI Cruises), less a few one-off items. This page's EBITDAOperating profit before wear-and-tear charges (depreciation and amortization). As a margin: per $100 of sales. (operating income plus depreciation) was $6,628 million.
Official (GAAP): Net income attributable to Royal Caribbean, FY2025
$4.3B
Company's own measure: Adjusted net income, FY2025 (Royal Caribbean's measure)
$4.3B
Adds back $16 million of loss on debt repaid early, $8 million of restructuring and $6 million of Silversea intangible amortization, and leaves out an $11 million gain.
Official (GAAP): Diluted EPS, Q3 FY2026
$6.45
Company's own measure: Adjusted EPS, Q3 FY2026 (Royal Caribbean's measure)
$6.57
Adds back $21 million of loss on debt repaid early, $9 million of restructuring and $2 million of Silversea amortization. Royal Caribbean's own outlook is given in this measure.
Official (GAAP): Revenue growth, Q3 FY2026 (Cityfort calculation from the Q3 FY2026 earnings release)
8.8%
Company's own measure: Net Yields growth, Q3 FY2026 (Royal Caribbean's measure)
0.9%
Net Yields = revenue less commissions, transportation and onboard costs, per available passenger cruise day (one berth for one day). Revenue grew faster because capacity rose 8%.
These are the company's own measures, defined by the company. They are not comparable across companies, and they are not added together. Each sits beside the nearest official (GAAP) figure.
Learn: Non-GAAP measures: what a company's "adjusted" numbers leave out
19Financial strength and debt
19Financial strength · Sep 30, 2026
How much debt does Royal Caribbean have?
- Total debt$22.4B
- Cash and investments$851M
- Net debt (debt minus cash)$21.5B
- Net worth (shareholders' money)$11.9B
- Debt to equity
- 1.88×
- $ of debt for every $1 of shareholders' money
- Interest cover
- 4.9×
- how many times operating profit covers interest
- Total debt is current and long-term debt as reported at Sep 30, 2026 ($22,355 million, net of issuance costs; $22,872 million at face value). Net debt and the 3.3 times figure are Cityfort calculations from the Q3 FY2026 10-Q and the FY2025 10-K.
- All debt is unsecured. Scheduled maturities, as stated in the Q3 FY2026 earnings release: $0.6 billion in the rest of 2026, $2.4 billion in 2027 and $3.2 billion in 2028. Liquidity was $7.4 billion, including $6.6 billion of undrawn revolving credit.
- Net worth is total shareholders' equity including minority interests ($11,913 million). Debt-to-equity and interest coverage (FY2025 operating income ÷ interest expense) are Cityfort calculations from the Q3 FY2026 10-Q and the FY2025 10-K.
- Customer deposits, cash guests paid before sailing, were $6,034 million at Sep 30, 2026; they are not debt, but the company owes the cruise or a refund.
- Not counted above: operating lease liabilities of $815 million, ship purchase obligations of $14,950 million, and a $3.0 billion committed term loan for the Sandals purchase.
20Who owns it
20Who owns it · ownership as of Apr 9, 2026
Who owns Royal Caribbean?
- Officers and directors (as a group), shares
- 6.4%
Share classes
Holders of 5% or more
From the company's proxy statement (DEF 14A), later Schedule 13G filings and the share counts on its latest annual or quarterly report. Each holder row shows the date of its own filing.
Insider trades · Form 4 data as of Nov 6, 2026
What did Royal Caribbean's insiders report trading?
Royal Caribbean's insiders made 45 Form 4A filing an insider must make within two business days of buying or selling the company's shares. Learn more filings in the 12 months to Nov 6, 2026.
They reported no purchases and 149 sales (2.2 million shares) in the open market or privately (codes P and S).
None of the sales were on forms with the Rule 10b5-1 plan box checked.
The same filings report 68 other share transactions (F: 38, A: 27, G: 3).
Insiders are a company's officers, directors and owners of more than 10% of a class of its shares. Most changes in their holdings must be reported to the SEC on a Form 4 within two business days. Source: SEC Form 4 filings on EDGAR.
- P
- a purchase in the open market or privately
- S
- a sale in the open market or privately
- A
- a grant, award or other acquisition from the company under Rule 16b-3
- F
- shares withheld or handed over to pay an exercise price or tax when an award is received, exercised or vests
- G
- a bona fide gift
Code meanings: General Instruction 8 of Form 4 (SEC).
The latest 25 of 217 transactions
Shares: A = acquired, D = disposed of. A price the filing gives only in a footnote shows as “See filing”. The 10b5-1 box is checked when at least one trade on the form was made under a Rule 10b5-1 plan. A Form 4/A replaces the form it amends. See all of Royal Caribbean's Form 4 filings on EDGAR.
Learn: How to read a proxy statement (DEF 14A): Nvidia's 2026 proxy · Form 4 insider filings: who files, the codes and the footnotes · Rule 10b5-1 trading plans: how insiders pre-schedule their trades
Sources (8)
- Form 10-Q, Q3 2026 (quarter ended Sep 30, 2026)
- 2026 proxy statement (DEF 14A)
- Schedule 13G/A (Amendment 6), Capital International Investors: 25,763,011 shares, 9.5%, as of Mar 31, 2026
- Schedule 13G/A (Amendment 2), Capital World Investors: 20,614,423 shares, 7.6%, as of Mar 31, 2026
- Schedule 13G, Vanguard Capital Management: 18,582,413 shares, 6.86%, as of Mar 31, 2026
- Schedule 13G/A (Amendment 12), The Vanguard Group: 0 shares reported after its Jan 12, 2026 internal realignment
- Schedule 13G/A (Amendment 8), Capital Research Global Investors: 17,152,902 shares, 6.4%, as of Sep 30, 2026
- Schedule 13G/A (Amendment 7), AWILHELMSEN AS: 16,435,910 shares, 6.1%, as of Mar 31, 2026
21What it does with profit
21What it does with profit
What does Royal Caribbean do with its profit?
Dividend per share
$3.50FY2025
Dividend paid for each share, by financial year.
$ per share
See the numbers
Buyback · Dec 31, 2025
Bought back shares for $1,159 million in FY2025; the $1.0 billion program announced in February 2025 was completed in November 2025.
$1.2B
Buyback · Dec 10, 2025
Board authorized a new $2.0 billion buyback program.
$2.0B
Buyback · Sep 30, 2026
Bought back shares for $1,035 million in the first nine months of FY2026, none in Q3; $805 million of the authorization remained.
$1.0B
Money raised · Dec 31, 2021
Issued $1,622 million of common stock in FY2021 while cruising was restarting.
$1.6B
22Governance signals
22Governance signals
What do Royal Caribbean's governance filings show?
- Auditor
- PricewaterhouseCoopers LLP, since 1989
- Auditor changes
- None in the period covered
- Audit qualifications
- None reported
- Related-party dealings
- The 2026 proxy reports one related person transaction: in June 2025 a company linked to director Eyal Ofer chartered one of Royal Caribbean's ships for $4.2 million, a fee the company says was set at arm's length. Fees paid to PwC were $6.7 million for 2025, including $5.9 million of audit fees.
- Credit rating
- S&P Global Ratings and Moody's (as stated in the FY2025 10-K) BBB- (S&P) / Baa3 (Moody's), senior unsecured (Not stated in the 10-K), Dec 31, 2025
A credit rating describes the company's ability to repay debt. It is not a rating of the share.
Flags to know about
other
Incorporated in Liberia
Royal Caribbean Cruises Ltd. is a Liberian corporation based in Miami. Its 10-K lists not being a U.S. corporation, and its tax status under U.S. and U.K. rules, among its risk factors.
other
CEO pay ratio
The 2026 proxy states a CEO pay ratio of 1,260 to 1. The median employee was a crew member paid $19,027.
disclosure
Tax line shown separately only from FY2023
The FY2025 10-K moved income taxes out of other income and restated FY2023 and FY2024 only. FY2021 and FY2022 net losses include taxes inside other income.
23What the market paid
23What the market paid · price as of Nov 5, 2026
What did the market pay for Royal Caribbean on Nov 5, 2026?
Price as of Nov 5, 2026 (shown for education; prices change daily).
Price as of Nov 5, 2026: Royal Caribbean closed at $322.73 (Nasdaq historical data; the stock is listed on the NYSE). Times 267.47 million shares (Oct 23, 2026) that is a market value of about $86.3 billion (Cityfort calculation from the Nov 5, 2026 closing price and the Q3 FY2026 10-Q cover). P/E is price ÷ earnings per share: 19.1 on diluted EPS of $16.89 for the four quarters to Sep 30, 2026 (Cityfort calculation from the Q4 FY2025 to Q3 FY2026 earnings releases). The declared quarterly dividend of $1.50 adds up to $6.00 a year, 1.9% of that price.
- Share price
- $322.73
- Market value (market cap)
- $86.3B
- P/E
- 19.1×
More price-based ratios · as of Nov 5, 2026
Each ratio divides a number from the company's filings by the market value or share price on Nov 5, 2026. Prices change daily, so these ratios do too.
Price to sales (P/S)
4.5×
$86.3B market value ÷ $19.1B revenue (four quarters to Sep 30, 2026) = 4.5×
Cityfort calculation from the Nov 5, 2026 closing price and the Q4 FY2025 to Q3 FY2026 10-Qs and earnings releases. Source: RCL historical prices, Oct 6 to Nov 5, 2026 (Nasdaq.com historical table; RCL is listed on the NYSE); Form 10-Q, Q3 2026 (quarter ended Sep 30, 2026); Q3 2026 earnings release (8-K Exhibit 99.1, Oct 27, 2026) and 5 more
How price ratios workDividend yield
1.08%
$3.50 dividends per share (FY2025) ÷ $322.73 share price = 1.08%
Cityfort calculation from the FY2025 10-K and the Nov 5, 2026 closing price. Source: RCL historical prices, Oct 6 to Nov 5, 2026 (Nasdaq.com historical table; RCL is listed on the NYSE); Form 10-Q, Q3 2026 (quarter ended Sep 30, 2026); Q3 2026 earnings release (8-K Exhibit 99.1, Oct 27, 2026) and 4 more
What dividend yield meansFree cash flow yield
1.4%
$1.2B free cash flow (FY2025) ÷ $86.3B market value = 1.4%
Cityfort calculation from the FY2025 10-K and the Nov 5, 2026 closing price. Source: RCL historical prices, Oct 6 to Nov 5, 2026 (Nasdaq.com historical table; RCL is listed on the NYSE); Form 10-Q, Q3 2026 (quarter ended Sep 30, 2026); Q3 2026 earnings release (8-K Exhibit 99.1, Oct 27, 2026) and 4 more
What free cash flow means
Shares used for the market value: 267.47 million ($322.73 × 267.47 million shares ≈ $86.3B). Source: Form 10-Q, Q3 2026 (quarter ended Sep 30, 2026); 2026 proxy statement (DEF 14A)
Source: RCL historical prices, Oct 6 to Nov 5, 2026 (Nasdaq.com historical table; RCL is listed on the NYSE); Form 10-Q, Q3 2026 (quarter ended Sep 30, 2026); Q3 2026 earnings release (8-K Exhibit 99.1, Oct 27, 2026) and 3 more
Sources (10)
- RCL historical prices, Oct 6 to Nov 5, 2026 (Nasdaq.com historical table; RCL is listed on the NYSE)
- Form 10-Q, Q3 2026 (quarter ended Sep 30, 2026)
- Q3 2026 earnings release (8-K Exhibit 99.1, Oct 27, 2026)
- Q2 2026 earnings release (8-K Exhibit 99.1, Jul 28, 2026)
- Q1 2026 earnings release (8-K Exhibit 99.1, Apr 30, 2026)
- Q4 and full-year 2025 earnings release (8-K Exhibit 99.1, Jan 29, 2026)
- Form 10-Q, Q1 2026 (quarter ended Mar 31, 2026)
- Form 10-Q, Q2 2026 (quarter ended Jun 30, 2026)
- Form 10-K, fiscal year 2025 (ended Dec 31, 2025)
- 2026 proxy statement (DEF 14A)
24How it got here
24How it got here
How did Royal Caribbean get here?
1968
Milestone
Founded
Royal Caribbean began in 1968 as a partnership; the current company was incorporated in Liberia in 1985.
2020
Crisis
Cruising suspended
Sailing was suspended in 2020 and restarted gradually from the second half of 2021 to the first half of 2022.
2021
Crisis
$5.26 billion loss and new shares
On revenue of $1,532 million, Royal Caribbean lost $5,260 million in FY2021 and raised $1,622 million by issuing new shares.
2022
Milestone
Jason Liberty becomes CEO
Jason Liberty, CFO since 2013, became CEO in January 2022; Richard Fain stayed as Chairman until November 2025.
2023
Milestone
Back to profit
Net income was $1,697 million in FY2023, after losses in FY2021 and FY2022, with occupancy back above 100%.
2024
Milestone
Dividend returns
After repaying the export credit loan deferrals that barred dividends, the board reinstated the quarterly dividend in Q2 2024.
2025
Milestone
Investment-grade ratings and buybacks
The company reached investment-grade ratings at all three major agencies, bought the Port of Costa Maya for $294 million and spent $1,159 million on buybacks.
2026
Business-model change
Agreement to buy 50% of Sandals
On Sep 23, 2026 Royal Caribbean agreed to buy 50% of Sandals and Beaches Resorts, all-inclusive Caribbean resorts, for about $3.0 billion in cash.
25Sources and changes
Where every number on this page comes from
Sources (21 documents)
- S1Form 10-K, fiscal year 2025 (ended Dec 31, 2025) · Royal Caribbean Cruises Ltd. (SEC EDGAR) · Tier 1: company or exchange filing · Feb 11, 2026
- S2Form 10-K, fiscal year 2023 (ended Dec 31, 2023) · Royal Caribbean Cruises Ltd. (SEC EDGAR) · Tier 1: company or exchange filing · Feb 21, 2024
- S3Form 10-Q, Q3 2026 (quarter ended Sep 30, 2026) · Royal Caribbean Cruises Ltd. (SEC EDGAR) · Tier 1: company or exchange filing · Oct 27, 2026
- S4Form 10-Q, Q2 2026 (quarter ended Jun 30, 2026) · Royal Caribbean Cruises Ltd. (SEC EDGAR) · Tier 1: company or exchange filing · Jul 28, 2026
- S5Form 10-Q, Q1 2026 (quarter ended Mar 31, 2026) · Royal Caribbean Cruises Ltd. (SEC EDGAR) · Tier 1: company or exchange filing · Apr 30, 2026
- S6Q3 2026 earnings release (8-K Exhibit 99.1, Oct 27, 2026) · Royal Caribbean Cruises Ltd. (SEC EDGAR) · Tier 1: company or exchange filing · Oct 27, 2026
- S7Q2 2026 earnings release (8-K Exhibit 99.1, Jul 28, 2026) · Royal Caribbean Cruises Ltd. (SEC EDGAR) · Tier 1: company or exchange filing · Jul 28, 2026
- S8Q1 2026 earnings release (8-K Exhibit 99.1, Apr 30, 2026) · Royal Caribbean Cruises Ltd. (SEC EDGAR) · Tier 1: company or exchange filing · Apr 30, 2026
- S9Q4 and full-year 2025 earnings release (8-K Exhibit 99.1, Jan 29, 2026) · Royal Caribbean Cruises Ltd. (SEC EDGAR) · Tier 1: company or exchange filing · Jan 29, 2026
- S102026 proxy statement (DEF 14A) · Royal Caribbean Cruises Ltd. (SEC EDGAR) · Tier 1: company or exchange filing · Apr 17, 2026
- S118-K filed Sep 23, 2026: agreement to acquire 50% of Sandals and Beaches Resorts (Item 8.01, Exhibit 99.1) · Royal Caribbean Cruises Ltd. (SEC EDGAR) · Tier 1: company or exchange filing · Sep 23, 2026
- S128-K filed May 20, 2026: statement on SEMARNAT and Perfect Day Mexico permits (Item 7.01) · Royal Caribbean Cruises Ltd. (SEC EDGAR) · Tier 1: company or exchange filing · May 20, 2026
- S148-K filed Feb 17, 2026: Christopher Wiernicki appointed director (Item 5.02) · Royal Caribbean Cruises Ltd. (SEC EDGAR) · Tier 1: company or exchange filing · Feb 17, 2026
- S158-K filed Jul 20, 2026: Tara Bunch appointed director (Item 5.02) · Royal Caribbean Cruises Ltd. (SEC EDGAR) · Tier 1: company or exchange filing · Jul 20, 2026
- S16Schedule 13G/A (Amendment 8), Capital Research Global Investors: 17,152,902 shares, 6.4%, as of Sep 30, 2026 · Capital Research Global Investors (SEC EDGAR) · Tier 1: company or exchange filing · Oct 6, 2026
- S17Schedule 13G/A (Amendment 6), Capital International Investors: 25,763,011 shares, 9.5%, as of Mar 31, 2026 · Capital International Investors (SEC EDGAR) · Tier 1: company or exchange filing · May 14, 2026
- S18Schedule 13G/A (Amendment 2), Capital World Investors: 20,614,423 shares, 7.6%, as of Mar 31, 2026 · Capital World Investors (SEC EDGAR) · Tier 1: company or exchange filing · May 14, 2026
- S19Schedule 13G, Vanguard Capital Management: 18,582,413 shares, 6.86%, as of Mar 31, 2026 · Vanguard Capital Management (SEC EDGAR) · Tier 1: company or exchange filing · Apr 30, 2026
- S20Schedule 13G/A (Amendment 12), The Vanguard Group: 0 shares reported after its Jan 12, 2026 internal realignment · The Vanguard Group (SEC EDGAR) · Tier 1: company or exchange filing · Mar 27, 2026
- S21Schedule 13G/A (Amendment 7), AWILHELMSEN AS: 16,435,910 shares, 6.1%, as of Mar 31, 2026 · AWILHELMSEN AS (SEC EDGAR) · Tier 1: company or exchange filing · May 12, 2026
- S23RCL historical prices, Oct 6 to Nov 5, 2026 (Nasdaq.com historical table; RCL is listed on the NYSE) · Nasdaq, Inc. · Tier 1: company or exchange filing · Nov 5, 2026
Changes to this page (v1 · Nov 7, 2026)
- v1 · Nov 7, 2026First version, through Q3 FY2026 (quarter ended Sep 30, 2026), from the Oct 27, 2026 earnings release and 10-Q. (first version)
Numbers come only from tier 1 and tier 2 sources. Read how we research.
Disclaimer
For learning only. Cityfort is not a registered investment adviser or broker-dealer and does not recommend buying or selling any security. Prices shown are dated and may be out of date.
Investing in securities involves risk, including loss of capital. Before making any investment decision, do your own research and consider consulting a registered investment adviser or other qualified professional.
Cityfort, its owners and contributors may or may not hold securities of companies covered. Cityfort is not paid by any company it covers. Content is not an offer or solicitation to buy or sell any security, including in any initial public offering.
Read the positions policyRead the full disclaimerHide the full disclaimer
Cityfort publishes general educational content that explains how listed companies work. Cityfort is not registered with the US Securities and Exchange Commission or any state securities regulator as an investment adviser, and is not a broker-dealer or a member of FINRA. Cityfort does not provide investment, tax or legal advice, recommendations, ratings, price targets or any opinion on whether to buy, sell or hold any security. Nothing on the site is tailored to any person's circumstances.
All information is taken from publicly available sources, mainly company filings with the SEC, which are listed on each page with dates. We work to keep it accurate and correct errors publicly, but we do not guarantee that it is complete, accurate or up to date. Any market price or price-based ratio shown is dated, may be out of date by the time you read it, and is included only to explain concepts.
Statements by company management, including forward-looking statements and guidance, are reported as the company's statements, with their date and source; they are not our forecasts. Adjusted (non-GAAP) figures are the company's own measures and are shown next to the official (GAAP) figures.