Consumer Discretionary · NYSE: PHM
PulteGroup: how the business works
PulteGroup builds and sells new houses in 26 US states, closing 29,572 homes and taking in $17.3 billion of revenue in FY2025.
By Hardik Bhandare · Checked against filings: . Editorial policy. Corrections
Follow PulteGroup
Email me when PulteGroup's page is updated after earnings.
We'll send a confirmation email first. See our privacy policy.
PulteGroup, Inc. · Atlanta, Georgia · Founded 1950
Updated for Q3 FY2026 · checked
- Revenue, FY2025
- $17.3B
- Net income, FY2025
- $2.22B
- Homes closed, FY2025
- 29,572
- Employees, Dec 31, 2025
- 6,506
- Founding dated to
- 1950
The short version
PulteGroup in 5 points
1 · What it sells
PulteGroup builds and sells new houses in 26 US states, and closed 29,572 homes at an average price of $566,000 in FY2025.
2 · Who pays it
In FY2025, homebuyers paid 96.7% of PulteGroup's revenue; mortgage, title and insurance customers paid 2.2%, and land buyers 1%.
3 · What it keeps from $100
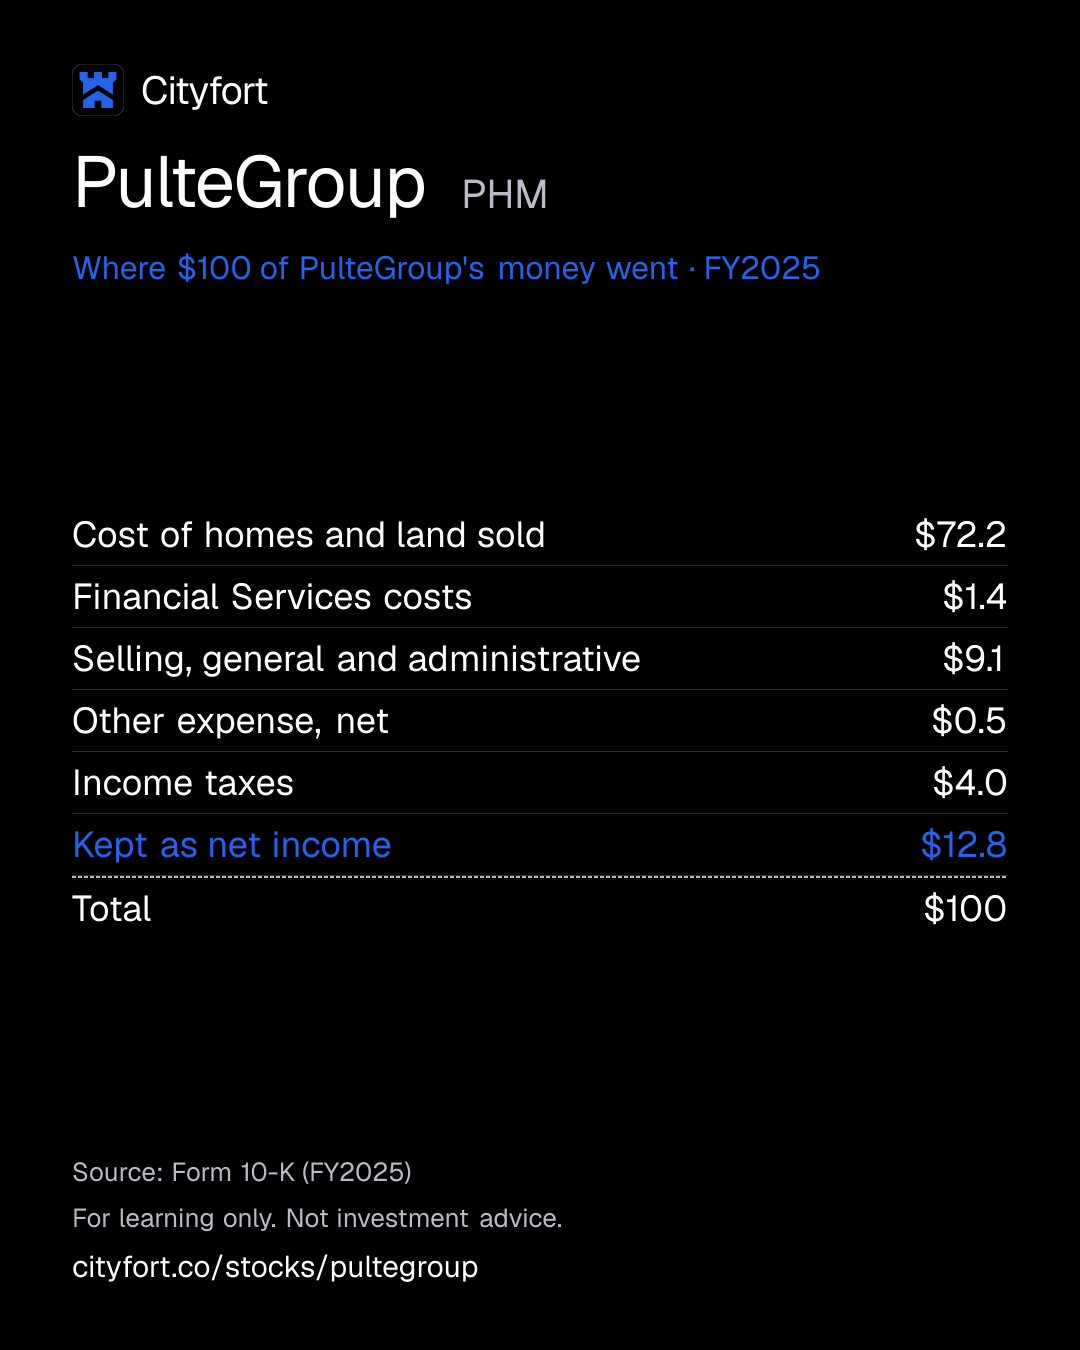
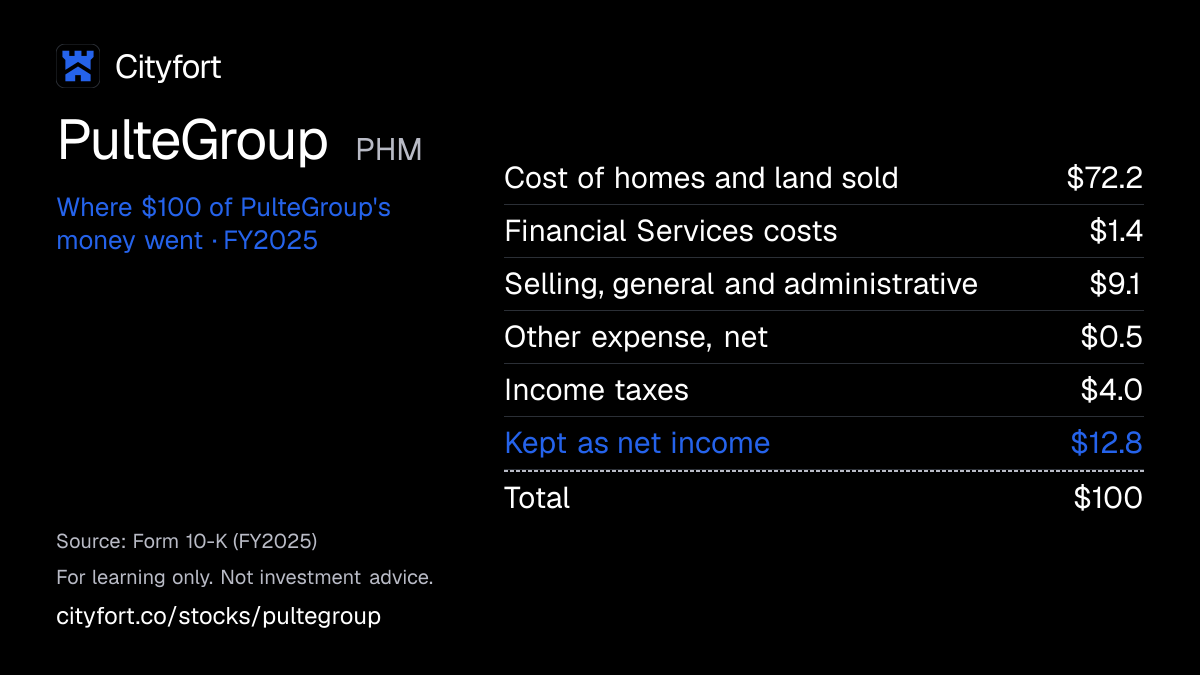
Of every $100 that came in during FY2025, PulteGroup kept $12.8 as net income, after $72.2 for land, building and interest and $9.1 for selling and overhead (it reports no operating income line).
4 · Where the operating profit comes from
Florida earned the most of PulteGroup's FY2025 pre-tax income, $822 million, followed by the Southeast at $561 million and the Midwest at $539 million.
5 · The one thing to watch
The home sale gross margin was 24.8% in Q3 FY2026, down from 26.3% in FY2025, and management said in the Q3 FY2026 10-Q that it expects sales incentives to remain elevated.
Sources: From PulteGroup's FY2025 10-K (filed Feb 4, 2026), its Q3 FY2026 10-Q and its Oct 22, 2026 earnings release · checked
01Where the money goes · FY2025
Where does $100 of PulteGroup's money go?
PulteGroup · FY2025
Receipt for every $100
| Cost of homes and land sold | $72.2 |
|---|---|
| Financial Services costs | $1.4 |
| Selling, general and administrative | $9.1 |
| Other expense, net | $0.5 |
| Income taxes | $4.0 |
| Kept as net income | $12.8 |
| Total | $100 |
Each line = amount ÷ total money in × 100. Lines may not add to exactly $100 because of rounding.
How this is worked out
Cityfort calculation from the FY2025 10-K. Each line is divided by the $17,316.1 million that came in (revenue of $17,312.0 million plus $4.1 million of joint venture income), times 100.
Save this receipt as an image
Embed this receipt or the key numbers
Paste this code into a blog or website to show the card you choose, with a link back to this page.
Each week: the next company due to report earnings, explained in 5 points.
No tips. Unsubscribe anytime.
We'll send a confirmation email. See our privacy policy.
02The business in one line
What does PulteGroup do?
Households pay PulteGroup for new houses; in FY2025, $72.2 of every $100 that came in went on land, building and interest, and $12.8 was left as net income.
- Homebuyers paid $16,743.5 million for homes in FY2025, 96.7% of revenue, at an average price of $566,000.
- Its own lender, Pulte Mortgage, made the loans on 64% of 2025 closings; mortgage, title and insurance brought in $388.7 million.
03Who pays it
Who pays PulteGroup?
Individual homebuyers
96.7%
of revenue
First-time, move-up and active-adult buyers paid $16,743.5 million for homes in FY2025. About 21% of 2025 closings were paid in cash.
Mortgage, title and insurance customers
2.2%
of revenue
Substantially all are PulteGroup's own homebuyers, who paid $388.7 million in loan, title and insurance revenue in FY2025.
Land buyers
1%
of revenue
Buyers of land and lots PulteGroup no longer needs paid $179.8 million (with other revenue) in FY2025.
- Individual homebuyers96.7%
- Mortgage, title and insurance customers2.2%
- Land buyers1%
How spread out the customers are
The FY2025 10-K names no large single customer: PulteGroup sells to individual buyers, 29,572 homes in 2025.
04How it makes money
How does PulteGroup make money?
PulteGroup earns the gap between a home's sale price and what its land and construction cost.
That gap is the home sale gross margin: 28.9% in FY2024 and 26.3% in FY2025. The FY2025 10-K links the fall to larger sales incentives and higher land costs. Overhead is then spread over the homes that close.
Home sale gross margin
29.3%26.3%
FY2023 to FY2025
- Control land, mostly through options
- Develop lots and start homes
- Sell homes, adding incentives when demand is weak
- Arrange the buyer's mortgage through Pulte Mortgage
- Close the sale and collect the cash
- Buy more land, pay dividends and buy back shares
↺ Step 6 feeds back into step 1.
05Business segments · FY2025
Which businesses make up PulteGroup?
Florida
24.6%The largest region: 7,442 homes closed in 2025, and pre-tax income fell 27%.
Revenue $4.3B ($4,265M) · Operating profit $822M
West
22.4%Arizona, California, Colorado, Nevada and four more states; $59.3 million of land charges in 2025.
Revenue $3.9B ($3,877M) · Operating profit $379M
Southeast
17.1%Georgia, the Carolinas and Tennessee; 5,598 homes closed in 2025.
Revenue $3.0B ($2,959M) · Operating profit $561M
Midwest
15.8%Illinois, Indiana, Kentucky, Michigan, Minnesota and Ohio; pre-tax income rose 10% in 2025.
Revenue $2.7B ($2,728M) · Operating profit $539M
Texas
9.7%Lowest average price of the six regions ($385,000); closings fell 20% and pre-tax income 53% in 2025.
Revenue $1.7B ($1,676M) · Operating profit $162M
Northeast
7.2%Virginia to Massachusetts; highest average price ($753,000), with revenue up 16% in 2025.
Revenue $1.2B ($1,243M) · Operating profit $294M
Other homebuilding
1%Items not assigned to a region, such as insurance reserve changes; FY2025 included a $28.6 million goodwill write-down.
Revenue $177M · Operating profit −$2.9M
Financial Services
2.2%Pulte Mortgage plus title and insurance agencies.
Revenue $389M · Operating profit $158M
How the mix changed
- Florida
- West
- Southeast
- Midwest
- Texas
- Northeast
- Other homebuilding
- Financial Services
Revenue by segment, FY2023 to FY2025.
US$
See the numbers
06The numbers · Consolidated · US$
How has PulteGroup done?
Revenue
$17.3BFY2025
Revenue peaked at $17.9 billion in FY2024 and was $17.3 billion in FY2025, when 29,572 homes closed against 31,219. FY2021 and FY2022 revenue are restated figures from later 10-Ks.
US$
See the numbers
Net income
$2.2BFY2025
Net income fell from $3.1 billion in FY2024 to $2.2 billion in FY2025. EBITDA here is pre-tax income plus depreciation and amortization, since PulteGroup reports no operating income line.
US$
See the numbers
Net income for every $100 of revenue
$12.8FY2025
Net income per $100 of revenue was $17.2 in FY2024 and $12.8 in FY2025, as the home sale gross margin fell from 28.9% to 26.3%.
Net margin: $ of net income per $100 of revenue
See the numbers
Free cash flow
$1.7BFY2025
Free cash flow was $555.8 million in FY2022, $2.1 billion in FY2023 and $1.7 billion in FY2025. Operating cash flow already counts spending on land and homes being built.
US$ · cash from operations minus spending on plants and equipment
See the numbers
See all yearly numbers
EBITDA here = operating income plus depreciation and amortization (from the cash flow statement). Fiscal years are the company's own: Fiscal year ends Dec 31 (the calendar year). Net income is the share belonging to the company's owners.
Learn: Fiscal years that don't end in December: Nvidia's FY2027 explained · Stock-based compensation and dilution: pay that becomes shares
Sources (16)
- PulteGroup, Inc. FY2023 Form 10-K
- PulteGroup, Inc. FY2021 Form 10-K
- PulteGroup, Inc. FY2024 Form 10-K
- PulteGroup, Inc. FY2022 Form 10-K
- PulteGroup, Inc. FY2025 Form 10-K
- PulteGroup, Inc. Form 10-Q for Q1 FY2024
- PulteGroup, Inc. Form 10-Q for Q2 FY2024
- PulteGroup, Inc. Form 10-Q for Q3 FY2024
- PulteGroup, Inc. Q4 2024 earnings release (8-K Ex. 99.1)
- PulteGroup, Inc. Form 10-Q for Q1 FY2025
- PulteGroup, Inc. Form 10-Q for Q2 FY2025
- PulteGroup, Inc. Form 10-Q for Q3 FY2025
- PulteGroup, Inc. Q4 2025 earnings release (8-K Ex. 99.1)
- PulteGroup, Inc. Q1 2026 Form 10-Q
- PulteGroup, Inc. Q2 2026 Form 10-Q
- PulteGroup, Inc. Q3 2026 Form 10-Q
07Who runs it
Who runs PulteGroup, and did they deliver?
Ryan R. Marshall
President and CEO · since 2016
President since Feb 2016 and CEO since Sep 2016; earlier Area President, Southeast (from Nov 2012), after Florida division and finance roles. Holds 656,721 shares per the 2026 proxy.
James L. Ossowski
EVP and Chief Financial Officer · since 2025
CFO since Feb 7, 2025; senior vice president of finance from 2017. Succeeded Robert O’Shaughnessy.
Matthew W. Koart
EVP and Chief Operating Officer · since 2023
COO since May 2023; earlier CEO of Koart Residential.
Todd N. Sheldon
EVP, General Counsel and Corporate Secretary · since 2017
In the role since Mar 2017.
Thomas J. Folliard
Non-executive Chairman · since 2023
Chairman since Jan 1, 2023; all directors except the CEO are independent.
What they said, and what happened
3 delivered
Said on Feb 6, 2025
The FY2024 10-K said PulteGroup planned to continue paying dividends and buying back its shares.
DeliveredWhat happened
In FY2025 it declared $0.92 a share in dividends and bought back $1.2 billion of shares.
Said on Feb 6, 2025
The FY2024 10-K listed increasing lot optionality (holding more land through options) as a strategy.
DeliveredWhat happened
Optioned lots rose from 56% to 57% of controlled lots during 2025.
Said on Feb 6, 2025
The FY2024 10-K said Pulte Mortgage's repurchase agreement had to be repaid or refinanced in August 2025.
DeliveredWhat happened
A $625 million agreement ran to Aug 12, 2026, and a new $625 million agreement was signed in August 2026, due Aug 10, 2027.
08What could go wrong
What could go wrong for PulteGroup?
- Demand
Mortgage rates and affordability
The Q3 FY2026 10-Q says demand weakened further as mortgage rates rose sharply in September 2026. Net new orders fell 6% and closings 9% from a year earlier.
Watch Net new orders and the cancellation rate in the Q4 FY2026 earnings release.
- Pricing
Incentives squeezing margins
The home sale gross margin fell from 28.9% in FY2024 to 26.3% in FY2025 and 24.8% in Q3 FY2026. Management said in the Q3 FY2026 10-Q that it expects incentives to remain elevated.
Watch Home sale gross margin against 24.8% in Q3 FY2026.
- Execution
Land write-downs
In 2025 PulteGroup booked $77.4 million of land impairments and $48.4 million of write-offs on land options it dropped. Q3 FY2026 had another $26 million of land impairments.
Watch Land impairments and option write-offs in each 10-Q and 10-K.
- Concentration
Weaker regions: Texas, Florida and the West
Florida and the West brought in 47% of FY2025 revenue. In 2025 pre-tax income fell 27% in Florida, 31% in the West and 53% in Texas.
Watch Closings and orders by region in the segment tables of the earnings release.
- Raw-material prices
Labor and material costs
The 10-K says lumber, steel, concrete and copper prices move with commodity markets and tariffs, and that skilled labor supply has not kept pace with construction demand.
Watch Comments on house costs and tariffs in the 10-K and 10-Qs.
- Cash and liquidity
Mortgage arm funding and loan claims
Pulte Mortgage relies on a $625 million repurchase agreement due Aug 10, 2027. The 10-K also lists claims from buyers of loans it sold, including loans from a former Centex mortgage unit.
Watch Renewal of the repurchase agreement and any loan repurchase charges.
- Legal
Construction defect and warranty claims
The 10-K says many of its legal proceedings involve claims of alleged construction defects. Insurance reserve changes moved results: FY2024 SG&A included $333.9 million of reserve reversals.
Watch Insurance reserve changes and Legal Proceedings in each 10-Q.
09Supporters vs. critics
What do supporters and critics point to?
What supporters point to
- PulteGroup held 57% of its 234,632 controlled lots through options at Dec 31, 2025, up from 56% a year earlier.
- Net debt was $400.9 million against shareholders' equity of $13.1 billion at Sep 30, 2026, and its $1.75 billion credit line was undrawn apart from letters of credit.
- It bought back $1.2 billion of shares in each of FY2024 and FY2025, and the quarterly dividend rose from $0.22 to $0.26 a share from the January 2026 payment.
- Free cash flow was $1.7 billion in FY2025, after $1.6 billion in FY2024.
- CEO Ryan Marshall said in the Oct 22, 2026 release that more than 60% of the business is now move-up and active-adult buyers, whom he called "more profitable".
What critics point to
- Net income fell from $3,083.3 million in FY2024 to $2,218.7 million in FY2025, and Q3 FY2026 net income was $475.7 million, against $585.8 million a year earlier.
- The home sale gross margin fell from 28.9% in FY2024 to 26.3% in FY2025 and 24.8% in Q3 FY2026. The FY2025 10-K links the fall to larger sales incentives and higher land costs.
- Net new orders fell 6% and closings 9% in Q3 FY2026 from a year earlier. The Q3 FY2026 10-Q says demand weakened further as mortgage rates rose sharply in September 2026.
- It booked $77.4 million of land impairments and $48.4 million of option write-offs in 2025, and another $26 million of land impairments in Q3 FY2026.
- Its FY2025 10-K puts its share at only about 4% of US new home sales, and it also competes with resales of existing homes and with rentals.
10What to watch next
What should you watch next at PulteGroup?
Next event
Q4 FY2026 results
Date not announced yet.
Home sale gross margin and incentives
The margin was 24.8% in Q3 FY2026, against 26.2% a year earlier. Management said in the Q3 FY2026 10-Q that it expects sales incentives to remain elevated.
Orders and backlog
Q3 FY2026 net new orders fell 6% from a year earlier. Backlog was $6.4 billion at Sep 30, 2026, 3.4% above Sep 30, 2025.
Land write-downs
Q3 FY2026 included $26 million of land impairments, after $77.4 million of land impairments and $48.4 million of option write-offs in 2025.
Pulte Mortgage funding
Pulte Mortgage's $625 million repurchase agreement, which funds loans awaiting sale, is due Aug 10, 2027.
11Key facts
Key facts about PulteGroup
- What does PulteGroup do?
- PulteGroup builds and sells new houses in the United States under the Pulte, Centex, Del Webb, DiVosta and John Wieland brands. At Dec 31, 2025, PulteGroup ran 1,014 active communities in 47 markets across 26 states.
- How does PulteGroup make money?
- PulteGroup makes most of its money selling homes: buyers paid $16,743.5 million for homes, 96.7% of its FY2025 revenue of $17,312.0 million. Its Financial Services arm (mortgages, title and insurance) brought in $388.7 million.
- Who are PulteGroup's customers?
- PulteGroup's customers are individual first-time, move-up and active-adult homebuyers. PulteGroup closed 29,572 homes in FY2025. Its 10-K names no large single customer, and Pulte Mortgage made the loans on 64% of those closings.
- How big is PulteGroup?
- PulteGroup had revenue of $17,312.0 million and net income of $2,218.7 million in FY2025 (year to Dec 31, 2025), against $17,947.0 million and $3,083.3 million in FY2024.
- Who owns PulteGroup?
- PulteGroup has one class of common stock and no controlling holder. Its 2026 proxy lists The Vanguard Group (12.94%), BlackRock (11.14%), Franklin Resources (6.73%) and State Street (5.24%), each as of its own 13G filing date; directors and executive officers held under 1%.
- Does PulteGroup own the land it builds on?
- Partly. At Dec 31, 2025, PulteGroup controlled 234,632 lots and held 57% of them through options (the right to buy later) instead of owning them, up from 56% a year earlier.
- How much does PulteGroup return to shareholders?
- In FY2025, PulteGroup bought back 10.6 million of its shares for $1.2 billion and declared dividends of $0.92 per share. Shares outstanding fell to 184.1 million on Oct 15, 2026, from 192.7 million at Dec 31, 2025.
- How did PulteGroup do in Q3 FY2026?
- In Q3 FY2026 (Jul to Sep 2026), PulteGroup had revenue of $3,973.8 million and net income of $475.7 million, against $4,404.8 million and $585.8 million in Q3 FY2025. The home sale gross margin was 24.8%, against 26.2% a year earlier.
Sources (7)
Terms on this page
- Backlog
- Capital expenditures (capex)
- Debt-to-equity
- Earnings per share (EPS)
- EBITDA
- Free cash flow
- Net debt
- Net margin
- Revenue vs net income
- Stock buyback
Each explains the term in plain English, with the same number from other companies on Cityfort.
Go deeper
More detail from the same filings. Open any section.
12What it sells
12What it sells
What does PulteGroup sell?
Homes under the Pulte, Centex, DiVosta and John Wieland brands
Mostly single-family detached houses (83% of 2025 closings), plus townhomes and condos. 2025 prices ran from about $150,000 to over $3 million; the average was $566,000.
Del Webb communities for active adults
Many are limited to buyers aged 55 and over and come with clubhouses, sports facilities and recreation centers.
Mortgages, title and insurance (Financial Services)
Pulte Mortgage originated the loans on 64% of 2025 home closings; title and insurance agencies handle the rest of the purchase. This arm had $388.7 million of revenue in FY2025.
Think of it like this
Like a developer that also runs the bank desk in its own sales office: it sells the house and, for most buyers, arranges the loan too.
What it does
- Does: Buys land and builds roads, sewers, parks and pools for its communities
- Does: Sells many homes before building them (built-to-order) and builds some without a buyer yet (spec homes)
- Does: Arranges mortgages, title and home insurance for its own buyers
What it does not do
- Does not: Does not do most building work itself: independent subcontractors do substantially all of it
- Does not: Does not keep the mortgages: Pulte Mortgage generally sells the loans to investors within 30 days
- Does not: Does not build or sell homes outside the United States
Sources (1)
13How the money flows
13How the money flows · FY2025
How does money flow through PulteGroup?
Money in
- Revenue (homes, land, mortgage and title fees)$17.3B
- Share of joint venture income$4.1M
The company
PulteGroup
$17.3B came in
Money out
- Cost of homes and land sold (land, building, interest)$12.5B
- Financial Services costs$232M
- Selling, general and administrative costs$1.6B
- Other expense, net (incl. impairments)$91.5M
- Income taxes$693M
- Net income$2.2B
- Buyers paid $17.3 billion for homes, land and mortgage services in FY2025.
- Land, materials, subcontractors and interest built into home costs took $12.5 billion.
- Selling and overhead costs took $1.6 billion; the mortgage and title arm spent $231.9 million.
- After $692.6 million of income tax, $2.2 billion was left as net income.
Sources (1)
14What it needs to run
14What it needs to run
What does PulteGroup need to run?
Land and lots
PulteGroup controlled 234,632 lots at Dec 31, 2025. 57% were held through option contracts, which let it buy later or walk away.
Subcontractors
Independent subcontractors do substantially all construction work at agreed prices. The 10-K says qualified labor remains hard to find.
Building materials
Lumber, steel, concrete, resin, copper and petroleum-based materials. Their prices move with commodity markets and tariffs.
Mortgage funding
Pulte Mortgage funds new loans through a $625 million repurchase agreement with Truist Bank as agent, signed in August 2026 and due Aug 10, 2027.
People
6,506 employees at Dec 31, 2025, of whom 1,034 worked in Financial Services.
15Competitors and what protects it
15Competitors and what protects it
Who does PulteGroup compete with?
D.R. Horton
NYSE: DHI
Named in PulteGroup's 2026 proxy as a peer homebuilder used for pay comparisons.
Lennar
Named in PulteGroup's 2026 proxy as a peer homebuilder used for pay comparisons.
NVR
Named in PulteGroup's 2026 proxy as a peer homebuilder used for pay comparisons.
Toll Brothers
Named in PulteGroup's 2026 proxy as a peer homebuilder used for pay comparisons.
KB Home
Named in PulteGroup's 2026 proxy as a peer homebuilder used for pay comparisons.
What protects the business
Each strength is scored 1 (weak) to 5 (strong) for the business, with the reason. It is not a rating of the share.
- Scale3 of 5
It ran 1,014 active communities in 47 markets at Dec 31, 2025, but held only about 4% of US new home sales.
- Land held through options3 of 5
57% of its 234,632 controlled lots were optioned at Dec 31, 2025; it wrote off $48.4 million on option deals it walked away from in 2025.
- Own mortgage company3 of 5
Pulte Mortgage made loans for 64% of 2025 closings, and mortgage rate buydowns are one of the incentives PulteGroup offers.
- Brands for each buyer group2 of 5
Separate brands serve first-time, move-up and active-adult buyers; Del Webb communities are often limited to buyers aged 55 and over.
Weak spot
Mortgage rates and affordability
The Q3 FY2026 10-Q says rising mortgage rates pressured demand; net new orders fell 6% from a year earlier despite price cuts and incentives.
16Where growth could come from
16Where growth could come from
Where could PulteGroup's growth come from?
PulteGroup gives no numeric outlook in its earnings releases. In the Q3 FY2026 10-Q, filed Oct 22, 2026, management said it expects sales incentives to remain elevated and the pace of house starts to stay "dynamic in response to market conditions".
More communities open
Mixed1,077 average communities, Q3 FY2026 (+7%)
The average community count rose 7% from 1,002 a year earlier, but closings fell 9% in Q3 FY2026.
Status: Mixed, partly on track.
Orders and backlog
MixedBacklog $6.4 billion at Sep 30, 2026
Orders for the first nine months of 2026 were 21,778 homes against 21,486 a year earlier, but Q3 FY2026 orders fell 6%. Backlog value was 3.4% above Sep 30, 2025.
Status: Mixed, partly on track.
Move-up and active-adult buyers
WorkingMore than 60% of the business (CEO, Oct 22, 2026)
CEO Ryan Marshall said in the Q3 FY2026 release that more than 60% of the business is now move-up and active-adult buyers, whom he called "more profitable".
Status: Working, on track against what the company said.
More land under option
Working57% of lots optioned, Dec 31, 2025
The share of controlled lots held through options rose from 56% to 57% during 2025, in line with the strategy stated in the FY2024 10-K.
Status: Working, on track against what the company said.
Status compares progress with what the company itself said it would do: Working = on track against what the company said; Mixed = partly on track; Behind = behind the company's own plan; New = recently announced; Early = too early to judge.
17The company's own measures (non-GAAP)
17The company's own measures · Q3 FY2026
What do PulteGroup's own measures show?
Official (GAAP): Notes payable, Sep 30, 2026
1,808.9%
Company's own measure: Debt-to-capital
12.1%
Notes payable divided by notes payable plus shareholders’ equity; Financial Services debt is left out.
Official (GAAP): Notes payable, Sep 30, 2026
$1.8B
Company's own measure: Net debt
$401M
Notes payable minus cash, cash equivalents and restricted cash.
Official (GAAP): Home sale revenues, Q3 FY2026
$3.9B
Company's own measure: Backlog (signed orders not yet closed)
$6.4B
10,298 homes under contract at Sep 30, 2026; they count as revenue only when each sale closes.
Official (GAAP): Financial Services pre-tax income, Q3 FY2026
45.6%
Company's own measure: Mortgage capture rate
84.6%
Loans Pulte Mortgage made as a share of loan opportunities from PulteGroup home closings, excluding cash closings.
These are the company's own measures, defined by the company. They are not comparable across companies, and they are not added together. Each sits beside the nearest official (GAAP) figure.
Learn: Non-GAAP measures: what a company's "adjusted" numbers leave out
18Financial strength and debt
18Financial strength · Sep 30, 2026
How much debt does PulteGroup have?
- Total debt$1.8B
- Cash and investments$1.4B
- Net debt (debt minus cash)$401M
- Net worth (shareholders' money)$13.1B
- Debt to equity
- 0.14×
- $ of debt for every $1 of shareholders' money
- Net debt is notes payable of $1,808.9 million minus cash and restricted cash of $1,408.0 million, as the Q3 FY2026 earnings release reconciles it. At Dec 31, 2025 the company had net cash of $377.7 million.
- The release states debt-to-capital of 12.1% at Sep 30, 2026, against 11.2% at Dec 31, 2025.
- Financial Services debt of $383.2 million (Pulte Mortgage borrowings secured by mortgages awaiting sale) is left out of these figures.
- In February 2026 PulteGroup sold $800 million of notes ($400 million at 4.250% due 2031 and $400 million at 4.900% due 2036). It repaid $612.7 million of notes in the first nine months of 2026.
- Its revolving credit line, amended on Feb 4, 2026 to $1.75 billion and a 2031 maturity, was undrawn at Sep 30, 2026 apart from $368.3 million of letters of credit.
19Who owns it
19Who owns it · ownership as of Mar 5, 2026
Who owns PulteGroup?
Share classes
Holders of 5% or more
From the company's proxy statement (DEF 14A), later Schedule 13G filings and the share counts on its latest annual or quarterly report. Each holder row shows the date of its own filing.
Learn: How to read a proxy statement (DEF 14A): Nvidia's 2026 proxy · Form 4 insider filings: who files, the codes and the footnotes
20What it does with profit
20What it does with profit
What does PulteGroup do with its profit?
Dividend per share
$0.92FY2025
Dividend paid for each share, by financial year.
$ per share
See the numbers
Buyback · Dec 31, 2023
FY2023: bought 13.8 million shares for $1.0 billion.
$1.0B
Buyback · Dec 31, 2024
FY2024: bought 10.1 million shares for $1.2 billion.
$1.2B
Buyback · Dec 31, 2025
FY2025: bought 10.6 million shares, 5.2% of shares outstanding, for $1.2 billion.
$1.2B
Buyback · Sep 30, 2026
First nine months of 2026: bought 8.4 million shares; cash paid was $1.0 billion.
$1.0B
21Governance signals
21Governance signals
What do PulteGroup's governance filings show?
- Auditor
- Ernst & Young LLP, since 1973
- Auditor changes
- None in the period covered
- Audit qualifications
- None reported
- Related-party dealings
- The 2026 proxy reports one related-party item: the chairman's son-in-law works as a manager in the Central Florida division and was paid less than $250,000 in 2025. It reports no other such transactions since Jan 1, 2025.
- Credit rating
- Moody's, S&P Global Ratings and Fitch (expected ratings in the Feb 10, 2026 notes pricing term sheet) Baa1 (Moody's) / BBB+ (S&P) / A- (Fitch) (outlook Stable (all three)), Feb 10, 2026
A credit rating describes the company's ability to repay debt. It is not a rating of the share.
Flags to know about
other
Construction defect claims
The FY2025 10-K says PulteGroup faces various legal proceedings, many over alleged construction defects. The company does not expect a material impact. The Q3 FY2026 10-Q reports no material developments.
22How it got here
22How it got here
How did PulteGroup get here?
1950
Milestone
First home
Founder Bill Pulte built his first home; the company dates its founding to this year.
1956
Milestone
Incorporated in Michigan
PulteGroup, Inc. is still a Michigan corporation, though it is based in Atlanta.
2009
Business-model change
Buys Centex
Centex is still one of its brands; claims on loans from a former Centex mortgage unit are still listed as a risk.
2016
Milestone
Ryan Marshall becomes CEO
He became President in Feb 2016 and CEO in Sep 2016.
2020
Milestone
Buys a framing maker
It bought Innovative Construction Group, an offsite framing company in Jacksonville, Florida, for $104 million.
2024
Milestone
Highest revenue of the five years shown
Revenue reached $17.9 billion and net income $3.1 billion; SG&A included $333.9 million of insurance reserve reversals.
2025
Crisis
Margins fall as incentives rise
The home sale gross margin fell from 28.9% to 26.3%, and land impairments reached $77.4 million.
2026
Milestone
New notes and a bigger buyback
It sold $800 million of notes in February and added $1.5 billion to its buyback authorization in April.
23Sources and changes
Where every number on this page comes from
Sources (22 documents)
- S1PulteGroup, Inc. FY2025 Form 10-K · SEC EDGAR · Tier 1: company or exchange filing · Feb 4, 2026
- S2PulteGroup, Inc. FY2024 Form 10-K · SEC EDGAR · Tier 1: company or exchange filing · Feb 6, 2025
- S3PulteGroup, Inc. FY2023 Form 10-K · SEC EDGAR · Tier 1: company or exchange filing · Feb 5, 2024
- S4PulteGroup, Inc. FY2022 Form 10-K · SEC EDGAR · Tier 1: company or exchange filing · Feb 6, 2023
- S5PulteGroup, Inc. FY2021 Form 10-K · SEC EDGAR · Tier 1: company or exchange filing · Feb 7, 2022
- S6PulteGroup, Inc. Q3 2026 Form 10-Q · SEC EDGAR · Tier 1: company or exchange filing · Oct 22, 2026
- S7PulteGroup, Inc. Q2 2026 Form 10-Q · SEC EDGAR · Tier 1: company or exchange filing · Jul 22, 2026
- S8PulteGroup, Inc. Q1 2026 Form 10-Q · SEC EDGAR · Tier 1: company or exchange filing · Apr 23, 2026
- S9PulteGroup, Inc. Q3 2026 earnings release (8-K Ex. 99.1) · SEC EDGAR · Tier 1: company or exchange filing · Oct 22, 2026
- S12PulteGroup, Inc. Q4 2025 earnings release (8-K Ex. 99.1) · SEC EDGAR · Tier 1: company or exchange filing · Jan 29, 2026
- S13PulteGroup, Inc. Q3 2025 earnings release (8-K Ex. 99.1) · SEC EDGAR · Tier 1: company or exchange filing · Oct 21, 2025
- S16PulteGroup, Inc. Q4 2024 earnings release (8-K Ex. 99.1) · SEC EDGAR · Tier 1: company or exchange filing · Jan 30, 2025
- S17PulteGroup, Inc. 2026 Proxy Statement (DEF 14A) · SEC EDGAR · Tier 1: company or exchange filing · Mar 13, 2026
- S18PulteGroup, Inc. Pricing term sheet (FWP), 4.250% notes due 2031 and 4.900% notes due 2036, expected ratings · SEC EDGAR · Tier 1: company or exchange filing · Feb 10, 2026
- S19PulteGroup, Inc. 8-K Item 1.01: Pulte Mortgage $625 million master repurchase agreement · SEC EDGAR · Tier 1: company or exchange filing · Aug 12, 2026
- S20PulteGroup, Inc. 8-K Item 1.01: credit facility · SEC EDGAR · Tier 1: company or exchange filing · Feb 20, 2026
- S23PulteGroup, Inc. Form 10-Q for Q3 FY2025 · SEC EDGAR · Tier 1: company or exchange filing · Oct 21, 2025
- S24PulteGroup, Inc. Form 10-Q for Q2 FY2025 · SEC EDGAR · Tier 1: company or exchange filing · Jul 22, 2025
- S25PulteGroup, Inc. Form 10-Q for Q1 FY2025 · SEC EDGAR · Tier 1: company or exchange filing · Apr 22, 2025
- S26PulteGroup, Inc. Form 10-Q for Q3 FY2024 · SEC EDGAR · Tier 1: company or exchange filing · Oct 22, 2024
- S27PulteGroup, Inc. Form 10-Q for Q2 FY2024 · SEC EDGAR · Tier 1: company or exchange filing · Jul 23, 2024
- S28PulteGroup, Inc. Form 10-Q for Q1 FY2024 · SEC EDGAR · Tier 1: company or exchange filing · Apr 23, 2024
Changes to this page (v1 · Nov 20, 2026)
- v1 · Nov 20, 2026First version. (first version)
Numbers come only from tier 1 and tier 2 sources. Read how we research.
Disclaimer
For learning only. Cityfort is not a registered investment adviser or broker-dealer and does not recommend buying or selling any security. Prices shown are dated and may be out of date.
Investing in securities involves risk, including loss of capital. Before making any investment decision, do your own research and consider consulting a registered investment adviser or other qualified professional.
Cityfort, its owners and contributors may or may not hold securities of companies covered. Cityfort is not paid by any company it covers. Content is not an offer or solicitation to buy or sell any security, including in any initial public offering.
Read the positions policyRead the full disclaimerHide the full disclaimer
Cityfort publishes general educational content that explains how listed companies work. Cityfort is not registered with the US Securities and Exchange Commission or any state securities regulator as an investment adviser, and is not a broker-dealer or a member of FINRA. Cityfort does not provide investment, tax or legal advice, recommendations, ratings, price targets or any opinion on whether to buy, sell or hold any security. Nothing on the site is tailored to any person's circumstances.
All information is taken from publicly available sources, mainly company filings with the SEC, which are listed on each page with dates. We work to keep it accurate and correct errors publicly, but we do not guarantee that it is complete, accurate or up to date. Any market price or price-based ratio shown is dated, may be out of date by the time you read it, and is included only to explain concepts.
Statements by company management, including forward-looking statements and guidance, are reported as the company's statements, with their date and source; they are not our forecasts. Adjusted (non-GAAP) figures are the company's own measures and are shown next to the official (GAAP) figures.