Consumer Staples · NASDAQ: KDP
Keurig Dr Pepper: how the business works
Keurig Dr Pepper sells soft drinks such as Dr Pepper and Canada Dry, plus Keurig coffee machines and K-Cup pods, with net sales of $16.60 billion in FY2025.
By Hardik Bhandare · Checked against filings: . Editorial policy. Corrections
Follow Keurig Dr Pepper
Email me when Keurig Dr Pepper's page is updated after earnings.
We'll send a confirmation email first. See our privacy policy.
Keurig Dr Pepper Inc. · Frisco, Texas and Burlington, Massachusetts · Founded 2018
Updated for Q3 FY2026 · checked
- Net sales, FY2025
- $16.60B
- Net income, FY2025
- $2.08B
- Net sales, Q3 FY2026 (with JDE Peet's)
- $7.34B
- Borrowings, Sep 30, 2026
- $28.87B
- Employees, end of FY2025
- 30,600
The short version
Keurig Dr Pepper in 5 points
1 · What it sells
Keurig Dr Pepper sells soft drinks such as Dr Pepper, Canada Dry and Snapple, plus Keurig brewers and K-Cup pods, with net sales of $16.60 billion in FY2025.
2 · Who pays it
In FY2025 Walmart paid about 16% of net sales, and other retailers, bottlers, coffee brand partners, offices, hotels and online shoppers paid the other 84%.
3 · What it keeps from $100
Of every $100 that came in during FY2025, KDP kept $12.52 as net income after $45.78 of cost of sales; operating income was $3.58 billion.
4 · Where the operating profit comes from
U.S. Refreshment Beverages earned $2.94 billion of FY2025 segment operating income, U.S. Coffee $962 million and International $546 million, before $872 million of unallocated corporate costs.
5 · The one thing to watch
Borrowings rose to $28.87 billion at Sep 30, 2026 from $16.14 billion at Dec 31, 2025, and the Nov 2026 prospectus expects KDP to split into two companies in early 2027.
Sources: From Keurig Dr Pepper's FY2025 10-K, its Q3 FY2026 10-Q and its Nov 2026 prospectus supplement · checked
01Where the money goes · FY2025
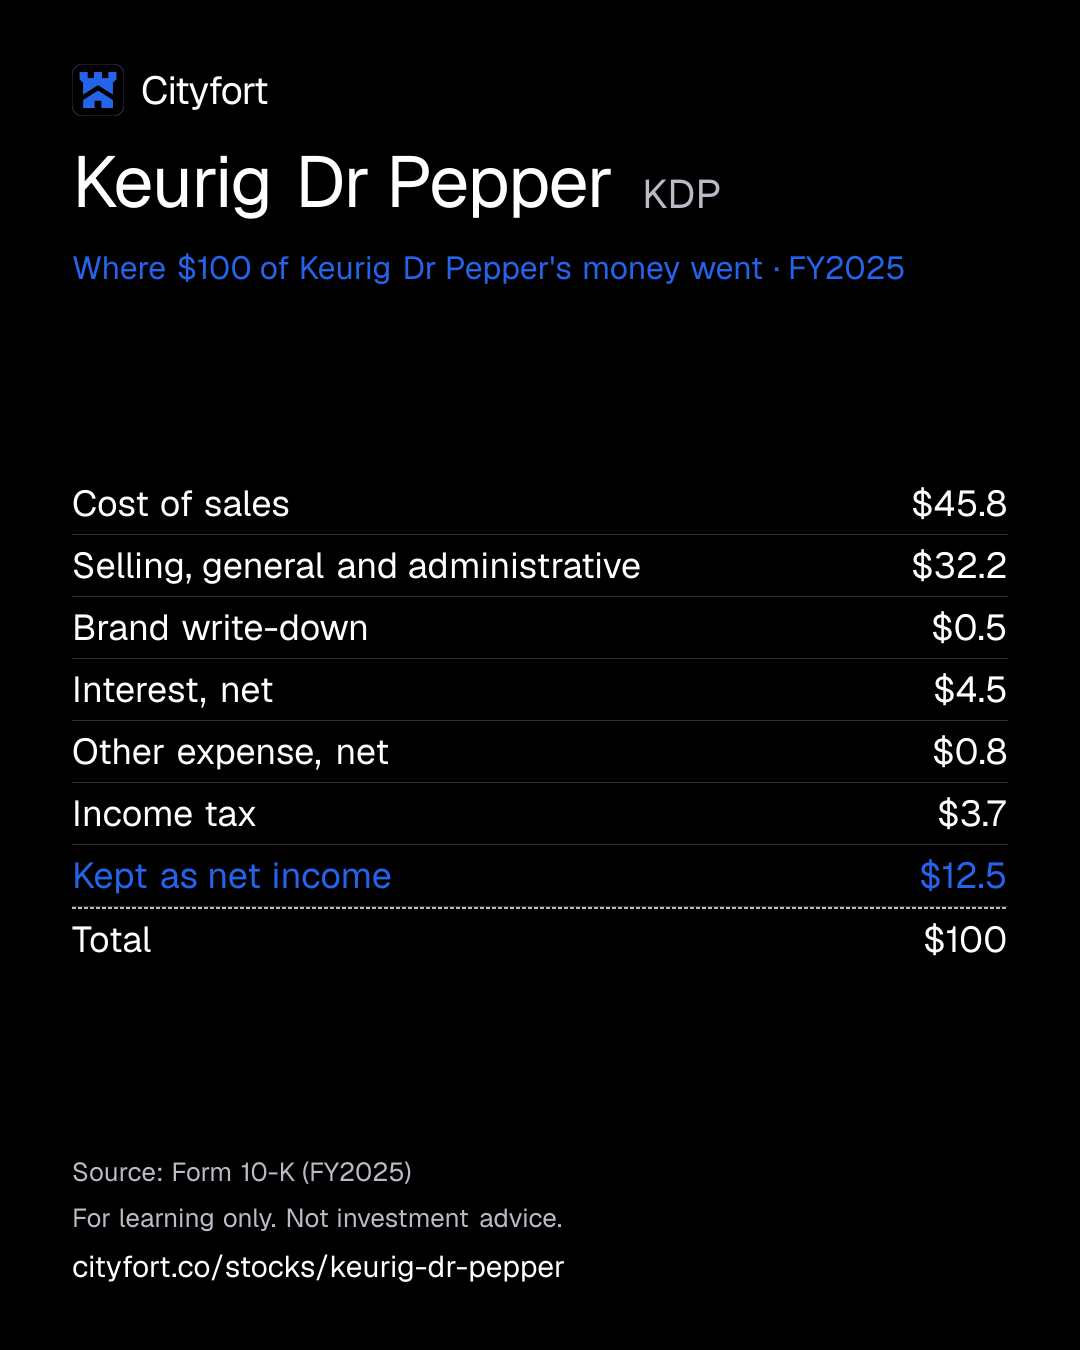
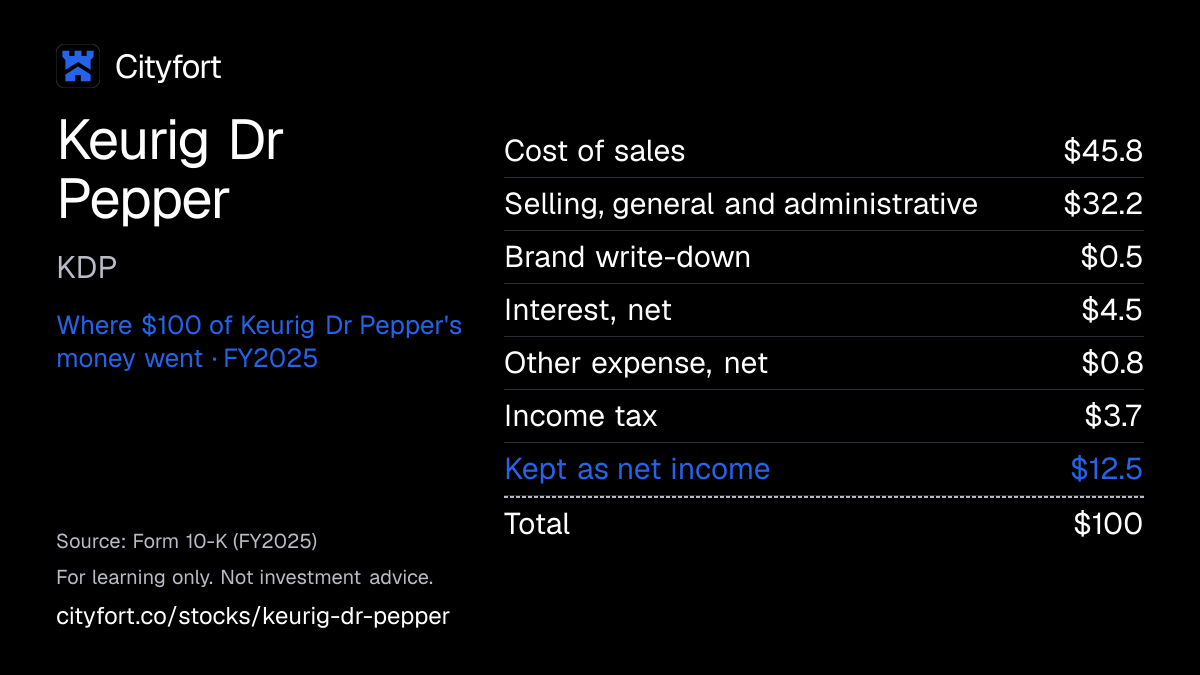
Where does $100 of Keurig Dr Pepper's money go?
Keurig Dr Pepper · FY2025
Receipt for every $100
| Cost of sales | $45.8 |
|---|---|
| Selling, general and administrative | $32.2 |
| Brand write-down | $0.5 |
| Interest, net | $4.5 |
| Other expense, net | $0.8 |
| Income tax | $3.7 |
| Kept as net income | $12.5 |
| Total | $100 |
Each line = amount ÷ total money in × 100. Lines may not add to exactly $100 because of rounding.
How this is worked out
Cityfort calculation from the FY2025 10-K. Of every $100 that came in during FY2025 (net sales of $16,603 million plus $5 million of other operating income, $16,608 million in all): each line = line ÷ $16,608 million × 100.
Save this receipt as an image
Embed this receipt or the key numbers
Paste this code into a blog or website to show the card you choose, with a link back to this page.
Each week: the next company due to report earnings, explained in 5 points.
No tips. Unsubscribe anytime.
We'll send a confirmation email. See our privacy policy.
02The business in one line
What does Keurig Dr Pepper do?
Stores, bottlers and coffee brands pay Keurig Dr Pepper for drinks, soda concentrate, K-Cup pods and brewers. In FY2025, $45.78 of every $100 went on cost of sales and $12.52 was left as net income.
- Walmart alone paid about 16% of FY2025 net sales; bottlers buy concentrate, and coffee brands such as Starbucks and Dunkin' pay KDP to make their pods.
- Cold drinks are the biggest part: U.S. Refreshment Beverages had $10.44 billion of FY2025 net sales, 62.9% of the total.
- KDP bought JDE Peet's on Apr 1, 2026 for about $17.9 billion; it brought in $2.65 billion of net sales in Q3 FY2026.
03Who pays it
Who pays Keurig Dr Pepper?
Retailers
Share of revenue not disclosed
Supermarkets, mass merchants such as Walmart, club stores, convenience stores and online sellers buy finished drinks, pods and brewers.
Walmart
16%
of revenue
KDP's largest retailer, with $2.65 billion of net sales in FY2025; the 10-K counts Walmart sales in each of its three segments.
Bottlers and distributors
Share of revenue not disclosed
Companies with long, usually exclusive regional licenses to bottle KDP sodas in the US and Canada; they buy concentrate and some finished drinks.
Coffee brand partners
Share of revenue not disclosed
Brands such as Starbucks, Dunkin', Folgers and Peet's pay KDP to make their K-Cup pods, then sell them to stores.
Offices, hotels and online shoppers
Share of revenue not disclosed
Office coffee distributors and hotel chains buy brewers and pods; households buy direct at keurig.com and keurig.ca.
Customer concentration
Walmart was about 16% of net sales in FY2025 (16.4% in FY2024), the only customer above 10%. KDP does not disclose its top five or top ten customers.
- Largest customer
- 16%
04How it makes money
How does Keurig Dr Pepper make money?
Brands that other companies help deliver, plus pods that sell again and again
KDP earns on concentrate it sells to bottlers and on drinks it delivers itself. On the coffee side, each Keurig brewer in a home creates repeat pod sales. In FY2025 it kept $12.52 of net income per $100 that came in.
Net income per $100 of net sales
$16.9$12.5
FY2021 to FY2025
- KDP builds brands like Dr Pepper and Canada Dry
- Bottlers and its own trucks put the drinks in stores
- Keurig brewers go into homes and offices
- Owners keep buying K-Cup pods, including partner brands
- Cash funds marketing, new drinks and debt payments
↺ Step 5 feeds back into step 1.
05Business segments · FY2025
Which businesses make up Keurig Dr Pepper?
U.S. Refreshment Beverages
62.9%Sodas, juices, waters and energy drinks in the US, sold as concentrate to bottlers or as finished drinks.
Revenue $10.4B ($10,439M) · Operating profit $2.9B ($2,939M)
U.S. Coffee
24%Keurig brewers, K-Cup pods and bagged coffee in the US.
Revenue $4.0B ($3,990M) · Operating profit $962M
International
13.1%Drinks in Canada, Mexico and the Caribbean and coffee in Canada. Renamed KDP International in 2026, when JDE Peet's became a fourth segment.
Revenue $2.2B ($2,174M) · Operating profit $546M
How the mix changed
- U.S. Refreshment Beverages
- U.S. Coffee
- International
Revenue by segment, FY2023 to FY2025.
US$
See the numbers
06The numbers · Consolidated · US$
How has Keurig Dr Pepper done?
Revenue
$16.6BFY2025
Net sales rose every year from $12.68 billion in FY2021 to $16.60 billion in FY2025. Quarters from Q2 FY2026 include JDE Peet's, bought on Apr 1, 2026, so they do not compare with earlier quarters.
US$
See the numbers
Net income
$2.1BFY2025
Net income fell to $1.44 billion in FY2024, a year with $718 million of goodwill and brand write-downs, and rose to $2.08 billion in FY2025. From Q2 FY2026 the quarterly figure is the part for common shareholders: in Q3 FY2026 that was $810 million of $952 million total net income, after $70 million to non-controlling interests and $72 million allocated to preferred holders.
US$
See the numbers
Net income for every $100 of revenue
$12.5FY2025
EBITDA (operating income plus depreciation and amortization) was $25.10 per $100 of net sales in FY2025, up from $20.50 in FY2024, when the write-downs cut operating income.
Net margin: $ of net income per $100 of revenue
See the numbers
Free cash flow
$1.5BFY2025
Free cash flow (operating cash flow minus capital spending) was $1.51 billion in FY2025, down from $2.45 billion in FY2021.
US$ · cash from operations minus spending on plants and equipment
See the numbers
See all yearly numbers
EBITDA here = operating income plus depreciation and amortization (from the cash flow statement). Fiscal years are the company's own: Fiscal year ends Dec 31. Net income is the share belonging to the company's owners.
Learn: Fiscal years that don't end in December: Nvidia's FY2027 explained · Stock-based compensation and dilution: pay that becomes shares
Sources (17)
- Form 10-K for FY2021
- Form 10-K for FY2022
- Form 10-K for FY2023
- Form 10-K for FY2024
- Form 10-K for FY2025
- Form 10-Q for Q1 FY2024
- Form 10-Q for Q2 FY2024
- Form 10-Q for Q3 FY2024
- Q4 FY2025 earnings release (8-K Ex. 99.1)
- Form 10-Q for Q1 FY2025
- Form 10-Q for Q2 FY2025
- Form 10-Q for Q3 FY2025
- Form 10-Q for Q1 FY2026
- Form 10-Q for Q2 FY2026
- Q2 FY2026 earnings release (8-K Ex. 99.1)
- Form 10-Q for Q3 FY2026
- Q3 FY2026 earnings release (8-K Ex. 99.1)
07Who runs it
Who runs Keurig Dr Pepper, and did they deliver?
Timothy Cofer
Chief Executive Officer · since 2024
CEO and director since Apr 26, 2024; chief operating officer from Nov 2023. The only director who is not independent.
Anthony DiSilvestro
Chief Financial Officer · since 2025
Named in late 2025.
Rafael Oliveira
CEO, Coffee operating unit · since 2026
Named in April 2026 to lead the coffee business and the planned Global Coffee Co.; CEO of JDE Peet's since Nov 2024.
Pamela Patsley
Independent Chair · since 2026
Chair from Apr 1, 2026, after Robert Gamgort left the board.
What they said, and what happened
1 delivered · 4 too early to tell
Said on Feb 24, 2026
Complete the JDE Peet's purchase, with 2026 guidance assuming an early April close.
DeliveredWhat happened
The deal closed on Apr 1, 2026; the last shares were bought out in October 2026.
Said on Feb 24, 2026
2026 net sales of $25.9 billion to $26.4 billion and low-double-digit adjusted EPS growth at constant currency.
Too early to tellWhat happened
Reaffirmed on Nov 3, 2026; nine-month net sales were $18.63 billion.
Said on Aug 6, 2026
A pro forma leverage ratio of about 4.1x at the end of 2026.
Too early to tellWhat happened
Not yet reported.
Said on Feb 24, 2026
Launch the Keurig Alta brewer and K-Rounds pods, made without plastic or aluminum, in late 2026.
Too early to tellWhat happened
Not yet reported.
Said on Aug 6, 2026
Separate into two companies in early 2027.
Too early to tellWhat happened
The Nov 2026 prospectus still expects early 2027, subject to market and other conditions.
Sources (8)
08What could go wrong
What could go wrong for Keurig Dr Pepper?
- Debt
Much more debt after JDE Peet's
Borrowings rose to $28.87 billion at Sep 30, 2026 from $16.14 billion at Dec 31, 2025. The 10-K warns more debt could raise borrowing costs and limit flexibility.
Watch Principal debt and the leverage ratio in each release, and any further rating action.
- Execution
Splitting into two companies
The Nov 16, 2026 prospectus says KDP expects to separate its drinks and coffee businesses in early 2027. The FY2025 10-K says it may not gain the expected benefits and could face extra costs and disruption.
Watch The filing of separation documents and the final timetable.
- Concentration
Reliance on bottlers
Third-party bottlers, some of which also bottle for competitors, distribute much of KDP's soda. Most can end their agreements without cause.
Watch Changes to large bottling or distribution agreements.
- Concentration
One large retailer
Walmart was about 16% of net sales in FY2025. The 10-K says large retailers can push for lower prices and more promotion.
Watch Walmart's share of net sales in the FY2026 10-K.
- Raw-material prices
Coffee prices and pod demand
Green coffee, aluminum, PET and sweetener costs can swing. U.S. Coffee prices fell 4.2% in Q3 FY2026, and U.S. Coffee K-Cup pod volume fell 4.8% in FY2025.
Watch U.S. Coffee price and volume figures in each release.
- Legal
Antitrust lawsuit over Keurig pods
Since 2014, TreeHouse Foods and others have sued Keurig, contending it monopolized alleged markets for single-serve brewers and pods. Before rulings in Sep and Oct 2026, these plaintiffs claimed more than $1.5 billion of damages.
Watch Court rulings on damages and any trial date.
- Governance
Preferred stock ranks ahead of common
The $4.5 billion of convertible preferred carries voting rights on an as-converted basis and a 4.75% dividend. If KDP defers that dividend, it cannot pay common dividends or buy back common shares, subject to certain conditions.
Watch Preferred dividends paid and any conversion into common shares.
09Supporters vs. critics
What do supporters and critics point to?
What supporters point to
- Net sales rose every year, from $12.68 billion in FY2021 to $16.60 billion in FY2025.
- U.S. Refreshment Beverages net sales rose 10.9% in Q3 FY2026, with volume and mix adding 7.2 points.
- KDP makes all K-Cup pods for its own and licensed brands, and also makes pods for Starbucks, Dunkin', Folgers and Peet's.
- JDE Peet's had GAAP operating income of $289 million in Q3 FY2026, its second quarter under KDP.
- In Nov 2026 KDP sold 57,971,015 new shares and said it would use the money to repay or repurchase debt.
What critics point to
- Borrowings rose to $28.87 billion at Sep 30, 2026 from $16.14 billion at Dec 31, 2025, and Moody's and S&P cut their ratings on Mar 10, 2026.
- U.S. Coffee prices fell 4.2% in Q3 FY2026, and in Nov 2026 management put constant-currency adjusted EPS growth for the legacy business at 3% to 5%, down from 4% to 6% for the standalone business in February.
- Net income was 16.9% of net sales in FY2021 and 12.5% in FY2025 (Cityfort calculation from the FY2021 and FY2025 10-Ks).
- Walmart paid about 16% of FY2025 net sales, and most bottlers can end their agreements with KDP without cause.
- Since 2014, TreeHouse Foods and others have sued Keurig, contending it monopolized alleged markets for brewers and pods; they claimed more than $1.5 billion of damages before rulings in Sep and Oct 2026.
10What to watch next
What should you watch next at Keurig Dr Pepper?
Next event
Q4 FY2026 results
Date not announced yet.
The split into two companies
The Nov 2026 prospectus expects the drinks and coffee businesses to separate in early 2027, subject to market and other conditions; the separation filings will set the final terms.
Paying down debt
Management said on Aug 6, 2026 it expected a pro forma leverage ratio of about 4.1x at the end of 2026; the FY2026 results will show the actual figure after the Nov 2026 share sale.
U.S. Coffee prices
U.S. Coffee volume and mix rose 6.9% in Q3 FY2026 but prices fell 4.2%; the FY2025 10-K expected the Keurig Alta brewer and K-Rounds pods to launch in late 2026.
11Key dates
What are the key dates for Keurig Dr Pepper?
| Event | Date | Source |
|---|---|---|
| Planned separation into Beverage Co. and Global Coffee Co.Expected in early 2027, subject to market and other conditions, per the Nov 2026 prospectus. | Not yet stated | 424B5 prospectus supplement, common stock offering |
| Keurig Alta brewer and K-Rounds pods launchThe FY2025 10-K expected a launch in late 2026. | Not yet stated | Form 10-K for FY2025 |
12Key facts
Key facts about Keurig Dr Pepper
- What does Keurig Dr Pepper do?
- Keurig Dr Pepper (NASDAQ: KDP) owns soft drink brands such as Dr Pepper, Canada Dry, 7UP and Snapple, and makes Keurig coffee brewers and K-Cup pods. Since Apr 1, 2026 it has also owned the coffee company JDE Peet's.
- How does Keurig Dr Pepper make money?
- Keurig Dr Pepper earns most from cold drinks: in FY2025 its U.S. Refreshment Beverages segment had $10.44 billion of net sales and $2.94 billion of operating income. U.S. Coffee earned $962 million and International $546 million, before $872 million of unallocated corporate costs.
- Who are Keurig Dr Pepper's customers?
- Walmart was Keurig Dr Pepper's largest customer, at about 16% of FY2025 net sales. The other 84% came from other retailers, bottlers and distributors, coffee brands such as Starbucks and Dunkin' whose pods KDP makes, offices, hotels and online shoppers.
- How big is Keurig Dr Pepper?
- Keurig Dr Pepper had net sales of $16.60 billion in FY2025, up from $15.35 billion in FY2024, and net income of $2.08 billion, up from $1.44 billion. FY2025 operating income was $3.58 billion. With JDE Peet's included, Q3 FY2026 net sales were $7.34 billion.
- Who owns Keurig Dr Pepper?
- No single holder controls Keurig Dr Pepper. According to the 2026 proxy statementThe yearly filing about shareholder votes, the board and executive pay. Learn more, FMR (Fidelity) held 10.0%, Capital World Investors 7.3%, BlackRock 6.8% and Harris Associates 6.3%; executive officers and directors together held under 1%.
- How much debt does Keurig Dr Pepper have?
- Keurig Dr Pepper's borrowings were $28.87 billion at Sep 30, 2026, up from $16.14 billion at Dec 31, 2025, after it borrowed to buy JDE Peet's. These are book values and exclude lease liabilities.
- What is JDE Peet's?
- JDE Peet's is a coffee company with brands such as Jacobs, L'OR and Peet's. Keurig Dr Pepper bought it on Apr 1, 2026 for total consideration of about $17.9 billion, and it had $2.65 billion of net sales in Q3 FY2026.
- Does Keurig Dr Pepper pay a dividend?
- Keurig Dr Pepper paid $0.92 per common share in dividends for FY2025, up from $0.89 in FY2024, and declared $0.23 per share in each of the first three quarters of 2026.
Terms on this page
- Capital expenditures (capex)
- Customer concentration
- Debt-to-equity
- Earnings per share (EPS)
- EBITDA
- Free cash flow
- Net debt
- Net margin
- Revenue vs net income
- Stock buyback
Each explains the term in plain English, with the same number from other companies on Cityfort.
Go deeper
More detail from the same filings. Open any section.
13What it sells
13What it sells
What does Keurig Dr Pepper sell?
Cold drinks (U.S. Refreshment Beverages)
Sodas, juices, waters and sports drinks sold across the US: Dr Pepper, Canada Dry, Mott's, A&W, GHOST, 7UP, Snapple and Core Hydration. KDP also distributes partner brands such as Vita Coco, Bloom, Electrolit and C4 Energy.
Keurig brewers and K-Cup pods (U.S. Coffee)
Single-serve coffee machines and the sealed pods they brew. KDP makes all pods for its own and licensed brands, such as Green Mountain Coffee Roasters and The Original Donut Shop, and makes pods for Starbucks, Dunkin', Folgers and Peet's.
KDP International
Drinks such as Peñafiel, Clamato and Canada Dry in Canada, Mexico and the Caribbean, plus Keurig brewers and pods in Canada.
JDE Peet's (from Apr 1, 2026)
A coffee business bought for about $17.9 billion, with brands such as Jacobs, L'OR and Peet's. It had $2.65 billion of net sales in Q3 FY2026.
Think of it like this
The Keurig side works like a printer and its ink: each brewer in a kitchen keeps using pods.
What it does
- Does: Sells concentrate (the flavor base) to bottlers, who add water, fizz and sweetener and sell the finished drink
- Does: Runs its own delivery network of about 8,100 vehicles in the US and 2,200 in Mexico
- Does: Makes K-Cup pods for other coffee brands, including Starbucks and Dunkin'
What it does not do
- Does not: Bottle all of its own sodas: in the US and Canada it licenses bottlers, some tied to Coca-Cola or PepsiCo, others independent
- Does not: Build Keurig brewers itself: contract makers in Asia do that
- Does not: Own the Starbucks, Dunkin' or Folgers brands it puts in pods
Sources (2)
14How the money flows
14How the money flows · FY2025
How does money flow through Keurig Dr Pepper?
Money in
- Net sales$16.6B
- Other operating income, net$5M
The company
Keurig Dr Pepper
$16.6B came in
Money out
- Cost of sales (coffee, cans, bottles, sweeteners, plant costs)$7.6B
- Selling, general and administrative costs$5.4B
- Brand write-down (impairment)$78M
- Interest on debt, net$754M
- Other expense, net$134M
- Income tax$608M
- Net income$2.1B
- Stores, bottlers and coffee partners paid KDP $16.60 billion for drinks, concentrate, pods and brewers in FY2025.
- $7.60 billion went on cost of sales: ingredients, packaging and running the plants.
- Selling, delivery trucks, marketing and head office cost $5.35 billion.
- Interest on debt took $754 million and income tax $608 million.
- $2.08 billion was left as net income.
Sources (1)
15What it needs to run
15What it needs to run
What does Keurig Dr Pepper need to run?
Ingredients and packaging
Green coffee, water, aluminum cans, PET bottles, sweeteners and pod materials were about 55% of cost of sales, per the FY2025 10-K.
Bottler partners
Third-party bottlers make and deliver many KDP sodas; some also bottle for Coca-Cola or PepsiCo.
Trucks and warehouses
About 8,100 vehicles in the US and 2,200 in Mexico. At Dec 31, 2025 KDP had 42 owned and 156 leased sites.
Contract brewer makers
Keurig designs most of its brewers; third-party factories in Asia build them.
People
About 30,600 employees at the end of FY2025, before JDE Peet's joined; about 23,200 of them in the US.
Sources (1)
16Where it sells
16Where it sells · FY2025
Where does Keurig Dr Pepper sell?
- United States87.3%
- Outside the US (Canada, Mexico, Caribbean, other)12.7%
Sources (1)
17Competitors and what protects it
17Competitors and what protects it
Who does Keurig Dr Pepper compete with?
Coca-Cola
NYSE: KO
Named as a main competitor in sodas and other drinks. Some bottlers of KDP sodas are affiliated with Coca-Cola.
PepsiCo
NASDAQ: PEP
Named as a main competitor. Some KDP bottlers are affiliated with PepsiCo.
Starbucks
NASDAQ: SBUX
Named as a main competitor in coffee, and also a partner brand whose K-Cup pods KDP makes.
The J.M. Smucker Company
Named in KDP's FY2025 10-K as a main competitor.
Kraft Heinz
NYSE: KHC
Named in KDP's FY2025 10-K as a main competitor.
Nestlé
Named in KDP's FY2025 10-K as a main competitor.
What protects the business
Each strength is scored 1 (weak) to 5 (strong) for the business, with the reason. It is not a rating of the share.
- Brands4 of 5
Owns Dr Pepper, Canada Dry, 7UP, A&W and Snapple; Dr Pepper is most of its fountain (restaurant) volume, per the 10-K.
- Pod system4 of 5
KDP makes 100% of pods for its owned and licensed brands, and makes pods for Starbucks, Dunkin', Folgers and Peet's.
- Distribution3 of 5
Runs about 8,100 delivery vehicles in the US and 2,200 in Mexico, and also delivers partner brands.
Weak spot
Bottlers it does not control
Some bottlers of KDP sodas also bottle for competitors, and most can end their agreements without cause, per the 10-K.
Sources (1)
18Where growth could come from
18Where growth could come from
Where could Keurig Dr Pepper's growth come from?
In its Nov 3, 2026 release, management reaffirmed 2026 net sales of $25.9 billion to $26.4 billion and adjusted EPS (earnings per share) growth in the low double digits at constant currency (leaving out exchange-rate moves). About $8.3 billion to $8.4 billion of the sales come from JDE Peet's. Management expects 3% to 5% EPS growth for the legacy business, citing "revised expectations for U.S. Coffee".
JDE Peet's
New$2.65B net sales, Q3 FY2026
Owned since Apr 1, 2026. Its GAAP operating income was $289 million in Q3, after a $62 million loss in Q2 that included deal and integration charges.
Status: New, recently announced.
U.S. Refreshment Beverages
Working+10.9% net sales, Q3 FY2026
Volume and mix added 7.2 points and price 3.7 points against Q3 FY2025.
Status: Working, on track against what the company said.
U.S. Coffee
Mixed+2.7% net sales, Q3 FY2026
Volume and mix rose 6.9% but prices fell 4.2%. In Nov 2026 management put constant-currency adjusted EPS growth for the legacy business at 3% to 5%, down from 4% to 6% for the standalone business in February, citing U.S. Coffee.
Status: Mixed, partly on track.
KDP International
Mixed+11.0% net sales, Q3 FY2026
Sales rose but adjusted operating income fell 0.6%; the release cites a Mexico beverage tax and marketing.
Status: Mixed, partly on track.
Split into two companies
EarlyPlanned for early 2027
In its 2026 proxy statement (Apr 24, 2026), KDP described the split into Beverage Co. and Global Coffee Co. (working names). The Nov 2026 prospectus expects it in early 2027, subject to market and other conditions.
Status: Early, too early to judge.
Status compares progress with what the company itself said it would do: Working = on track against what the company said; Mixed = partly on track; Behind = behind the company's own plan; New = recently announced; Early = too early to judge.
19The company's own measures (non-GAAP)
19The company's own measures · FY2025 to Q3 FY2026
What do Keurig Dr Pepper's own measures show?
Official (GAAP): Operating income, Q4 FY2025
$881M
Company's own measure: Adjusted operating income, Q4 FY2025
$1.2B
KDP's own measure, leaving out items it says affect comparability, such as the $78 million brand write-down.
Official (GAAP): Diluted EPS, Q3 FY2026
$0.59
Company's own measure: Adjusted diluted EPS, Q3 FY2026
$0.66
Leaves out deal, integration and financing costs for JDE Peet's, the $400 million gain on selling the Chobani stake and other items.
Official (GAAP): Diluted EPS, nine months to Sep 30, 2026
$0.85
Company's own measure: Adjusted diluted EPS, nine months to Sep 30, 2026
$1.65
Same adjustments over nine months; the gap is wider because of JDE Peet's deal costs in Q2.
Official (GAAP): JDE Peet's operating income, Q3 FY2026
$289M
Company's own measure: JDE Peet's adjusted operating income, Q3 FY2026
$480M
Leaves out acquisition and integration costs for the new segment.
Official (GAAP): Cash from operations, FY2025
$2.0B
Company's own measure: Free cash flow (company definition), FY2025
$1.5B
KDP deducts purchases of property and equipment, adds proceeds from asset sales and certain excluded items. It includes a $225 million payment to end GHOST distribution rights.
Official (GAAP): Operating income, FY2025
$3.6B
Company's own measure: Adjusted EBITDA, 12 months to Dec 31, 2025
$4.9B
KDP's own profit measure before interest, tax, depreciation and amortization, also leaving out items it treats as one-off.
These are the company's own measures, defined by the company. They are not comparable across companies, and they are not added together. Each sits beside the nearest official (GAAP) figure.
Learn: Non-GAAP measures: what a company's "adjusted" numbers leave out
20Financial strength and debt
20Financial strength · Sep 30, 2026
How much debt does Keurig Dr Pepper have?
- Total debt$28.9B
- Cash and investments$1.3B
- Net debt (debt minus cash)$27.6B
- Net worth (shareholders' money)$25.4B
- Debt to equity
- 1.14×
- $ of debt for every $1 of shareholders' money
- Borrowings are the book value of short-term borrowings and current debt ($7,270 million) plus long-term obligations ($21,595 million); they exclude lease liabilities. Net debt and debt-to-equity are Cityfort calculations from the Q3 FY2026 10-Q; the Dec 31, 2025 total is a Cityfort calculation from the FY2025 10-K.
- The Q3 FY2026 earnings release puts principal debt at $29,235 million: $24,805 million of senior notes, $3,188 million of term loan and $1,242 million of commercial paper.
- Equity shown is stockholders' equity of $25,426 million. Outside it sit $4,418 million of convertible preferred stock (liquidation preference $4,500 million) and $4,205 million of non-controlling interests, the stakes outside investors hold in KDP businesses such as the pod joint venture.
- On Nov 16, 2026, after the balance sheet date, KDP completed a sale of 57,971,015 new shares at $34.50 each. It said it would use the proceeds to repay or repurchase debt.
- In its Aug 6, 2026 release management said it expected its own leverage ratio (principal debt less cash, divided by adjusted EBITDA, on a pro forma basis) to be about 4.1x at the end of 2026.
Sources (7)
- Form 10-Q for Q3 FY2026
- Form 10-K for FY2025
- Q3 FY2026 earnings release (8-K Ex. 99.1)
- Q2 FY2026 earnings release (8-K Ex. 99.1)
- 8-K filed Nov 16, 2026 (common stock offering completed)
- 424B5 prospectus supplement, common stock offering
- 8-K filed Apr 1, 2026 (preferred stock and pod joint venture closing)
21Who owns it
21Who owns it · ownership as of Apr 20, 2026
Who owns Keurig Dr Pepper?
- Officers and directors (as a group), shares
- 0.3%
Share classes
Holders of 5% or more
From the company's proxy statement (DEF 14A), later Schedule 13G filings and the share counts on its latest annual or quarterly report. Each holder row shows the date of its own filing.
Learn: Dual-class shares: when votes and ownership don't match · How to read a proxy statement (DEF 14A): Nvidia's 2026 proxy · Form 4 insider filings: who files, the codes and the footnotes
22What it does with profit
22What it does with profit
What does Keurig Dr Pepper do with its profit?
Dividend per share
$0.92FY2025
Dividend paid for each share, by financial year.
$ per share
See the numbers
Buyback · Dec 31, 2024
FY2024: share repurchases of $1,110 million.
$1.1B
Buyback · Dec 31, 2025
FY2025: share repurchases of $9 million; the $4 billion program ended on Dec 31, 2025.
$9M
Sources (1)
23Governance signals
23Governance signals
What do Keurig Dr Pepper's governance filings show?
- Auditor
- Deloitte & Touche LLP, since 2006
- Auditor changes
- None in the period covered
- Audit qualifications
- None reported
- Related-party dealings
- KDP has commercial deals with companies tied to JAB, such as Peet's, Caribou, Einstein Bros and Krispy Kreme. JAB BevCo owned more than 5% of KDP until May 5, 2025.
- Credit rating
- Moody's and S&P Global Ratings (as stated in the Q3 FY2026 10-Q) Baa3 (Moody's) / BBB- (S&P) (outlook Stable), Mar 10, 2026
A credit rating describes the company's ability to repay debt. It is not a rating of the share.
Flags to know about
late filing
One late insider report
The 2026 proxy reports one late Form 3, for Olivier Lemire, filed on Sep 17, 2025.
other
Rating cut after the JDE Peet's financing
Moody's lowered KDP to Baa3 from Baa1 and S&P to BBB- from BBB on Mar 10, 2026.
24How it got here
24How it got here
How did Keurig Dr Pepper get here?
2018
Milestone
Keurig and Dr Pepper Snapple combine
KDP was created on Jul 9, 2018 by combining Keurig's coffee business with Dr Pepper Snapple's drinks.
2024
Crisis
$718 million of write-downs
In Q4 FY2024 KDP wrote down $306 million of goodwill and $412 million of brand value, and FY2024 net income fell to $1.44 billion.
2025
Milestone
JAB drops below 5%
JAB BevCo, a long-time large owner, stopped being a 5% holder on May 5, 2025.
2025
Business-model change
Plan to split in two
On Aug 25, 2025 KDP announced it would buy JDE Peet's and then separate into a drinks company and a coffee company.
2026
Business-model change
Pod joint venture and preferred stock
On Mar 30, 2026 funds managed by Apollo, KKR and Goldman Sachs Asset Management paid about $4 billion for 49% of KDP's pod-making venture. KDP also issued $4.5 billion of convertible preferred stock.
2026
Business-model change
JDE Peet's bought
The purchase closed on Apr 1, 2026 for total consideration of about $17.9 billion, adding brands such as Jacobs, L'OR and Peet's.
2026
Milestone
Chobani stake sold
In September 2026 KDP sold its equity-method stake in Chobani, booking a $400 million gain.
2026
Milestone
New shares sold to cut debt
On Nov 16, 2026 KDP completed a sale of 57,971,015 common shares at $34.50 each.
Sources (9)
- Form 10-K for FY2025
- Q4 FY2025 earnings release (8-K Ex. 99.1)
- Form 10-K for FY2024
- 2026 proxy statement (DEF 14A)
- Form 10-Q for Q3 FY2026
- 8-K filed Apr 1, 2026 (preferred stock and pod joint venture closing)
- Q1 FY2026 earnings release (8-K Ex. 99.1)
- 8-K filed Nov 16, 2026 (common stock offering completed)
- 424B5 prospectus supplement, common stock offering
25Sources and changes
Where every number on this page comes from
Sources (22 documents)
- S1Form 10-Q for Q3 FY2026 · SEC EDGAR · Tier 1: company or exchange filing · Nov 9, 2026
- S2Form 10-Q for Q2 FY2026 · SEC EDGAR · Tier 1: company or exchange filing · Aug 10, 2026
- S3Form 10-Q for Q1 FY2026 · SEC EDGAR · Tier 1: company or exchange filing · Apr 23, 2026
- S4Form 10-K for FY2025 · SEC EDGAR · Tier 1: company or exchange filing · Feb 24, 2026
- S5Form 10-Q for Q3 FY2025 · SEC EDGAR · Tier 1: company or exchange filing · Oct 28, 2025
- S6Form 10-Q for Q2 FY2025 · SEC EDGAR · Tier 1: company or exchange filing · Jul 24, 2025
- S7Form 10-Q for Q1 FY2025 · SEC EDGAR · Tier 1: company or exchange filing · Apr 24, 2025
- S8Form 10-K for FY2024 · SEC EDGAR · Tier 1: company or exchange filing · Feb 25, 2025
- S9Form 10-Q for Q3 FY2024 · SEC EDGAR · Tier 1: company or exchange filing · Oct 24, 2024
- S10Form 10-Q for Q2 FY2024 · SEC EDGAR · Tier 1: company or exchange filing · Jul 25, 2024
- S11Form 10-Q for Q1 FY2024 · SEC EDGAR · Tier 1: company or exchange filing · Apr 25, 2024
- S12Form 10-K for FY2023 · SEC EDGAR · Tier 1: company or exchange filing · Feb 22, 2024
- S13Form 10-K for FY2022 · SEC EDGAR · Tier 1: company or exchange filing · Feb 23, 2023
- S14Form 10-K for FY2021 · SEC EDGAR · Tier 1: company or exchange filing · Feb 24, 2022
- S15Q3 FY2026 earnings release (8-K Ex. 99.1) · SEC EDGAR · Tier 1: company or exchange filing · Nov 3, 2026
- S16Q2 FY2026 earnings release (8-K Ex. 99.1) · SEC EDGAR · Tier 1: company or exchange filing · Aug 6, 2026
- S17Q1 FY2026 earnings release (8-K Ex. 99.1) · SEC EDGAR · Tier 1: company or exchange filing · Apr 23, 2026
- S18Q4 FY2025 earnings release (8-K Ex. 99.1) · SEC EDGAR · Tier 1: company or exchange filing · Feb 24, 2026
- S202026 proxy statement (DEF 14A) · SEC EDGAR · Tier 1: company or exchange filing · Apr 24, 2026
- S238-K filed Apr 1, 2026 (preferred stock and pod joint venture closing) · SEC EDGAR · Tier 1: company or exchange filing · Apr 1, 2026
- S248-K filed Nov 16, 2026 (common stock offering completed) · SEC EDGAR · Tier 1: company or exchange filing · Nov 16, 2026
- S25424B5 prospectus supplement, common stock offering · SEC EDGAR · Tier 1: company or exchange filing · Nov 16, 2026
Changes to this page (v1 · Nov 20, 2026)
- v1 · Nov 20, 2026First version. (first version)
Numbers come only from tier 1 and tier 2 sources. Read how we research.
Disclaimer
For learning only. Cityfort is not a registered investment adviser or broker-dealer and does not recommend buying or selling any security. Prices shown are dated and may be out of date.
Investing in securities involves risk, including loss of capital. Before making any investment decision, do your own research and consider consulting a registered investment adviser or other qualified professional.
Cityfort, its owners and contributors may or may not hold securities of companies covered. Cityfort is not paid by any company it covers. Content is not an offer or solicitation to buy or sell any security, including in any initial public offering.
Read the positions policyRead the full disclaimerHide the full disclaimer
Cityfort publishes general educational content that explains how listed companies work. Cityfort is not registered with the US Securities and Exchange Commission or any state securities regulator as an investment adviser, and is not a broker-dealer or a member of FINRA. Cityfort does not provide investment, tax or legal advice, recommendations, ratings, price targets or any opinion on whether to buy, sell or hold any security. Nothing on the site is tailored to any person's circumstances.
All information is taken from publicly available sources, mainly company filings with the SEC, which are listed on each page with dates. We work to keep it accurate and correct errors publicly, but we do not guarantee that it is complete, accurate or up to date. Any market price or price-based ratio shown is dated, may be out of date by the time you read it, and is included only to explain concepts.
Statements by company management, including forward-looking statements and guidance, are reported as the company's statements, with their date and source; they are not our forecasts. Adjusted (non-GAAP) figures are the company's own measures and are shown next to the official (GAAP) figures.