Energy · NYSE: EOG
EOG Resources: how the business works
EOG Resources drills shale wells across the US and sells the crude oil, gas liquids and natural gas, with total revenues and other of $22.6 billion in FY2025.
By Hardik Bhandare · Checked against filings: . Editorial policy. Corrections
Follow EOG Resources
Email me when EOG Resources's page is updated after earnings.
We'll send a confirmation email first. See our privacy policy.
EOG Resources, Inc. · Houston, Texas · Founded 1985
Updated for Q3 FY2026 · checked
- Total revenues and other, FY2025
- $22.6B
- Net income, FY2025
- $5.0B
- Proved reserves, Dec 31, 2025 (barrels of oil equivalent)
- 5,514 million
- Employees, Dec 31, 2025
- About 3,400
- Organized
- 1985
The short version
EOG Resources in 5 points
1 · What it sells
EOG Resources drills US shale wells and sells crude oil, natural gas liquids and natural gas, with total revenues and other of $22,632 million in FY2025.
2 · Who pays it
EOG names no customers; in FY2025 crude oil buyers paid 55.2% of revenue, natural gas buyers 12.3%, gas liquids buyers 10.5% and buyers of gathering, processing and marketing, mostly resold oil and gas, 21.7% (Cityfort calculation from the FY2025 10-K).
3 · What it keeps from $100
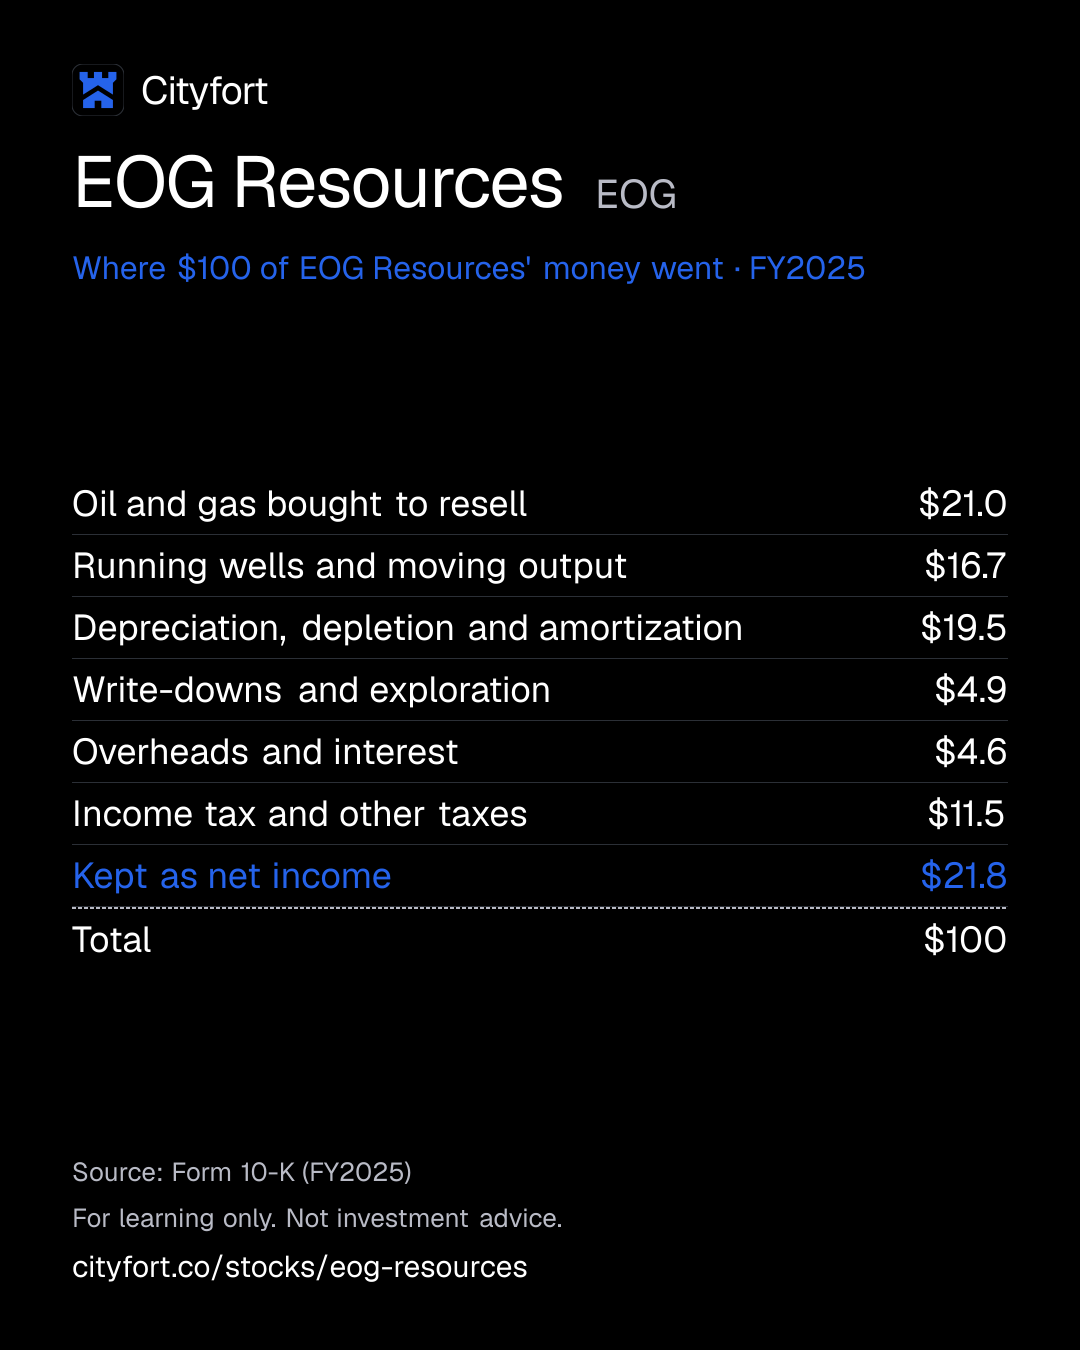
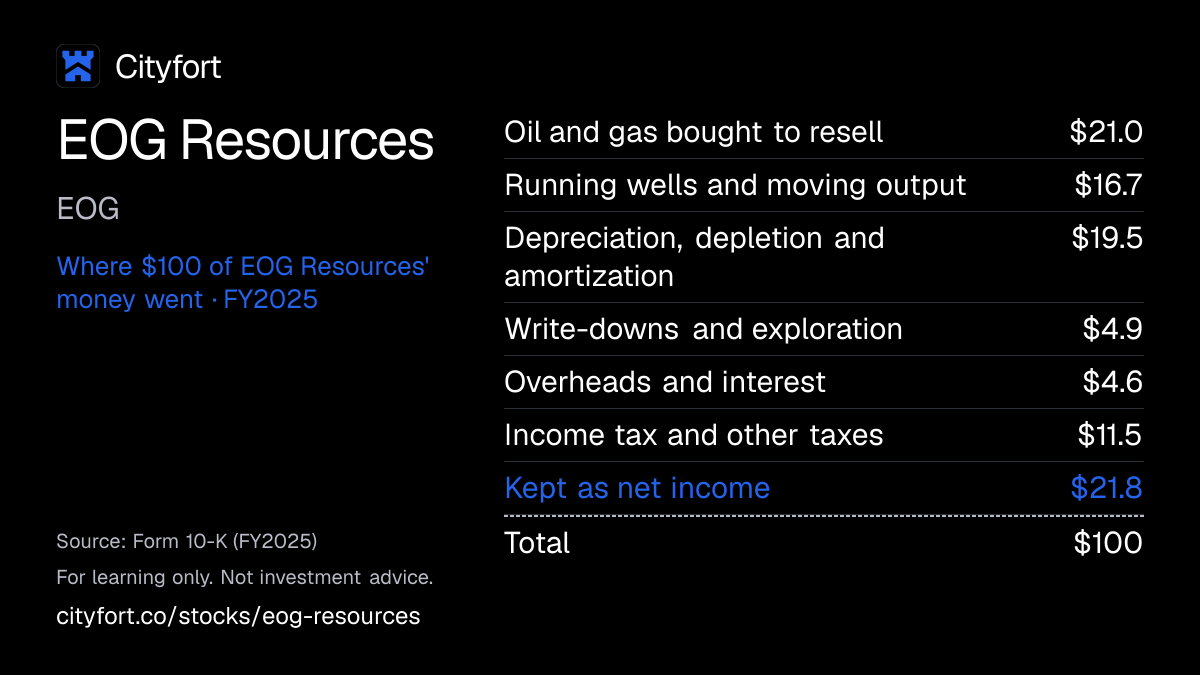
Of every $100 that came in during FY2025, EOG kept $21.8 as net income, which includes $212 million of other income, net; operating income was $28.0 per $100 (Cityfort calculation from the FY2025 10-K).
4 · Where the operating profit comes from
EOG's United States segment made $6,423 million of operating income in FY2025, more than the company total of $6,385 million: Trinidad made $48 million and Other International lost $86 million.
5 · The one thing to watch
EOG's Q3 FY2026 net income was $2,781 million, up from $1,471 million a year earlier; its 10-Q estimates each $1.00 a barrel change in oil prices moves 2026 net income by about $175 million.
Sources: From EOG's FY2025 10-K, Q3 FY2026 10-Q and Q3 FY2026 earnings release · checked
01Where the money goes · FY2025
Where does $100 of EOG Resources' money go?
EOG Resources · FY2025
Receipt for every $100
| Oil and gas bought to resell | $21.0 |
|---|---|
| Running wells and moving output | $16.7 |
| Depreciation, depletion and amortization | $19.5 |
| Write-downs and exploration | $4.9 |
| Overheads and interest | $4.6 |
| Income tax and other taxes | $11.5 |
| Kept as net income | $21.8 |
| Total | $100 |
Each line = amount ÷ total money in × 100. Lines may not add to exactly $100 because of rounding.
How this is worked out
Cityfort calculation from FY2025 10-K. Of every $100 that came in during FY2025: each line ÷ total revenues and other of $22,632 million plus other income, net of $212 million ($22,844 million). Taxes are $1,234 million of taxes other than income tax plus $1,382 million of income tax. Operating income, before other income, interest and income tax, was $6,385 million, or $28.0 per $100.
Save this receipt as an image
Embed this receipt or the key numbers
Paste this code into a blog or website to show the card you choose, with a link back to this page.
Each week: the next company due to report earnings, explained in 5 points.
No tips. Unsubscribe anytime.
We'll send a confirmation email. See our privacy policy.
02The business in one line
What does EOG Resources do?
Refiners and other buyers pay EOG market prices for its oil and gas. The biggest costs are oil and gas bought to resell, running wells and using up its fields. Of every $100 that came in during FY2025, $21.8 was left as net income.
- Crude oil brought in $12,501 million of EOG's FY2025 revenue, natural gas $2,791 million and gas liquids $2,376 million; gathering, processing and marketing, mostly reselling other producers' oil and gas, added $4,914 million.
- EOG does not set its prices: its Q3 FY2026 10-Q estimates that each $1.00 a barrel change in oil prices moves full-year 2026 net income by about $175 million.
- Wells pump less as they age, so EOG keeps drilling: it completed 641 net wells in 2025.
03Who pays it
Who pays EOG Resources?
Crude oil refiners and other oil buyers
55.2%
of revenue
Pay for crude oil and condensate at prices linked to market benchmarks.
Buyers of natural gas liquids
10.5%
of revenue
Pay for ethane, propane and other liquids.
Natural gas buyers
12.3%
of revenue
Include a liquefied natural gas (LNG) export plant at Corpus Christi and the National Gas Company of Trinidad and Tobago.
Buyers of resold oil and gas
21.7%
of revenue
Pay for oil and gas that EOG bought from other producers and marketed.
- Crude oil refiners and other oil buyers55.2%
- Buyers of natural gas liquids10.5%
- Natural gas buyers12.3%
- Buyers of resold oil and gas21.7%
How spread out the customers are
Two buyers, both crude oil refiners, each paid more than 10% of EOG's FY2025 revenues; the 10-K names neither and gives no percentages. EOG says losing one would not have a material adverse effect. Shares by buyer type are a Cityfort calculation from the FY2025 10-K (product revenue ÷ total revenues and other of $22,632 million).
04How it makes money
How does EOG Resources make money?
EOG earns the gap between market oil and gas prices and its cost to drill and run wells.
EOG cannot set its prices, so profit rises and falls with oil and gas markets. What it controls is cost per well. Its FY2025 10-K warns that long price declines can make some projects uneconomic.
Net income per $100 of revenue
$25$22
FY2021 to FY2025
- Lease land in shale basins
- Drill and frack wells at the lowest cost it can
- Sell oil, NGLs and gas at market prices
- Cash left after costs pays dividends and buybacks
- The rest funds new wells, since old wells decline
↺ Step 5 feeds back into step 1.
05Business segments · FY2025
Which businesses make up EOG Resources?
United States
98.4%Shale wells in the Delaware Basin, South Texas, the Utica and the Rocky Mountains.
Revenue $22.3B ($22,269M) · Operating profit $6.4B ($6,423M)
Trinidad
1.6%Gas sold to the state gas company, plus some oil.
Revenue $359M · Operating profit $48M
Other International
0%Projects in Bahrain and the United Arab Emirates.
Revenue $4M · Operating profit −$86M
How the mix changed
- United States
- Trinidad
- Other International
Revenue by segment, FY2024 to FY2025.
US$
See the numbers
Sources (1)
06The numbers · Consolidated · US$
How has EOG Resources done?
Revenue
$22.6BFY2025
Revenue peaked at $25,702 million in FY2022, fell each year to $22,632 million in FY2025, and reached $8,620 million in Q2 FY2026 alone.
US$
See the numbers
Net income
$5.0BFY2025
Net income fell from $7,759 million in FY2022 to $4,980 million in FY2025; it was $2,781 million in Q3 FY2026, up from $1,471 million a year earlier.
US$
See the numbers
Net income for every $100 of revenue
$22.0FY2025
EOG kept $31.4 of net income per $100 of revenue in FY2023 and $22.0 in FY2025.
Net margin: $ of net income per $100 of revenue
See the numbers
Free cash flow
$3.5BFY2025
Free cash flow fell from $6,093 million in FY2022 to $3,450 million in FY2025, before the separate cash paid for Encino. It is cash from operations minus capital spending (a Cityfort calculation from the FY2021 to FY2025 10-Ks).
US$ · cash from operations minus spending on plants and equipment
See the numbers
See all yearly numbers
EBITDA here = operating income plus depreciation and amortization (from the cash flow statement). Fiscal years are the company's own: Fiscal year ends Dec 31 (the calendar year). Net income is the share belonging to the company's owners.
Learn: Fiscal years that don't end in December: Nvidia's FY2027 explained · Stock-based compensation and dilution: pay that becomes shares
Sources (16)
- Form 10-K for FY2021
- Form 10-K for FY2022
- Form 10-K for FY2023
- Form 10-K for FY2024
- Form 10-K for FY2025
- Form 10-Q for Q1 FY2024
- Form 10-Q for Q2 FY2024
- Form 10-Q for Q3 FY2024
- Earnings release for Q4 FY2024 (Form 8-K, Exhibit 99.1)
- Form 10-Q for Q1 FY2025
- Form 10-Q for Q2 FY2025
- Form 10-Q for Q3 FY2025
- Earnings release for Q3 FY2026 (Form 8-K, Exhibit 99.1)
- Form 10-Q for Q1 FY2026
- Form 10-Q for Q2 FY2026
- Form 10-Q for Q3 FY2026
07Who runs it
Who runs EOG Resources, and did they deliver?
Ezra Y. Yacob
Chairman and Chief Executive Officer · since 2021
CEO since Oct 2021 and Chairman since Oct 2022. The 2026 proxy reports 2025 total pay of $17,576,636.
Jeffrey R. Leitzell
Executive Vice President and Chief Operating Officer · since 2023
COO since Dec 2023.
Ann D. Janssen
Executive Vice President and Chief Financial Officer · since 2024
CFO since Jan 2024.
Michael P. Donaldson
Executive Vice President and Chief Legal Officer · since 2025
In this role since Sep 2025.
What they said, and what happened
3 too early to tell
Said on Feb 24, 2026
EOG estimated total 2026 capital expenditures at about $6.3 billion to $6.7 billion (FY2025 10-K).
Too early to tellWhat happened
The company reports total capital expenditures of $4,820 million for the first nine months of 2026; the full year is not reported yet.
Said on Nov 5, 2026
EOG expected full-year 2026 total production to rise about 14% and crude oil production about 5% from 2025 (Q3 FY2026 10-Q).
Too early to tellWhat happened
Full-year 2026 output will be reported with the FY2026 results.
Said on Feb 24, 2026
EOG expected to complete about 85 net wells in the Utica play in 2026 (FY2025 10-K).
Too early to tellWhat happened
Well counts for 2026 will be reported in the FY2026 10-K.
08What could go wrong
What could go wrong for EOG Resources?
- Raw-material prices
Oil and gas prices
EOG sells at market prices it cannot control. Its Q3 FY2026 10-Q estimates that each $1.00 a barrel change in oil prices moves full-year 2026 net income by about $175 million.
Watch The average oil price EOG receives each quarter ($86.72 a barrel in Q3 FY2026).
- Debt
More debt than before Encino
Debt was $7,922 million at Sep 30, 2026, against $4,752 million at Dec 31, 2024. EOG went from more cash than debt to net debt during 2025.
Watch Net debt and debt as a share of debt plus equity (19.3% at Sep 30, 2026, as the company states).
- Execution
Wells run down
The 10-K says output from oil and gas fields declines as they are produced. Unless EOG finds or buys more, its reserves and production will fall.
Watch Proved reserves in each 10-K (5,514 million barrels of oil equivalent at Dec 31, 2025).
- Regulation
Rules on drilling and emissions
Some EOG leases are on federal land managed by the Bureau of Land Management. The 10-K says climate and emissions rules could raise its costs.
Watch Changes to federal leasing, permitting and methane rules named in the 10-K.
- Concentration
A few large buyers
Two unnamed crude oil refiners each paid more than 10% of FY2025 revenues. EOG says losing one would not have a material adverse effect.
Watch The number of buyers above 10% in the next 10-K.
- Other
Dividends can change
The 10-K says the Board may reduce dividends or stop declaring them at any time, for example if cash flow after capital spending falls short.
Watch Quarterly dividend declarations ($1.10 a share from the Jan 2027 payment).
- Other
Operations abroad
EOG produces in Trinidad and the United Arab Emirates and explores in Bahrain. The 10-K lists political, economic and other risks from operating in other countries.
Watch Output and spending in the Trinidad and Other International segments.
09Supporters vs. critics
What do supporters and critics point to?
What supporters point to
- EOG reported net income in each year from FY2021 to FY2025, and $2,781 million in Q3 FY2026, up from $1,471 million a year earlier.
- Proved reserves were 5,514 million barrels of oil equivalent at Dec 31, 2025, up 766 million in the year, according to the FY2025 10-K.
- EOG bought back $2,564 million of stock in FY2025 and $2,780 million in the first nine months of FY2026; the Board raised the quarterly dividend to $1.10 on Nov 5, 2026.
- Moody's rated EOG A3 and S&P A-, both stable, as shown in its Nov 19, 2025 pricing term sheet; its $3.0 billion credit line was undrawn at Sep 30, 2026.
What critics point to
- Revenue fell each year from $25,702 million in FY2022 to $22,632 million in FY2025, and net income from $7,759 million to $4,980 million.
- EOG does not set its prices: its Q3 FY2026 10-Q estimates each $1.00 a barrel change in oil prices moves 2026 net income by about $175 million.
- Debt rose from $4,752 million at Dec 31, 2024 to $7,922 million at Sep 30, 2026, and EOG went from more cash than debt to net debt in 2025.
- Free cash flow fell from $6,093 million in FY2022 to $3,450 million in FY2025 (Cityfort calculation from the 10-Ks: operating cash flow minus capital spending).
- Ezra Yacob holds both the Chairman and CEO roles, according to the 2026 proxy.
10What to watch next
What should you watch next at EOG Resources?
Next event
Q4 FY2026 results
Date not announced yet.
Oil prices and quarterly profit
EOG received an average of $86.72 a barrel of oil in Q3 FY2026, when net income was $2,781 million. Its 10-Q estimates each $1.00 a barrel change moves 2026 net income by about $175 million.
2026 spending against EOG's own estimate
In its FY2025 10-K (Feb 24, 2026) EOG estimated 2026 capital expenditures at about $6.3 billion to $6.7 billion. It reports $4,820 million for the first nine months.
Output growth after Encino
EOG said in its Q3 FY2026 10-Q (Nov 5, 2026) that it expects 2026 total production to rise about 14% from 2025. Output was 1,433.1 thousand barrels of oil equivalent a day in Q3 FY2026.
Debt and cash returns
EOG states its net debt at $2,175 million at Sep 30, 2026, down from $4,540 million at Dec 31, 2025. It bought back $2,780 million of stock in the first nine months of FY2026.
11Key facts
Key facts about EOG Resources
- What does EOG Resources do?
- EOG Resources drills and runs oil and gas wells, mainly in US shale areas such as the Delaware Basin, South Texas and the Utica play in Ohio. It also produces gas in Trinidad and Tobago. It does not refine oil or run fuel stations; its FY2025 10-K calls it an independent producer.
- How does EOG Resources make money?
- EOG Resources sells crude oil, natural gas liquids and natural gas at market prices. Of its $22,632 million of total revenues and other in FY2025, crude oil and condensate brought in $12,501 million. Natural gas added $2,791 million and natural gas liquids $2,376 million. Gathering, processing and marketing, mostly reselling oil and gas bought from other producers, brought in $4,914 million.
- Who are EOG Resources' customers?
- EOG Resources' FY2025 10-K names no customers. It says two unnamed crude oil refiners each paid more than 10% of FY2025 revenues, and that losing one would not have a material adverse effect. Its natural gas buyers include an LNG export plant at Corpus Christi and the National Gas Company of Trinidad and Tobago.
- How big is EOG Resources?
- EOG Resources had total revenues and other of $22,632 million and net income of $4,980 million in FY2025. It reported proved reserves of 5,514 million barrels of oil equivalent at Dec 31, 2025, and employed about 3,400 people.
- Is EOG Resources profitable?
- EOG Resources reported net income in each year from FY2021 to FY2025. Its net income was $7,759 million in FY2022 and $4,980 million in FY2025; in Q3 FY2026 it was $2,781 million, up from $1,471 million in Q3 FY2025.
- Where does EOG Resources earn its revenue?
- EOG Resources' United States segment made $22,269 million, or 98.4%, of FY2025 total revenues and other of $22,632 million. Trinidad made $359 million and Other International (Bahrain and the United Arab Emirates) $4 million.
- Who owns EOG Resources?
- EOG Resources has one class of common stock with one vote per share. Its 2026 proxy lists The Vanguard Group at 10.2%, BlackRock at 7.64% and Capital World Investors at 7.62%, each from Schedule 13GA filing by anyone who owns more than 5% of a company's shares and does not seek control. Learn more/A filings. Its directors and executive officers together owned about 0.1% at Mar 15, 2026.
- How much cash has EOG Resources returned to shareholders?
- EOG Resources declared dividends of $3.99 a share for FY2025 and bought back $2,564 million of its own stock in FY2025. In the first nine months of FY2026 it bought back $2,780 million, and on Nov 5, 2026 the Board raised the quarterly dividend from $1.02 to $1.10 a share.
- How much debt does EOG Resources have?
- EOG Resources had debt of $7,922 million at Sep 30, 2026, against $4,752 million at Dec 31, 2024; it bought Encino Acquisition Partners on Aug 1, 2025. The company states its net debt at $2,175 million at Sep 30, 2026, and its $3.0 billion credit line was undrawn.
Terms on this page
- Capital expenditures (capex)
- Debt-to-equity
- Earnings per share (EPS)
- EBITDA
- Free cash flow
- Net debt
- Net margin
- Revenue vs net income
- Stock buyback
Each explains the term in plain English, with the same number from other companies on Cityfort.
Go deeper
More detail from the same filings. Open any section.
12What it sells
12What it sells
What does EOG Resources sell?
Crude oil and condensate
Sold mainly to oil refiners, which turn it into fuels. It brought in $12,501 million in FY2025, the largest product line.
Natural gas liquids (NGLs)
Liquids separated from gas, used in plastics, heating and fuel blending. They brought in $2,376 million in FY2025.
Natural gas
Sold through pipelines in the US and to Trinidad's state gas company. It brought in $2,791 million in FY2025, up from $1,551 million in FY2024.
Gathering, processing and marketing
Mostly oil and gas bought from other producers and resold. It brought in $4,914 million in FY2025, against $4,795 million of marketing costs.
What it does
- Does: Finds, drills and pumps oil and gas from its own leases, mainly in the Delaware Basin, South Texas and the Utica play
- Does: Produces gas in Trinidad and Tobago and, since Jun 2026, crude oil in the United Arab Emirates
- Does: Moves and markets its output, including crude exports through Corpus Christi
What it does not do
- Does not: Does not refine oil into gasoline or run fuel stations: its FY2025 10-K calls it an independent (non-integrated) producer
- Does not: Does not set its own prices: they follow market benchmarks such as NYMEX oil and gas prices
Sources (1)
13How the money flows
13How the money flows · FY2025
How does money flow through EOG Resources?
Money in
- Total revenues and other (oil, gas, NGL and marketing sales)$22.6B
- Other income, net$212M
The company
EOG Resources
$22.8B came in
Money out
- Oil and gas bought from others to resell$4.8B
- Running wells and moving output (lease, well, gathering and transport costs)$3.8B
- Depreciation, depletion and amortization$4.5B
- Write-downs (impairments) and exploration$1.1B
- Overheads and interest$1.1B
- Income tax and other taxes$2.6B
- Net income$5.0B
- Buyers paid EOG $22.6 billion in FY2025; other income, net added $212 million.
- Oil and gas bought from others to resell cost $4.8 billion, and running wells and moving output cost $3.8 billion.
- Using up its oil and gas fields and wearing out equipment was charged at $4.5 billion.
- Write-downs and exploration took $1.1 billion; overheads and interest took another $1.1 billion.
- Taxes took $2.6 billion, leaving $5.0 billion as net income.
Sources (1)
14What it needs to run
14What it needs to run
What does EOG Resources need to run?
Land to drill
EOG held about 4,666 thousand net acres across its US areas in FY2025, including about 1,100,000 in the Utica play in Ohio.
New wells every year
Output from a well falls as it is pumped, so EOG keeps drilling. It completed 641 net wells in 2025 and expected about 585 in 2026, according to its FY2025 10-K.
Sand, water and drilling services
Fracking a well uses large amounts of sand and water. EOG runs its own sand supply program; its 10-K lists water access as a risk.
Pipelines and export routes
Output moves by pipeline to the Gulf Coast, Cushing, the Permian, the Northeast and the Midwest; crude is exported through Corpus Christi.
Capital and people
Capital spending was $6,594 million in FY2025. EOG employed about 3,400 people at Dec 31, 2025.
Sources (2)
15Competitors and what protects it
15Competitors and what protects it
Who does EOG Resources compete with?
ConocoPhillips
NYSE: COP
In the 2025 compensation peer group in EOG's 2026 proxy, which the proxy says is picked for similar market values and lines of business.
Occidental Petroleum
NYSE: OXY
Also in EOG's 2025 compensation peer group, as listed in its 2026 proxy.
Devon Energy
NYSE: DVN
Also in EOG's 2025 compensation peer group, as listed in its 2026 proxy.
Diamondback Energy
NASDAQ: FANG
Also in EOG's 2025 compensation peer group, as listed in its 2026 proxy.
What protects the business
Each strength is scored 1 (weak) to 5 (strong) for the business, with the reason. It is not a rating of the share.
- Size of reserves4 of 5
EOG reported 5,514 million barrels of oil equivalent of proved reserves at Dec 31, 2025, up 766 million in the year. It produced 449.8 million in FY2025.
- Drilling cost programs3 of 5
EOG says its drilling motor program cut drilling times, longer horizontal wells lowered cost per foot drilled, and self-sourced sand gave supply certainty.
- Several basins to choose from3 of 5
In 2025 EOG completed wells in five US areas, from the Delaware Basin to the Utica play, with about 4,666 thousand net acres in all.
- Borrowing strength3 of 5
A Nov 19, 2025 note offering document shows ratings of A3 from Moody's and A- from S&P, both stable. The company states debt at 19.3% of debt plus equity at Sep 30, 2026.
Weak spot
No control over prices
EOG's average crude oil price fell from $77.40 a barrel in FY2024 to $65.63 in FY2025, and net income fell from $6,403 million to $4,980 million.
16Where growth could come from
16Where growth could come from
Where could EOG Resources' growth come from?
In its Q3 FY2026 10-Q, EOG said it estimates 2026 capital expenditures at about $6.3 billion to $6.7 billion. It expects 2026 crude oil production to rise about 5% and total production about 14% from 2025.
Utica gas and oil from Encino
Working1,433.1 thousand barrels of oil equivalent a day in Q3 FY2026, vs 1,134.1 in Q2 FY2025
EOG bought Encino Acquisition Partners, with 675,000 core net acres in the Utica play, on Aug 1, 2025. Total daily output rose after the deal closed.
Status: Working, on track against what the company said.
Gas sold at global prices
Early180,000 MMBtu a day for 10 years from 2027
A Feb 2024 agreement sells US gas from 2027, mostly at prices linked to Brent crude. EOG also sells gas to an LNG plant at Corpus Christi.
Status: Early, too early to judge.
New fields abroad
NewUAE crude production began Jun 2026
EOG won a 100% interest in an onshore block in Abu Dhabi in May 2025 and signed a gas exploration agreement in Bahrain in Feb 2025. In Trinidad it began a new multiyear drilling program in 2026.
Status: New, recently announced.
Status compares progress with what the company itself said it would do: Working = on track against what the company said; Mixed = partly on track; Behind = behind the company's own plan; New = recently announced; Early = too early to judge.
17The company's own measures (non-GAAP)
17The company's own measures · FY2025 to Q3 FY2026
What do EOG Resources' own measures show?
Official (GAAP): Net cash from operating activities, FY2025
$10.0B
Company's own measure: Free cash flow (company definition), FY2025
$4.7B
EOG starts from operating cash before working-capital changes ($10,957 million) and subtracts its own total capital expenditures ($6,294 million). The GAAP-based figure on this page, $3,450 million, subtracts capex from the cash flow statement.
Official (GAAP): Net cash from operating activities, first nine months of FY2026
$11.4B
Company's own measure: Free cash flow (company definition), first nine months of FY2026
$6.5B
Same definition: adjusted operating cash of $11,288 million less total capital expenditures of $4,820 million.
Official (GAAP): Additions to oil and gas properties and other property, FY2025
$6.6B
Company's own measure: Total capital expenditures (company definition), FY2025
$6.3B
The company's figure leaves out items such as property acquisitions and asset retirement costs.
These are the company's own measures, defined by the company. They are not comparable across companies, and they are not added together. Each sits beside the nearest official (GAAP) figure.
Learn: Non-GAAP measures: what a company's "adjusted" numbers leave out
18Financial strength and debt
18Financial strength · Sep 30, 2026
How much debt does EOG Resources have?
- Total debt$7.9B
- Cash and investments$5.7B
- Net debt (debt minus cash)$2.2B
- Net worth (shareholders' money)$33.1B
- Debt to equity
- 0.24×
- $ of debt for every $1 of shareholders' money
- Net debt is stated by the company in its Q3 FY2026 earnings release: $2,175 million at Sep 30, 2026 and $4,540 million at Dec 31, 2025. Debt to equity (0.24) is a Cityfort calculation from the Q3 FY2026 earnings release.
- Debt rose from $4,752 million at Dec 31, 2024 to $7,936 million at Dec 31, 2025. In 2025 EOG issued $3.5 billion of notes in July and $1.0 billion in November, and bought Encino in August.
- The company states debt at 19.3% of debt plus equity at Sep 30, 2026, and 21.0% at Dec 31, 2025. Its revolving credit line allows at most 65%.
- A $3.0 billion revolving credit line running to Dec 3, 2030 was undrawn at Sep 30, 2026. At Dec 31, 2025 no notes were due in 2026 or 2027, and $640 million fell due in 2028.
19Who owns it
19Who owns it · ownership as of Mar 15, 2026
Who owns EOG Resources?
- Officers and directors (as a group), shares
- 0.1%
Share classes
Holders of 5% or more
From the company's proxy statement (DEF 14A), later Schedule 13G filings and the share counts on its latest annual or quarterly report. Each holder row shows the date of its own filing.
Learn: How to read a proxy statement (DEF 14A): Nvidia's 2026 proxy · Form 4 insider filings: who files, the codes and the footnotes
20What it does with profit
20What it does with profit
What does EOG Resources do with its profit?
Dividend per share
$3.99FY2025
Dividend paid for each share, by financial year.
$ per share
See the numbers
Buyback · Dec 31, 2021
Treasury stock purchased in FY2021
$41M
Buyback · Dec 31, 2022
Treasury stock purchased in FY2022
$118M
Buyback · Dec 31, 2023
Treasury stock purchased in FY2023
$1.0B
Buyback · Dec 31, 2024
Treasury stock purchased in FY2024
$3.2B
Buyback · Dec 31, 2025
Treasury stock purchased in FY2025
$2.6B
Buyback · Sep 30, 2026
Treasury stock purchased in the first nine months of FY2026
$2.8B
21Governance signals
21Governance signals
What do EOG Resources' governance filings show?
- Auditor
- Deloitte & Touche LLP
- Auditor changes
- None in the period covered
- Audit qualifications
- None reported
- Related-party dealings
- The 2026 proxy names JPMorgan Chase, which reported owning about 5% of EOG in Jul 2025, as a related party. JPMorgan was agent and lender on EOG's credit lines and an underwriter of its 2025 notes, and received about $4.0 million of fees in 2025. EOG also paid it a net $10.1 million on commodity hedges.
- Credit rating
- Moody's and S&P (as shown in EOG's Nov 19, 2025 free writing prospectus) A3 (Moody's) / A- (S&P) (outlook Stable at both), Nov 19, 2025
A credit rating describes the company's ability to repay debt. It is not a rating of the share.
Flags to know about
other
Chair and CEO roles combined
Ezra Yacob is both Chairman and CEO. Independent director Robert P. Daniels presides over the non-employee directors' sessions in 2025 and 2026; eight of nine directors are independent.
22How it got here
22How it got here
How did EOG Resources get here?
1985
Milestone
Organized in Delaware
The company was organized as a Delaware corporation in 1985.
2021
Milestone
New CEO and a $5 billion buyback plan
Ezra Yacob became CEO in Oct 2021, and the Board authorized $5 billion of buybacks in Nov 2021.
2023
Milestone
Cash return commitment
In Nov 2023 EOG committed to return at least 70% of a yearly cash measure to shareholders from FY2024.
2024
Milestone
Long-term gas sale linked to Brent
A Feb 2024 agreement sells 180,000 MMBtu of US gas a day for 10 years from 2027.
2025
Business-model change
Encino deal in the Utica
On Aug 1, 2025 EOG bought Encino Acquisition Partners for $5.7 billion including its net debt, adding 675,000 core net acres in the Utica play in Ohio.
2026
Milestone
Bigger buyback and dividend
The buyback authorization rose to $20 billion on May 20, 2026, and the quarterly dividend to $1.10 on Nov 5, 2026.
Sources (2)
23Sources and changes
Where every number on this page comes from
Sources (18 documents)
- S1Form 10-Q for Q3 FY2026 · SEC EDGAR · Tier 1: company or exchange filing · Nov 5, 2026
- S2Form 10-Q for Q2 FY2026 · SEC EDGAR · Tier 1: company or exchange filing · Aug 4, 2026
- S3Form 10-Q for Q1 FY2026 · SEC EDGAR · Tier 1: company or exchange filing · May 5, 2026
- S4Form 10-K for FY2025 · SEC EDGAR · Tier 1: company or exchange filing · Feb 24, 2026
- S5Form 10-Q for Q3 FY2025 · SEC EDGAR · Tier 1: company or exchange filing · Nov 6, 2025
- S6Form 10-Q for Q2 FY2025 · SEC EDGAR · Tier 1: company or exchange filing · Aug 7, 2025
- S7Form 10-Q for Q1 FY2025 · SEC EDGAR · Tier 1: company or exchange filing · May 1, 2025
- S8Form 10-K for FY2024 · SEC EDGAR · Tier 1: company or exchange filing · Feb 27, 2025
- S9Form 10-Q for Q3 FY2024 · SEC EDGAR · Tier 1: company or exchange filing · Nov 7, 2024
- S10Form 10-Q for Q2 FY2024 · SEC EDGAR · Tier 1: company or exchange filing · Aug 1, 2024
- S11Form 10-Q for Q1 FY2024 · SEC EDGAR · Tier 1: company or exchange filing · May 2, 2024
- S12Form 10-K for FY2023 · SEC EDGAR · Tier 1: company or exchange filing · Feb 22, 2024
- S13Form 10-K for FY2022 · SEC EDGAR · Tier 1: company or exchange filing · Feb 23, 2023
- S14Form 10-K for FY2021 · SEC EDGAR · Tier 1: company or exchange filing · Feb 24, 2022
- S15Earnings release for Q3 FY2026 (Form 8-K, Exhibit 99.1) · EOG Resources / SEC EDGAR · Tier 1: company or exchange filing · Nov 5, 2026
- S17Earnings release for Q4 FY2024 (Form 8-K, Exhibit 99.1) · EOG Resources / SEC EDGAR · Tier 1: company or exchange filing · Feb 27, 2025
- S182026 proxy statement (DEF 14A) · EOG Resources / SEC EDGAR · Tier 1: company or exchange filing · Mar 27, 2026
- S19Free writing prospectus (pricing term sheet for senior notes), Nov 19, 2025 · EOG Resources / SEC EDGAR · Tier 1: company or exchange filing · Nov 19, 2025
Changes to this page (v1 · Nov 20, 2026)
- v1 · Nov 20, 2026First version. (first version)
Numbers come only from tier 1 and tier 2 sources. Read how we research.
Disclaimer
For learning only. Cityfort is not a registered investment adviser or broker-dealer and does not recommend buying or selling any security. Prices shown are dated and may be out of date.
Investing in securities involves risk, including loss of capital. Before making any investment decision, do your own research and consider consulting a registered investment adviser or other qualified professional.
Cityfort, its owners and contributors may or may not hold securities of companies covered. Cityfort is not paid by any company it covers. Content is not an offer or solicitation to buy or sell any security, including in any initial public offering.
Read the positions policyRead the full disclaimerHide the full disclaimer
Cityfort publishes general educational content that explains how listed companies work. Cityfort is not registered with the US Securities and Exchange Commission or any state securities regulator as an investment adviser, and is not a broker-dealer or a member of FINRA. Cityfort does not provide investment, tax or legal advice, recommendations, ratings, price targets or any opinion on whether to buy, sell or hold any security. Nothing on the site is tailored to any person's circumstances.
All information is taken from publicly available sources, mainly company filings with the SEC, which are listed on each page with dates. We work to keep it accurate and correct errors publicly, but we do not guarantee that it is complete, accurate or up to date. Any market price or price-based ratio shown is dated, may be out of date by the time you read it, and is included only to explain concepts.
Statements by company management, including forward-looking statements and guidance, are reported as the company's statements, with their date and source; they are not our forecasts. Adjusted (non-GAAP) figures are the company's own measures and are shown next to the official (GAAP) figures.