Energy · NYSE: KMI
Kinder Morgan: how the business works
Kinder Morgan has an interest in or operates about 78,000 miles of pipelines in North America that carry natural gas and fuels for other companies, with revenue of $16.9 billion in FY2025.
By Hardik Bhandare · Checked against filings: . Editorial policy. Corrections
Follow Kinder Morgan
Email me when Kinder Morgan's page is updated after earnings.
We'll send a confirmation email first. See our privacy policy.
Kinder Morgan, Inc. · Houston, Texas
Updated for Q3 FY2026 · checked
- Revenue, FY2025
- $16.9B
- Net income attributable to Kinder Morgan, FY2025
- $3.1B
- Pipelines owned or operated, Dec 31, 2025
- About 78,000 miles
- Full-time employees, Dec 31, 2025
- 11,028
- Held by directors and officers, Mar 16, 2026
- 12.72%
The short version
Kinder Morgan in 5 points
1 · What it sells
Kinder Morgan moves and stores natural gas, fuels, crude oil and CO2 through about 78,000 miles of pipelines and 136 terminals, with revenue of $16.9 billion in FY2025.
2 · Who pays it
In FY2025, shippers reserving space paid 31.5% of Kinder Morgan revenue, gas buyers 23.3%, product buyers 18.1%, fee-based users 16.1%, lessees 8.6% and other items 2.4%; no customer reached a tenth.
3 · What it keeps from $100
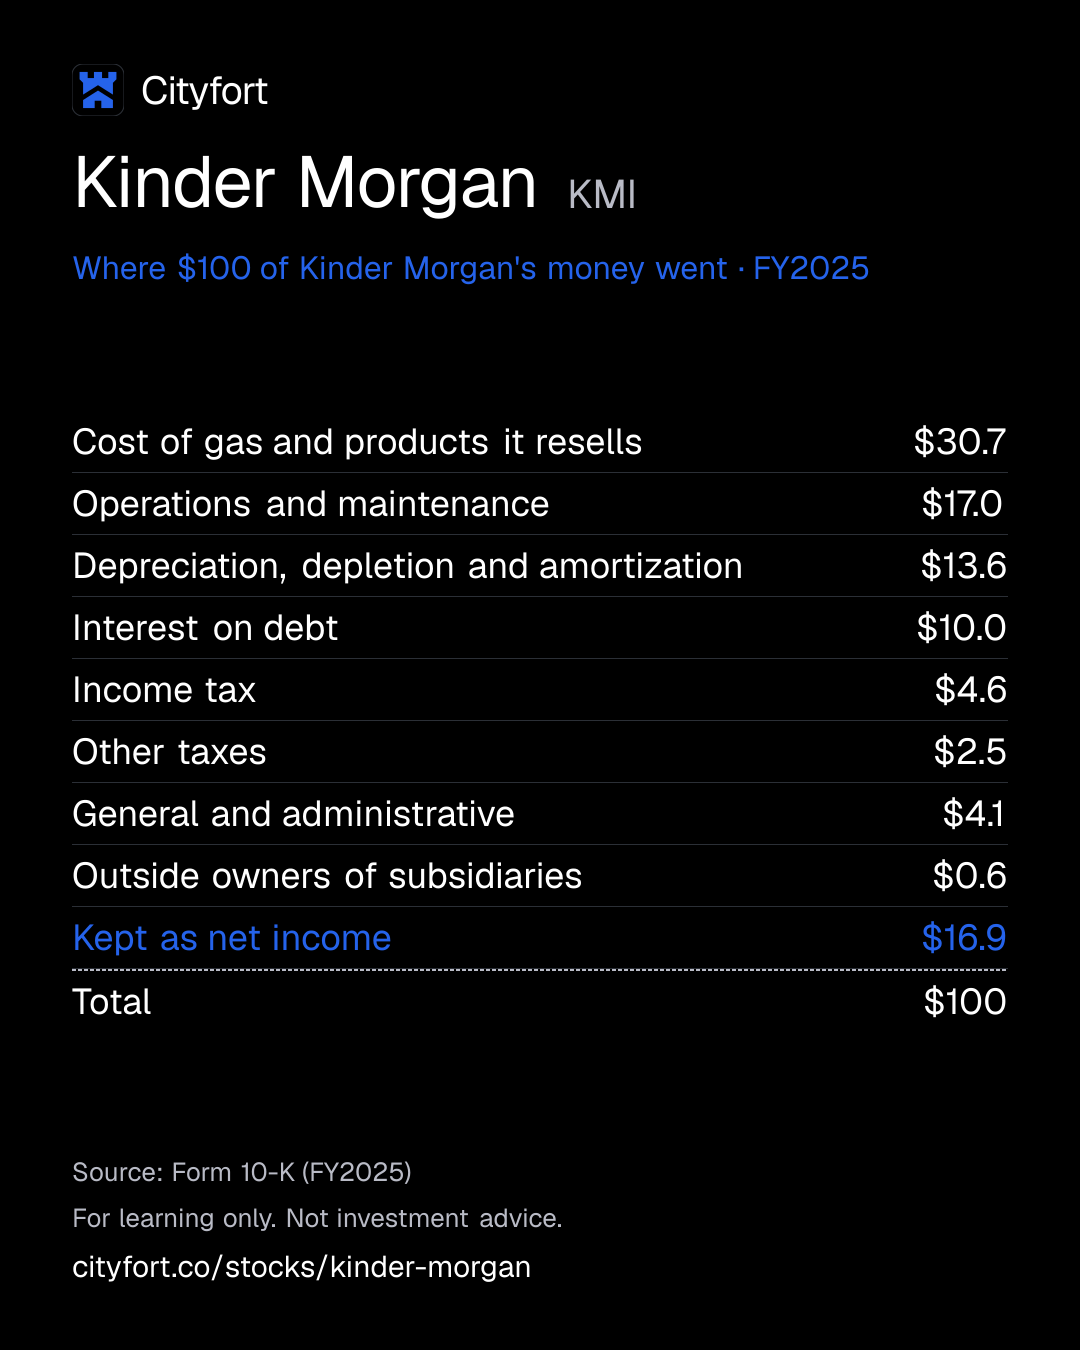
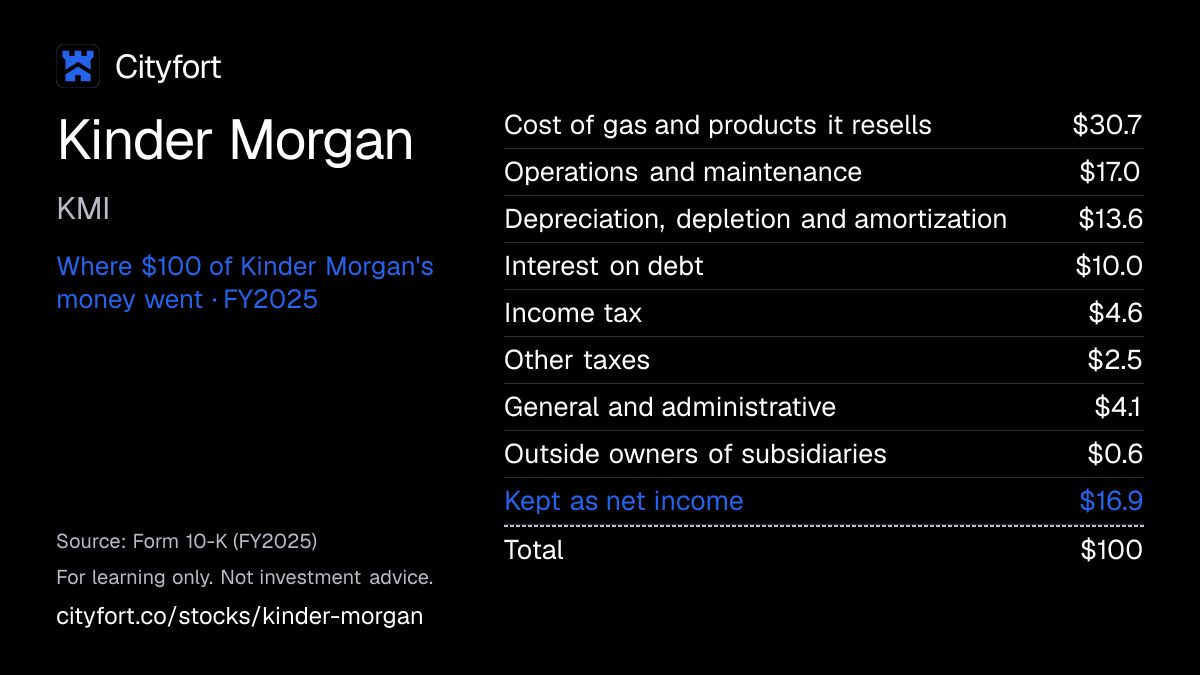
Of every $100 that came in during FY2025, Kinder Morgan kept $16.9 as net income, which includes earnings from partly owned companies and a gain on selling its EagleHawk stake; operating income was $4,724 million.
4 · Where the operating profit comes from
Natural Gas Pipelines made $6,080 million of Kinder Morgan's FY2025 segment EBDA on 64.9% of revenue, against $1,157 million for Products Pipelines, $1,143 million for Terminals and $612 million for CO2.
5 · The one thing to watch
Kinder Morgan's project backlog was $14.4 billion at Sep 30, 2026, up from $10.0 billion at the end of 2025, while its debt was $32.0 billion at Dec 31, 2025.
Sources: From Kinder Morgan's FY2025 10-K and Q3 FY2026 earnings release · checked
01Where the money goes · FY2025
Where does $100 of Kinder Morgan's money go?
Kinder Morgan · FY2025
Receipt for every $100
| Cost of gas and products it resells | $30.7 |
|---|---|
| Operations and maintenance | $17.0 |
| Depreciation, depletion and amortization | $13.6 |
| Interest on debt | $10.0 |
| Income tax | $4.6 |
| Other taxes | $2.5 |
| General and administrative | $4.1 |
| Outside owners of subsidiaries | $0.6 |
| Kept as net income | $16.9 |
| Total | $100 |
Each line = amount ÷ total money in × 100. Lines may not add to exactly $100 because of rounding.
How this is worked out
Cityfort calculation from the FY2025 10-K. Of every $100 that came in during FY2025: each line ÷ total money in of $18,021 million (revenues of $16,937 million plus $1,084 million of equity-investment earnings and other income). Net income on revenue alone was $18.0 per $100.
Save this receipt as an image
Embed this receipt or the key numbers
Paste this code into a blog or website to show the card you choose, with a link back to this page.
Each week: the next company due to report earnings, explained in 5 points.
No tips. Unsubscribe anytime.
We'll send a confirmation email. See our privacy policy.
02The business in one line
What does Kinder Morgan do?
Gas shippers, fuel companies and gas buyers pay Kinder Morgan to move, store or sell them energy. Its biggest cost is the gas and products it buys to resell, and $3.1 billion was left as net income in FY2025.
- Shippers that reserve pipeline or storage space paid $5,342 million in FY2025, the largest group of payers in the FY2025 10-K revenue note.
- Buying gas and products to resell took $5.5 billion of FY2025 revenue of $16.9 billion, and running the network took $3.1 billion.
03Who pays it
Who pays Kinder Morgan?
Shippers that reserve capacity (firm services)
31.5%
of revenue
Pay a set fee to reserve room on a pipeline or in storage. $5,342 million in FY2025.
Buyers of natural gas
23.3%
of revenue
Buy natural gas that Kinder Morgan sells. $3,949 million in FY2025.
Buyers of oil, fuels and other products
18.1%
of revenue
Buy products that Kinder Morgan sells, including oil from its CO2 fields. $3,063 million in FY2025.
Users of fee-based services
16.1%
of revenue
Pay for volumes moved, stored or handled. $2,719 million in FY2025.
Lessees of tanks and other assets
8.6%
of revenue
Pay lease income to Kinder Morgan. $1,464 million in FY2025.
- Shippers that reserve capacity (firm services)31.5%
- Buyers of natural gas23.3%
- Buyers of oil, fuels and other products18.1%
- Users of fee-based services16.1%
- Lessees of tanks and other assets8.6%
How spread out the customers are
No single outside customer made up 10% or more of revenue in 2023, 2024 or 2025, according to the FY2025 10-K. Shares above are a Cityfort calculation from the FY2025 10-K revenue note; the remaining 2.4% is other sales, derivative adjustments and other revenue.
Sources (1)
04How it makes money
How does Kinder Morgan make money?
Long contracts for pipeline space, with a commodity side that moves revenue
Executive Chairman Richard Kinder said in the Q3 FY2026 release that the business rests on long-term, fee-based contracts. Revenue still swings with commodity sales: $19.2 billion in FY2022, $15.3 billion in FY2023. Net income moved less, from $2.5 billion to $2.4 billion.
Net income kept per $100 of revenue
$10.7$18.0
FY2021 to FY2025
- Shippers sign long contracts to reserve pipeline space
- Firm customers pay for that space even if unused
- Cash pays interest, dividends and new projects
- New pipelines open for gas demand from LNG and power plants
- More reserved space adds more fees
↺ Step 5 feeds back into step 1.
05Business segments · FY2025
Which businesses make up Kinder Morgan?
Natural Gas Pipelines
64.9%Gas pipelines, storage, gathering and LNG services. Segment EBDA (earnings before depreciation and amortization) was $6,080 million in FY2025.
Revenue $11.0B ($10,990M)
Products Pipelines
15.9%Pipelines for gasoline, diesel, jet fuel and crude oil. Segment EBDA was $1,157 million.
Revenue $2.7B ($2,686M)
Terminals
12.4%Liquids and bulk terminals and Jones Act tankers. Segment EBDA was $1,143 million.
Revenue $2.1B ($2,094M)
CO2
6.9%CO2 supply, oil fields and renewable natural gas. Segment EBDA was $612 million.
Revenue $1.2B ($1,167M)
How the mix changed
- Natural Gas Pipelines
- Products Pipelines
- Terminals
- CO2
Revenue by segment, FY2023 to FY2025.
US$
See the numbers
Sources (1)
06The numbers · Consolidated · US$
How has Kinder Morgan done?
Revenue
$16.9BFY2025
Revenue was $16.9 billion in FY2025, up from $15.1 billion in FY2024 but below $19.2 billion in FY2022.
US$
See the numbers
Net income
$3.1BFY2025
Net income attributable to Kinder Morgan rose from $1.8 billion in FY2021 to $3.1 billion in FY2025.
US$
See the numbers
Net income for every $100 of revenue
$18.0FY2025
Kinder Morgan kept $18.0 of net income per $100 of revenue in FY2025, up from $10.7 in FY2021.
Net margin: $ of net income per $100 of revenue
See the numbers
Free cash flow
$2.9BFY2025
Operating cash flow was $5.9 billion in FY2025; capital spending of $3.0 billion left $2.9 billion of free cash flow.
US$ · cash from operations minus spending on plants and equipment
See the numbers
See all yearly numbers
EBITDA here = operating income plus depreciation and amortization (from the cash flow statement). Fiscal years are the company's own: Fiscal year ends Dec 31. Net income is the share belonging to the company's owners.
Learn: Fiscal years that don't end in December: Nvidia's FY2027 explained
Sources (16)
- Form 10-K for FY2021
- Form 10-K for FY2022
- Form 10-K for FY2023
- Form 10-K for FY2024
- Form 10-K for FY2025
- Form 10-Q for Q1 FY2024
- Form 10-Q for Q2 FY2024
- Form 10-Q for Q3 FY2024
- Q4 FY2024 earnings release (8-K Ex. 99.1)
- Form 10-Q for Q1 FY2025
- Form 10-Q for Q2 FY2025
- Form 10-Q for Q3 FY2025
- Q4 FY2025 earnings release (8-K Ex. 99.1)
- Form 10-Q for Q1 FY2026
- Form 10-Q for Q2 FY2026
- Form 10-Q for Q3 FY2026
07Who runs it
Who runs Kinder Morgan, and did they deliver?
Richard D. Kinder
Executive Chairman · since 2015
Chairman and CEO from 1999 until he became Executive Chairman in 2015; holds 11.60% of the shares.
Kimberly A. Dang
Chief Executive Officer · since 2023
CEO since Aug 1, 2023; earlier President, and CFO from 2005 to 2018.
Dax A. Sanders
President · since 2026
President since Jan 31, 2026.
David P. Michels
Chief Financial Officer · since 2018
CFO since April 2018.
What they said, and what happened
1 delivered · 1 too early to tell
Said on Jan 22, 2025
2025 budget: net income attributable to Kinder Morgan of $2.8 billion, Adjusted EBITDAOperating profit before wear-and-tear charges (depreciation and amortization). As a margin: per $100 of sales. of $8.3 billion and dividends of $1.17 per share.
DeliveredWhat happened
FY2025 net income was $3,056 million, Adjusted EBITDA $8,391 million and dividends declared $1.17 per share.
Said on Jan 21, 2026
2026 budget: Adjusted EBITDA of $8.6 billion, Adjusted EPS of $1.36, dividends of $1.19 per share and year-end Net Debt of 3.8 times Adjusted EBITDA.
Too early to tellWhat happened
On Oct 21, 2026 the company said it expects to beat the budget by more than 6% on Adjusted EBITDA and end the year at 3.6 times.
08What could go wrong
What could go wrong for Kinder Morgan?
- Legal
Lawsuit over gas during Winter Storm Uri
Freeport LNG Marketing alleges two Kinder Morgan units broke a gas contract in February 2021. It alleges it is owed about $104 million plus fees and interest; Kinder Morgan denies it. An appeals court sent the case back to the trial court on Apr 15, 2025.
Watch Trial court rulings in the Freeport case.
- Legal
Pension plan ruling under appeal
In a class action under ERISA (the US pension law), the court ordered the plans reformed in line with the relief the plaintiffs sought. Kinder Morgan says it disagrees and has appealed to the 5th Circuit.
Watch The appeal and any rise in pension plan liabilities.
- Debt
Large debt
Debt was $32.0 billion at Dec 31, 2025, and net interest cost $1,801 million in FY2025. The 10-K lists the size of its debt and its exposure to interest rates as risks.
Watch Net Debt to Adjusted EBITDA, 3.5 times at Sep 30, 2026.
- Raw-material prices
Oil and gas prices
The 10-K says volatile oil, NGL and natural gas prices could hurt the business. Commodity sales were $7,255 million of FY2025 revenue.
Watch CO2 segment earnings and realized oil prices in the quarterly releases.
- Regulation
Rate rules and pipeline safety
The FERC has authority over interstate gas pipeline rates. The 10-K says stricter pipeline safety rules may require significant spending.
Watch FERC rate decisions and new safety rules.
- Demand
Competition and climate rules
The 10-K lists competition from other pipelines, terminals and transport. It also says climate rules could reduce demand for its products and services.
Watch Volumes on its gas and products pipelines.
09Supporters vs. critics
What do supporters and critics point to?
What supporters point to
- No single outside customer made up 10% or more of Kinder Morgan's revenue in 2023, 2024 or 2025, per the FY2025 10-K.
- Net income kept per $100 of revenue rose from $10.7 in FY2021 to $18.0 in FY2025.
- Dividends declared per share rose each year, from $1.08 in FY2021 to $1.17 in FY2025.
- The company reported its project backlog at $14.4 billion at Sep 30, 2026, up from $10.0 billion at the end of 2025.
- FY2025 net income of $3,056 million and Adjusted EBITDA of $8,391 million were above the 2025 budget the company set on Jan 22, 2025.
What critics point to
- Debt was $32.0 billion at Dec 31, 2025, equal to about 5.4 years of FY2025 operating cash flow (Cityfort calculation from the FY2025 10-K).
- Net interest cost was $1,801 million in FY2025, against operating income of $4,724 million.
- Revenue swings with commodity sales: it was $19.2 billion in FY2022 and $15.3 billion in FY2023.
- Capital spending rose from $1,281 million in FY2021 to $3,026 million in FY2025.
- Freeport LNG Marketing alleges two Kinder Morgan units broke a gas contract in February 2021 and claims about $104 million; Kinder Morgan denies it.
10What to watch next
What should you watch next at Kinder Morgan?
Next event
Q4 FY2026 results (expected, based on the Jan 21, 2026 release date for Q4 FY2025)
Jan 20, 2027
Expected, based on last year's date
Backlog turning into pipelines
The backlog was $14.4 billion at Sep 30, 2026, and capital spending was $2,831 million in the first nine months of 2026. Watch how much is completed and what it costs.
Debt against earnings
The company put Net Debt at 3.5 times Adjusted EBITDA at Sep 30, 2026. On Oct 21, 2026 it said it expects to end 2026 at 3.6 times.
Court cases
Trial court rulings in the Freeport LNG contract case, remanded on Apr 15, 2025, and the 5th Circuit appeal in the ERISA pension case.
Commodity prices and the CO2 business
Commodity sales were $7,255 million of FY2025 revenue. CO2 segment EBDA was $612 million in FY2025.
11Key facts
Key facts about Kinder Morgan
- What does Kinder Morgan do?
- Kinder Morgan, Inc. has an interest in or operates about 78,000 miles of pipelines and 136 terminals in North America, at Dec 31, 2025. They carry and store natural gas, refined fuels, crude oil, chemicals and CO2 for other companies.
- How does Kinder Morgan make money?
- Kinder Morgan charges fees to move and store energy, and also buys and resells natural gas and products. In FY2025, services brought in $9.5 billion and commodity sales $7.3 billion of its $16.9 billion revenue.
- Who are Kinder Morgan's customers?
- Kinder Morgan had no single outside customer with 10% or more of revenue in 2023, 2024 or 2025, per its FY2025 10-K. Shippers reserving pipeline or storage space paid $5,342 million in FY2025, and gas buyers $3,949 million.
- Which Kinder Morgan segment is the biggest?
- Natural Gas Pipelines is Kinder Morgan's biggest segment, with $10,990 million of FY2025 revenue (64.9%) and $6,080 million of segment EBDA. Products Pipelines, Terminals and CO2 brought in the rest.
- How big is Kinder Morgan?
- Kinder Morgan's revenue was $16,937 million in FY2025, up from $15,100 million in FY2024. Net income attributable to Kinder Morgan was $3,056 million in FY2025, up from $2,613 million.
- Is Kinder Morgan profitable?
- Yes. Kinder Morgan's net income attributable to the company was $3,056 million in FY2025 and $764 million in Q3 FY2026. Net income was $18.0 per $100 of revenue in FY2025, against $10.7 in FY2021.
- How much debt does Kinder Morgan have?
- Kinder Morgan's total debt was $32,003 million at Dec 31, 2025, and net interest cost was $1,801 million in FY2025. Operating cash flow was $5,917 million in FY2025.
- Does Kinder Morgan pay a dividend?
- Kinder Morgan's dividends declared per share rose each year from $1.08 in FY2021 to $1.17 in FY2025. It paid $2,604 million of dividends in FY2025.
- Who owns Kinder Morgan?
- Kinder Morgan's directors and officers held 12.72% of its shares on Mar 16, 2026, most of it Executive Chairman Richard D. Kinder's 11.6%, per the 2026 proxy. The Vanguard Group held 9.05%, BlackRock 6.88% and State Street 5.72%.
Terms on this page
- Capital expenditures (capex)
- Debt-to-equity
- Earnings per share (EPS)
- EBITDA
- Free cash flow
- Interest coverage
- Net debt
- Net margin
- Revenue vs net income
- Stock buyback
Each explains the term in plain English, with the same number from other companies on Cityfort.
Go deeper
More detail from the same filings. Open any section.
12What it sells
12What it sells
What does Kinder Morgan sell?
Natural gas pipelines and storage
Carries natural gas between states and within Texas, stores it underground, and gathers and treats it near wells. About 42,000 miles of these pipelines are wholly owned.
Products pipelines
Moves refined fuels such as gasoline, diesel and jet fuel, plus crude oil and condensate, through pipelines and terminals.
Terminals
Stores and handles liquids such as fuels and chemicals and bulk goods such as petroleum coke and metals. It also runs 16 Jones Act tankers, ships that carry cargo between US ports.
CO2
Supplies carbon dioxide that is pumped into old oil fields to push out more oil, and sells that oil. It also makes renewable natural gas.
Think of it like this
Like a toll road for energy: shippers pay to reserve space on the pipe.
What it does
- Does: Charges fees to move and store natural gas, fuels and chemicals
- Does: Buys and resells some natural gas and products, counted as commodity sales of $7.3 billion in FY2025
- Does: Produces oil in its CO2 business; SACROC is its largest field
What it does not do
- Does not: Does not depend on one buyer: no customer reached 10% of revenue in 2023, 2024 or 2025
- Does not: Does not earn all its revenue from fees: services were $9.5 billion of the $16.9 billion in FY2025
Sources (1)
13How the money flows
13How the money flows · FY2025
How does money flow through Kinder Morgan?
Money in
- Total revenues$16.9B
- Earnings from partly owned companies and other income$1.1B
The company
Kinder Morgan
$18.0B came in
Money out
- Cost of gas and products it resells$5.5B
- Operations and maintenance$3.1B
- Depreciation, depletion and amortization$2.5B
- Interest on debt (net)$1.8B
- Income tax and other taxes$1.3B
- Overheads and outside owners of subsidiaries$848M
- Net income attributable to Kinder Morgan$3.1B
- Customers paid Kinder Morgan $16.9 billion in FY2025; partly owned pipelines and other items added $1.1 billion.
- Buying the gas and products it resells took $5.5 billion, the largest cost.
- Running and repairing pipelines and terminals took $3.1 billion, and wear on assets $2.5 billion.
- Interest on its debt took $1.8 billion, and taxes $1.3 billion.
- Overheads and outside owners of subsidiaries took $848 million, leaving $3.1 billion of net income.
Sources (1)
14What it needs to run
14What it needs to run
What does Kinder Morgan need to run?
A pipeline and storage network
About 78,000 miles of pipelines, 136 terminals and about 706 billion cubic feet of working gas storage at Dec 31, 2025.
Regulator oversight of rates
The FERC (Federal Energy Regulatory Commission) has authority over the rates and terms of interstate gas pipelines and storage.
Capital for new projects
Capital spending was $3,026 million in FY2025, up from $1,281 million in FY2021.
People
11,028 full-time staff at Dec 31, 2025, about 867 of them covered by union agreements.
Sources (2)
15Where growth could come from
15Where growth could come from
Where could Kinder Morgan's growth come from?
In its Jan 21, 2026 budget, Kinder Morgan set 2026 Adjusted EBITDA at $8.6 billion and Adjusted EPS at $1.36. On Oct 21, 2026 the company said it expects to beat that budget by more than 6% on Adjusted EBITDA and more than 13% on Adjusted EPS.
Natural gas project backlog
Working$13.2 billion of $14.4 billion backlog, Q3 FY2026
The company reported its expansion project backlog at $14.4 billion at Sep 30, 2026, up from $10.0 billion at the end of 2025.
Status: Working, on track against what the company said.
Gas for power plants and local utilities
EarlyOver 75% of the backlog
CEO Kim Dang said in the Q3 FY2026 release that more than 75% of the backlog supports power generation and local gas distribution demand.
Status: Early, too early to judge.
Two new large gas pipelines
NewEach over 2.5 Bcf/d
The Southeast Connector and Permian Link projects joined the backlog in Q3 FY2026. Permian Link costs about $4.2 billion; Kinder Morgan's share is about $1.6 billion.
Status: New, recently announced.
Western Gateway fuel pipeline
NewAbout 230,000 barrels a day
A planned pipeline of about 1,300 miles with Phillips 66 and HF Sinclair, carrying fuels to Arizona and California. The final investment decision came in August 2026.
Status: New, recently announced.
Bolt-on purchases
Working$648 million and $503 million
Bought Outrigger Energy II in North Dakota in Feb 2025 and the Monument Pipeline near Houston in May 2026.
Status: Working, on track against what the company said.
Status compares progress with what the company itself said it would do: Working = on track against what the company said; Mixed = partly on track; Behind = behind the company's own plan; New = recently announced; Early = too early to judge.
16The company's own measures (non-GAAP)
16The company's own measures · FY2025 to Q3 FY2026
What do Kinder Morgan's own measures show?
Official (GAAP): Net income attributable to Kinder Morgan, FY2025
$3.1B
Company's own measure: Adjusted EBITDA, FY2025
$8.4B
Adds back interest, taxes, depreciation and amortization, and leaves out "Certain Items" such as asset-sale gains.
Official (GAAP): Net income attributable to Kinder Morgan, Q3 FY2026
$764M
Company's own measure: Adjusted EBITDA, Q3 FY2026
$2.2B
Same definition. Q3 FY2026 Certain Items included a $138 million non-cash legal and environmental accrual and a $71 million gain on selling Tampa terminals.
Official (GAAP): Diluted earnings per share, Q3 FY2026
$0.34
Company's own measure: Adjusted EPS, Q3 FY2026
$0.35
Adjusted net income, which leaves out Certain Items, per share.
Official (GAAP): Total debt, Dec 31, 2025
$32.0B
Company's own measure: Net Debt, Dec 31, 2025
$31.7B
The company subtracts cash, debt fair value adjustments and a currency item. It put Net Debt at 3.8 times Adjusted EBITDA for FY2025 and 3.5 times at Sep 30, 2026.
Official (GAAP): Capital expenditures, first nine months of 2026
$2.8B
Company's own measure: Expansion project backlog, Sep 30, 2026
$14.4B
Backlog is the company's own total of expansion projects, as stated in its Q3 FY2026 release. It is not revenue and not a GAAP figure.
These are the company's own measures, defined by the company. They are not comparable across companies, and they are not added together. Each sits beside the nearest official (GAAP) figure.
Learn: Non-GAAP measures: what a company's "adjusted" numbers leave out
17Financial strength and debt
17Financial strength · Dec 31, 2025
How much debt does Kinder Morgan have?
- Total debt$32.0B
- Cash and investments$63M
- Net debt (debt minus cash)$31.9B
- Net worth (shareholders' money)$31.2B
- Debt to equity
- 1.03×
- $ of debt for every $1 of shareholders' money
- Interest cover
- 2.6×
- how many times operating profit covers interest
- Net debt, debt-to-equity, interest cover and years of cash flow are a Cityfort calculation from the FY2025 10-K: debt $32,003M minus $63M cash; debt ÷ Kinder Morgan stockholders' equity of $31,162M; operating income $4,724M ÷ net interest $1,801M; debt ÷ operating cash flow of $5,917M.
- The company's own Net Debt, which also removes debt fair value adjustments and a currency item, was $31,716 million at Dec 31, 2025, stated in the Q4 FY2025 earnings release. It was $32,229 million at Sep 30, 2026, stated in the Q3 FY2026 release.
- Total debt includes $1,226 million due within a year. Goodwill was $20,084 million of $72,748 million total assets.
18Who owns it
18Who owns it · ownership as of Mar 16, 2026
Who owns Kinder Morgan?
- Officers and directors (as a group), shares
- 12.7%
Share classes
Holders of 5% or more
From the company's proxy statement (DEF 14A), later Schedule 13G filings and the share counts on its latest annual or quarterly report. Each holder row shows the date of its own filing.
Learn: How to read a proxy statement (DEF 14A): Nvidia's 2026 proxy · Form 4 insider filings: who files, the codes and the footnotes
19What it does with profit
19What it does with profit
What does Kinder Morgan do with its profit?
Dividend per share
$1.17FY2025
Dividend paid for each share, by financial year.
$ per share
See the numbers
Buyback · Dec 31, 2023
FY2023: paid $522 million for its own shares.
$522M
Buyback · Dec 31, 2024
FY2024: paid $7 million for its own shares.
$7M
20Governance signals
20Governance signals
What do Kinder Morgan's governance filings show?
- Auditor
- PricewaterhouseCoopers LLP, since 1997
- Auditor changes
- None in the period covered
- Audit qualifications
- None reported
- Related-party dealings
- The 2026 proxy describes a shareholders agreement signed at the 2011 IPO with a group of holders including Richard D. Kinder. It gives Mr. Kinder registration rights for some of his shares.
- Credit rating
- S&P Global Ratings, Moody's and Fitch (as stated in the FY2025 10-K and Q3 FY2026 10-Q) BBB+ (S&P) / Baa1 (Moody's) / BBB+ (Fitch) (outlook Moody's stable; Fitch stable at the 10-K date), Oct 23, 2026
A credit rating describes the company's ability to repay debt. It is not a rating of the share.
Flags to know about
other
Shares put up as loan collateral
The 2026 proxy says President Dax Sanders has put up 218,370 shares as collateral for a line of credit that was undrawn on Mar 16, 2026.
21How it got here
21How it got here
How did Kinder Morgan get here?
2007
Business-model change
Taken private
A 2007 going-private deal brought in investment funds as owners.
2011
Milestone
Listed again
Kinder Morgan, Inc. held its initial public offering in February 2011.
2012
Business-model change
Bought El Paso
Acquired El Paso Corporation and took on some of its pension plan obligations.
2014
Business-model change
Bought out its listed units
On Nov 26, 2014 it bought all units of KMP and EPB and shares of KMR it did not already own.
2015
Milestone
Kinder becomes Executive Chairman
Richard Kinder has been Executive Chairman since June 2015, after 16 years as Chairman and CEO.
2023
Milestone
Kim Dang named CEO
Kim Dang became CEO on Aug 1, 2023, after Steven Kean.
2026
Milestone
Credit rating upgrades
S&P raised its rating to BBB+ on Jan 13, 2026; Moody's raised it to Baa1 in March 2026.
2026
Milestone
Backlog reaches $14.4 billion
Additions of $5.4 billion in Q3 FY2026 lifted the project backlog to $14.4 billion.
22Sources and changes
Where every number on this page comes from
Sources (18 documents)
- S1Form 10-Q for Q3 FY2026 · SEC EDGAR · Tier 1: company or exchange filing · Oct 23, 2026
- S2Form 10-Q for Q2 FY2026 · SEC EDGAR · Tier 1: company or exchange filing · Jul 24, 2026
- S3Form 10-Q for Q1 FY2026 · SEC EDGAR · Tier 1: company or exchange filing · Apr 24, 2026
- S4Form 10-K for FY2025 · SEC EDGAR · Tier 1: company or exchange filing · Feb 13, 2026
- S5Form 10-Q for Q3 FY2025 · SEC EDGAR · Tier 1: company or exchange filing · Oct 24, 2025
- S6Form 10-Q for Q2 FY2025 · SEC EDGAR · Tier 1: company or exchange filing · Jul 18, 2025
- S7Form 10-Q for Q1 FY2025 · SEC EDGAR · Tier 1: company or exchange filing · Apr 18, 2025
- S8Form 10-K for FY2024 · SEC EDGAR · Tier 1: company or exchange filing · Feb 13, 2025
- S9Form 10-Q for Q3 FY2024 · SEC EDGAR · Tier 1: company or exchange filing · Oct 18, 2024
- S10Form 10-Q for Q2 FY2024 · SEC EDGAR · Tier 1: company or exchange filing · Jul 19, 2024
- S11Form 10-Q for Q1 FY2024 · SEC EDGAR · Tier 1: company or exchange filing · Apr 19, 2024
- S12Form 10-K for FY2023 · SEC EDGAR · Tier 1: company or exchange filing · Feb 20, 2024
- S13Form 10-K for FY2022 · SEC EDGAR · Tier 1: company or exchange filing · Feb 8, 2023
- S14Form 10-K for FY2021 · SEC EDGAR · Tier 1: company or exchange filing · Feb 7, 2022
- S152026 proxy statement (DEF 14A) · SEC EDGAR · Tier 1: company or exchange filing · Apr 2, 2026
- S16Q3 FY2026 earnings release (8-K Ex. 99.1) · SEC EDGAR · Tier 1: company or exchange filing · Oct 21, 2026
- S19Q4 FY2025 earnings release (8-K Ex. 99.1) · SEC EDGAR · Tier 1: company or exchange filing · Jan 21, 2026
- S23Q4 FY2024 earnings release (8-K Ex. 99.1) · SEC EDGAR · Tier 1: company or exchange filing · Jan 22, 2025
Changes to this page (v1 · Nov 20, 2026)
- v1 · Nov 20, 2026First version. (first version)
Numbers come only from tier 1 and tier 2 sources. Read how we research.
Disclaimer
For learning only. Cityfort is not a registered investment adviser or broker-dealer and does not recommend buying or selling any security. Prices shown are dated and may be out of date.
Investing in securities involves risk, including loss of capital. Before making any investment decision, do your own research and consider consulting a registered investment adviser or other qualified professional.
Cityfort, its owners and contributors may or may not hold securities of companies covered. Cityfort is not paid by any company it covers. Content is not an offer or solicitation to buy or sell any security, including in any initial public offering.
Read the positions policyRead the full disclaimerHide the full disclaimer
Cityfort publishes general educational content that explains how listed companies work. Cityfort is not registered with the US Securities and Exchange Commission or any state securities regulator as an investment adviser, and is not a broker-dealer or a member of FINRA. Cityfort does not provide investment, tax or legal advice, recommendations, ratings, price targets or any opinion on whether to buy, sell or hold any security. Nothing on the site is tailored to any person's circumstances.
All information is taken from publicly available sources, mainly company filings with the SEC, which are listed on each page with dates. We work to keep it accurate and correct errors publicly, but we do not guarantee that it is complete, accurate or up to date. Any market price or price-based ratio shown is dated, may be out of date by the time you read it, and is included only to explain concepts.
Statements by company management, including forward-looking statements and guidance, are reported as the company's statements, with their date and source; they are not our forecasts. Adjusted (non-GAAP) figures are the company's own measures and are shown next to the official (GAAP) figures.