Energy · NYSE: WMB
Williams: how the business works
Williams owns natural gas pipelines across the United States, including Transco from Texas to the New York City area, and had $11,950 million of revenue in FY2025.
By Hardik Bhandare · Checked against filings: . Editorial policy. Corrections
Follow Williams
Email me when Williams's page is updated after earnings.
We'll send a confirmation email first. See our privacy policy.
The Williams Companies, Inc. · Tulsa, Oklahoma · Founded 1908
Updated for Q3 FY2026 · checked
- Revenue, FY2025
- $11.95B
- Net income, FY2025
- $2.62B
- Pipelines it owns an interest in and operates
- Over 32,000 miles
- Employees, Feb 1, 2026
- 5,987
- Founded
- 1908
The short version
Williams in 5 points
1 · What it sells
Williams moves, collects, processes and stores natural gas through over 32,000 miles of pipelines in 24 states and the Gulf of America, and had total revenues of $11,950 million in FY2025.
2 · Who pays it
In FY2025, gas producers paid $4,372 million for gathering and processing, pipeline and storage users $3,721 million for regulated transportation and storage, and buyers of gas and NGLs $3,290 million in product sales.
3 · What it keeps from $100
Of every $100 that came in during FY2025, Williams kept $20.4 as net income, which includes $871 million from part-owned companies and other income and a $120 million hedge gain; operating income plus depreciation was $54.8 per $100 of revenue.
4 · Where the operating profit comes from
Of FY2025 Adjusted EBITDAOperating profit before wear-and-tear charges (depreciation and amortization). As a margin: per $100 of sales., a company measure, Transmission, Power & Gulf gave $3,710 million, Northeast G&P $2,028 million, West $1,450 million and Gas & NGL Marketing Services $193 million.
5 · The one thing to watch
Total debt was $33,934 million on Sep 30, 2026, up from $29,361 million at the end of 2025, and Williams guided on Nov 2, 2026 to $7.3 billion to $7.9 billion of growth capital spending for 2026.
Sources: From Williams' FY2025 10-K, the Q3 FY2026 10-Q and the Q4 FY2025 and Q3 FY2026 earnings releases · checked
01Where the money goes · FY2025
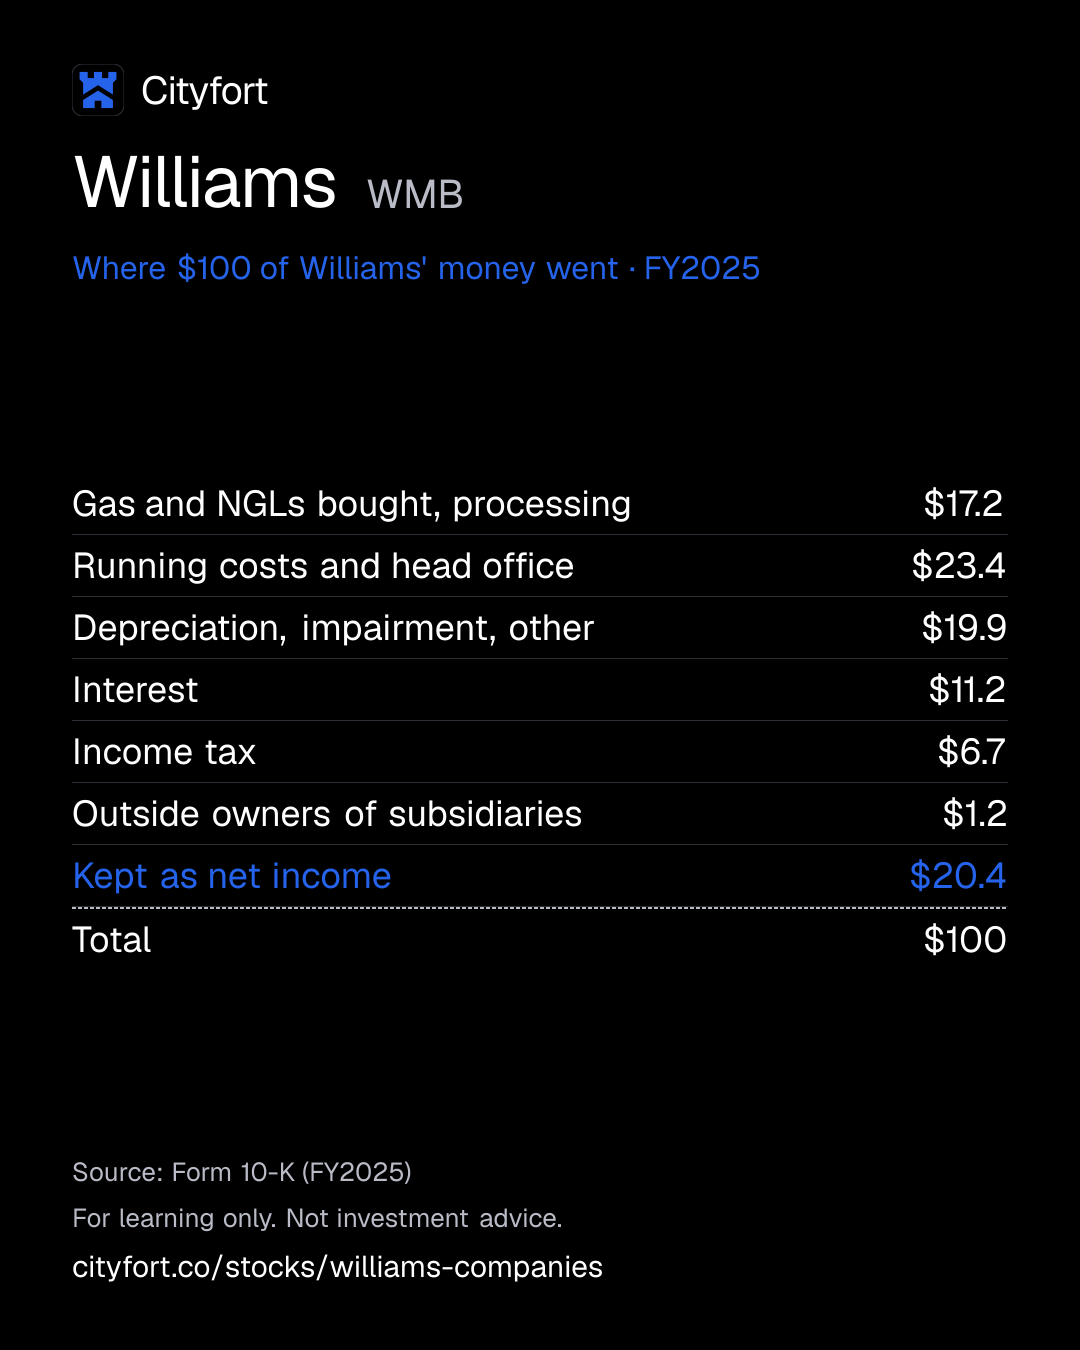
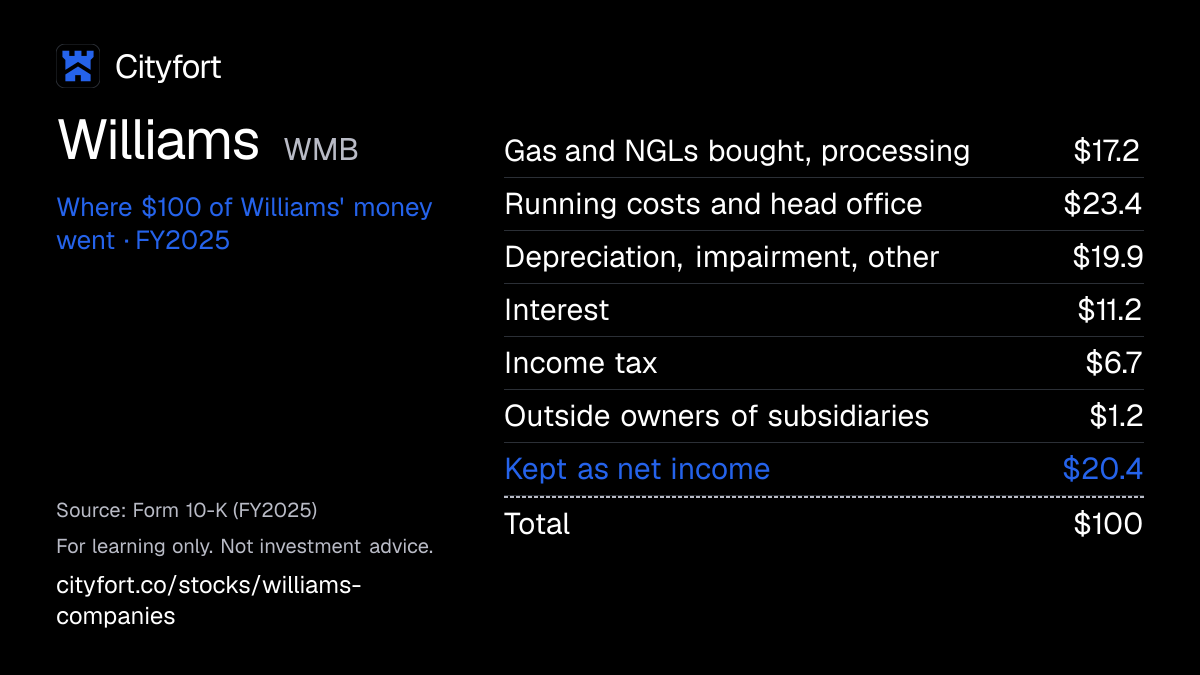
Where does $100 of Williams' money go?
Williams · FY2025
Receipt for every $100
| Gas and NGLs bought, processing | $17.2 |
|---|---|
| Running costs and head office | $23.4 |
| Depreciation, impairment, other | $19.9 |
| Interest | $11.2 |
| Income tax | $6.7 |
| Outside owners of subsidiaries | $1.2 |
| Kept as net income | $20.4 |
| Total | $100 |
Each line = amount ÷ total money in × 100. Lines may not add to exactly $100 because of rounding.
How this is worked out
Cityfort calculation from the FY2025 10-K. Of every $100 that came in during FY2025: each line ÷ total revenues and other income of $12,821 million (revenues $11,950 million + earnings from part-owned companies $760 million + other investing income $42 million + other income $69 million). Revenues include a $120 million gain on commodity hedges.
Save this receipt as an image
Embed this receipt or the key numbers
Paste this code into a blog or website to show the card you choose, with a link back to this page.
Each week: the next company due to report earnings, explained in 5 points.
No tips. Unsubscribe anytime.
We'll send a confirmation email. See our privacy policy.
02The business in one line
What does Williams do?
Utilities, power plants and gas producers pay Williams fees to move, collect, process and store natural gas. Running the network, wear on assets and interest take most of the money; $20.4 of every $100 was left as net income in FY2025.
- Regulated gas transportation and storage brought in $3,721 million in FY2025, and gathering and processing fees from producers $4,372 million.
- Interest on debt took $1,442 million in FY2025, and total debt was $33,934 million on Sep 30, 2026.
03Who pays it
Who pays Williams?
Williams does not disclose how much each type of customer pays.
Utilities, power plants and industrial users
Pay for space on the interstate pipelines and in storage, mostly under long-term firm contracts. Regulated gas transportation and storage brought in $3,721 million in FY2025.
Gas producers
Pay fees to have their gas collected, processed and moved from the well. These services brought in $4,372 million in FY2025, plus $192 million paid in kind as commodities.
Buyers of gas and NGLs
Marketers, utilities and others buy the gas and NGLs Williams sells. Product sales were $3,290 million in FY2025.
Large power users
Buy electricity from the new power projects under agreements of 10 to 12.5 years.
How spread out the customers are
Williams has about 800 customers. The 10-K gives concentration by business: in 2025 the top ten interstate pipeline customers made up about 44% of regulated transportation and storage revenue, and the top ten gathering and processing customers about 55% of that business's fee revenue and NGL margins.
04How it makes money
How does Williams make money?
Williams mostly earns fees for moving, processing and storing gas, so profit follows contracts and volumes more than gas prices.
Pipeline customers sign long-term contracts to reserve space, and most gathering contracts are fee-based. The marketing segment gave $193 million of FY2025 Adjusted EBITDA of $7,750 million, a company measure.
Net income kept per $100 of revenue
$14.3$21.9
FY2021 to FY2025
- Producers drill gas, and utilities and power plants want more of it
- Customers sign long-term contracts for new pipeline or gathering capacity
- Williams borrows and builds the project
- Once in service, the project earns fees for years
- Fees pay interest and the dividend, and fund the next expansion
↺ Step 5 feeds back into step 1.
05Business segments · FY2025
Which businesses make up Williams?
Transmission, Power & Gulf
43.1%Interstate pipelines (Transco, Northwest Pipeline, MountainWest), Gulf of America gathering and processing, storage and the new power projects. Adjusted EBITDA $3,710 million in FY2025.
Revenue $5.4B ($5,443M)
Northeast G&P
17.2%Gathering and processing in the Marcellus and Utica shale regions of Pennsylvania, New York, Ohio and West Virginia. Adjusted EBITDA $2,028 million in FY2025.
Revenue $2.2B ($2,168M)
West
22.5%Gathering and processing in Colorado, Wyoming, Texas and the Haynesville region of Texas and Louisiana. Adjusted EBITDA $1,450 million in FY2025.
Revenue $2.8B ($2,847M)
Gas & NGL Marketing Services
17.2%Buys, sells and trades gas and NGLs using pipeline and storage space. Adjusted EBITDA $193 million in FY2025.
Revenue $2.2B ($2,175M)
How the mix changed
- Transmission, Power & Gulf
- Northeast G&P
- West
- Gas & NGL Marketing Services
Revenue by segment, FY2023 to FY2025.
US$
See the numbers
06The numbers · Consolidated · US$
How has Williams done?
Revenue
$12.0BFY2025
Revenue stayed between $10.5 billion and $12.0 billion from FY2021 to FY2025, and includes hedge gains or losses, such as a $956 million gain in FY2023.
US$
See the numbers
Net income
$2.6BFY2025
Net income attributable to Williams grew from $1,517 million in FY2021 to $2,618 million in FY2025. The FY2023 peak of $3,179 million included a $534 million gain from a court judgment against Energy Transfer.
US$
See the numbers
Net income for every $100 of revenue
$21.9FY2025
EBITDA, here operating income plus depreciation, was $54.8 per $100 of revenue in FY2025, up from $42.1 in FY2021.
Net margin: $ of net income per $100 of revenue
See the numbers
Free cash flow
$1.0BFY2025
Free cash flow fell to $1,005 million in FY2025 from $2,401 million in FY2024, while capital spending rose to $4,893 million from $2,573 million.
US$ · cash from operations minus spending on plants and equipment
See the numbers
See all yearly numbers
EBITDA here = operating income plus depreciation and amortization (from the cash flow statement). Fiscal years are the company's own: Fiscal year ends Dec 31 (the calendar year). Net income is the share belonging to the company's owners.
Learn: Fiscal years that don't end in December: Nvidia's FY2027 explained · Stock-based compensation and dilution: pay that becomes shares
Sources (16)
- Form 10-K for FY2021
- Form 10-K for FY2022
- Form 10-K for FY2023
- Form 10-K for FY2024
- Form 10-K for FY2025
- Form 10-Q for Q3 FY2023
- Form 10-Q for Q1 FY2024
- Form 10-Q for Q2 FY2024
- Form 10-Q for Q3 FY2024
- Form 10-Q for Q1 FY2025
- Form 10-Q for Q2 FY2025
- Form 10-Q for Q3 FY2025
- Form 10-Q for Q1 FY2026
- Form 10-Q for Q2 FY2026
- Earnings release (8-K Ex. 99.1), Q3 FY2026
- Form 10-Q for Q3 FY2026
07Who runs it
Who runs Williams, and did they deliver?
Chad J. Zamarin
President and Chief Executive Officer · since 2025
CEO since July 2025; previously led corporate strategic development from January 2023.
John D. Porter
Executive Vice President and Chief Financial Officer · since 2022
Alan S. Armstrong
Executive Chair of the Board · since 2025
Retired as CEO in July 2025 and became executive chair; a director since 2011. He owned 2,888,351 shares including restricted stock units, under 1%.
Stephen W. Bergstrom
Independent Lead Director · since 2025
Non-executive chair from 2017 to July 2025; a director since 2016.
What they said, and what happened
1 delivered · 3 too early to tell
Said on Feb 12, 2025
2025 Adjusted EBITDA of $7.45 billion to $7.85 billion.
DeliveredWhat happened
FY2025 Adjusted EBITDA was $7,750 million, inside the range, per the Feb 10, 2026 release.
Said on Feb 10, 2026
2026 Adjusted EBITDA of $8.05 billion to $8.35 billion.
Too early to tellWhat happened
The Aug 3, 2026 release raised the midpoint by $200 million to $8.4 billion, reflecting the Momentum acquisition. The Nov 2, 2026 release gave $8.3 billion to $8.5 billion.
Said on Nov 2, 2026
Socrates' Plato North power project on track for in-service by mid-November 2026.
Too early to tellWhat happened
No later filing confirming the in-service date was in the research as of Nov 20, 2026.
Said on Nov 2, 2026
Power projects in service as follows, assuming permits: Apollo (Ohio, 490 MW) in the second half of 2027; Aquila (Utah, 520 MW) from late 2027 to the first half of 2028; Socrates the Younger and Neo (Ohio) in the second half of 2028.
Too early to tellWhat happened
Not yet reported.
08What could go wrong
What could go wrong for Williams?
- Debt
Large and rising debt
Total debt was $33,934 million on Sep 30, 2026, up from $29,361 million at the end of 2025. The 10-K says a credit rating downgrade could raise borrowing costs and limit access to capital.
Watch Debt-to-Adjusted EBITDA (3.80x in Q3 FY2026) and rating outlooks from S&P, Moody's and Fitch.
- Regulation
Regulated pipeline rates
Transco filed a general rate case with FERC on Aug 30, 2024. The Q3 FY2026 10-Q says FERC approved a settlement on Dec 30, 2025, the settled rates took effect Mar 1, 2026, and Transco paid a net $221 million of refunds in Apr 2026. FERC decisions set how much the interstate pipelines can charge.
Watch Future FERC rate filings for Transco and Williams' other interstate pipelines.
- Demand
Demand for natural gas
The 10-K says gas demand could fall if laws favor solar and wind or restrict gas in power plants. It could also rise with growing power demand.
Watch Transco's average daily transportation volumes in each release (15.4 million dekatherms a day in Q3 FY2026).
- Raw-material prices
Commodity swings in marketing
Marketing segment Adjusted EBITDA moved from $227 million in Q1 FY2026 to minus $1 million in Q2 FY2026. Reported revenue also includes hedge gains or losses, such as a $263 million loss in the first nine months of 2026.
Watch Gas & NGL Marketing Services Adjusted EBITDA and the commodity derivative line.
- Execution
Building the power projects
Four power projects after Socrates have in-service dates from the second half of 2027 to the second half of 2028. The company says those dates assume permits, and the 10-K names opposition to new facilities as a risk.
Watch In-service dates for Apollo, Aquila, Socrates the Younger and Neo against the dates the company gave.
- Concentration
Customers in gathering
In 2025 the top ten gathering and processing customers made up about 55% of that business's fee revenue and NGL margins. The 10-K says results depend on gas being produced in its supply basins.
Watch Gathering volumes in the Northeast (4.14 billion cubic feet a day in Q3 FY2026) and West.
- Legal
Royalty lawsuits
Williams is a defendant in some Pennsylvania cases alleging it improperly took part with Chesapeake (now Expand Energy) in alleged royalty underpayments. Williams says the claims are covered by indemnity obligations Chesapeake owes it.
Watch Updates in the contingencies note of each 10-Q and 10-K.
09Supporters vs. critics
What do supporters and critics point to?
What supporters point to
- About 93% of 2025 NGL production volumes were under fee-based contracts, and pipeline space is mostly sold under long-term firm reservation contracts, per the FY2025 10-K.
- Adjusted EBITDA, a company measure, was $2,039 million in Q3 FY2026, up from $1,920 million in Q3 FY2025, per the Q3 FY2026 release.
- Williams says it has paid dividends for 52 consecutive years, and it reported dividend coverage of 2.40x by its own AFFO measure for FY2025.
- In July 2026 Williams sold a 49% stake in five power projects for $5.34 billion of committed capital; Socrates South went into service in late July 2026 and the Q3 10-Q expects Socrates North later in Q4 2026.
- Management said in the Feb 10, 2026 release that 7.1 billion cubic feet a day of transmission projects were in execution.
What critics point to
- Total debt rose to $33,934 million on Sep 30, 2026 from $29,361 million at the end of 2025, and FY2025 interest of $1,442 million equaled about a third of operating income.
- In FY2025 Williams paid $2,442 million in common dividends while free cash flow was $1,005 million, and it raised $4,940 million of long-term debt.
- Transco's rates are set by FERC: in its latest rate case, settled with FERC approval on Dec 30, 2025, Transco paid a net $221 million of refunds to customers in Apr 2026.
- In 2025 the top ten gathering and processing customers made up about 55% of that business's fee revenue and NGL margins.
- Williams is a defendant in some Pennsylvania cases alleging it took part with Chesapeake in alleged royalty underpayments; Williams says Chesapeake owes it indemnity for the claims.
10What to watch next
What should you watch next at Williams?
Next event
Q4 FY2026 results
Date not announced yet.
Debt and credit ratings
Total debt was $33,934 million on Sep 30, 2026, and Williams reported debt-to-Adjusted EBITDA of 3.80x for Q3 FY2026. The Q3 10-Q states ratings of BBB+ (S&P), Baa2 (Moody's) and BBB (Fitch).
Power project dates
The company gives in-service dates from the second half of 2027 to the second half of 2028 for Apollo, Aquila, Socrates the Younger and Neo, assuming permits.
Socrates North in service
The Q3 FY2026 10-Q says Socrates North, the second half of Williams' first power project in New Albany, Ohio, remains under construction and is expected in service later in Q4 2026.
Momentum in the results
The Haynesville business, bought for about $5.1 billion, added $113 million of revenue and $40 million of Modified EBITDA from Sep 3 to Sep 30, 2026, its only weeks in the Q3 FY2026 figures.
2026 Adjusted EBITDA against guidance
In the Nov 2, 2026 release, Williams said it expects 2026 Adjusted EBITDA of $8.3 billion to $8.5 billion, a company measure; FY2025 was $7,750 million.
11Key facts
Key facts about Williams
- What does The Williams Companies do?
- The Williams Companies owns an interest in and operates over 32,000 miles of natural gas pipelines in 24 states and the Gulf of America, according to its FY2025 10-K. Its Transco pipeline runs about 9,600 miles from Texas to the New York City area.
- How does Williams make money?
- Williams mostly earns fees for moving, collecting, processing and storing natural gas. In FY2025, regulated gas transportation and storage brought in $3,721 million, gathering and processing services $4,372 million and product sales $3,290 million.
- Who are Williams' customers?
- Williams has about 800 customers, including utilities, power plants, industrial users and gas producers. In 2025 its top ten interstate pipeline customers made up about 44% of its regulated transportation and storage revenue, per the FY2025 10-K.
- How big is Williams?
- The Williams Companies had total revenues of $11,950 million and net income attributable to Williams of $2,618 million in FY2025, up from $10,503 million and $2,225 million in FY2024. It had 5,987 employees on Feb 1, 2026.
- Which Williams segment is the largest?
- Transmission, Power & Gulf, which holds Williams' interstate pipelines, had $5,443 million of FY2025 segment revenue, the most of its four segments. Its Adjusted EBITDA, a company measure, was $3,710 million in FY2025.
- How much debt does Williams have?
- The Williams Companies had total debt of $33,934 million and cash of $1,756 million on Sep 30, 2026, per its Q3 FY2026 10-Q. Debt was $29,361 million at the end of 2025.
- Does Williams pay a dividend?
- Yes. Williams paid $2.00 a share in dividends for FY2025 and approved a quarterly dividend of $0.525 a share on Jan 27, 2026. It paid $2,442 million in common dividends in FY2025, while free cash flowCash from operations minus spending on buildings and equipment. Learn more was $1,005 million.
- Who owns Williams?
- In The Williams Companies' 2026 proxy statementThe yearly filing about shareholder votes, the board and executive pay. Learn more, The Vanguard Group held 10.96% of the common stock, BlackRock 8.82% and State Street 5.56%. Directors and executive officers as a group owned under 1%.
Terms on this page
- Capital expenditures (capex)
- Debt-to-equity
- Earnings per share (EPS)
- EBITDA
- Free cash flow
- Net debt
- Net margin
- Revenue vs net income
Each explains the term in plain English, with the same number from other companies on Cityfort.
Go deeper
More detail from the same filings. Open any section.
12What it sells
12What it sells
What does Williams sell?
Long-distance gas pipelines
Transco runs about 9,600 miles from Texas and the Gulf of America to the New York City area. Northwest Pipeline and MountainWest serve the Northwest and the Rocky Mountains.
Gathering and processing
Smaller pipelines collect gas from wells in shale regions such as the Marcellus, Utica and Haynesville. Its 35 processing plants take out liquids so the gas can enter the main pipelines.
Storage
Underground reservoirs and other sites hold 423 billion cubic feet of natural gas and about 23 million barrels of NGLs.
Gas and NGL marketing
A trading arm buys and sells gas and NGLs, using space it holds on pipelines and in storage.
Power for data centers
Gas-fired power projects built next to large electricity users. The first, Socrates in New Albany, Ohio, has 556 megawatts under a 10-year power purchase agreement.
Think of it like this
Its big pipelines work like a toll road: customers sign long-term contracts to reserve space and pay fees to move their gas.
What it does
- Does: Moves, collects, processes and stores natural gas for producers, utilities and power plants
- Does: Owns an interest in and operates over 32,000 miles of pipelines in 24 states and the Gulf of America
- Does: Builds gas-fired power projects for large electricity users such as data centers
What it does not do
- Does not: Operate outside the United States: all its operations are in the US
- Does not: Earn most of its gathering income from commodity prices: about 93% of 2025 NGL production volumes were under fee-based contracts
Sources (2)
13How the money flows
13How the money flows · FY2025
How does money flow through Williams?
Money in
- Total revenues (including a $120 million commodity hedge gain)$12.0B
- Earnings from part-owned companies and other income$871M
The company
Williams
$12.8B came in
Money out
- Gas and NGLs bought, and processing costs$2.2B
- Running pipelines and plants, and head-office costs$3.0B
- Depreciation, impairment and other operating items$2.6B
- Interest on debt$1.4B
- Income tax$857M
- Share of outside owners in subsidiaries$150M
- Net income attributable to Williams$2.6B
- Customers paid Williams $11,950 million in FY2025, and part-owned companies and other income added $871 million.
- Buying gas and NGLs to resell, plus processing costs, took $2,199 million.
- Running pipelines, plants and the head office took $3,003 million; wear on assets, a $212 million write-down and other items took $2,552 million.
- Interest on debt took $1,442 million and income tax $857 million.
- After $150 million for outside owners of some subsidiaries, $2,618 million was left as net income.
Sources (1)
14What it needs to run
14What it needs to run
What does Williams need to run?
Gas supply in the basins it serves
The 10-K says its pipeline and gathering businesses depend on gas being produced in its supply areas and on demand in its markets.
Regulators and permits
Interstate pipeline rates and new interstate pipelines are regulated by the Federal Energy Regulatory Commission (FERC). The 10-K names rising regulation and public opposition to new pipelines.
Land rights
Williams does not own all the land under its pipelines and facilities, which the 10-K lists as a risk.
Borrowed money
Debt was $33,934 million on Sep 30, 2026. Management guided to $7.3 billion to $7.9 billion of growth capital spending for 2026 in the Nov 2, 2026 release.
Workforce
5,987 employees on Feb 1, 2026.
15Where growth could come from
15Where growth could come from
Where could Williams' growth come from?
In its Nov 2, 2026 earnings release, Williams said it expects 2026 Adjusted EBITDA of $8.3 billion to $8.5 billion, tracking toward the upper half. It guided to growth capital spending of $7.3 billion to $7.9 billion.
Pipeline expansions
WorkingTPG Adjusted EBITDA $3,710M in FY2025 vs $3,307M
Management said in the Feb 10, 2026 release that 1.1 billion cubic feet a day of transmission projects were completed in 2025. Another 7.1 billion cubic feet a day were in execution.
Status: Working, on track against what the company said.
Power for data centers
EarlySocrates: 556 MW
Socrates is the first project. Four more (Apollo, Aquila, Socrates the Younger and Neo) are under agreements. The company gives in-service dates from the second half of 2027 to the second half of 2028, assuming permits.
Status: Early, too early to judge.
Haynesville gathering (Momentum)
NewAbout $5.1B deal, closed Sep 3, 2026
The acquired business added $113 million of revenue and $40 million of Modified EBITDA from Sep 3 to Sep 30, 2026.
Status: New, recently announced.
Status compares progress with what the company itself said it would do: Working = on track against what the company said; Mixed = partly on track; Behind = behind the company's own plan; New = recently announced; Early = too early to judge.
16The company's own measures (non-GAAP)
16The company's own measures · FY2025 and Q3 FY2026
What do Williams' own measures show?
Official (GAAP): Net income attributable to Williams, FY2025
$2.6B
Company's own measure: Adjusted EBITDA, FY2025
$7.8B
Adds back interest, tax, depreciation and amortization, and removes items the company lists, such as hedge gains or losses that are not yet settled.
Official (GAAP): Diluted earnings per share, FY2025
$2.14
Company's own measure: Adjusted earnings per share, FY2025
$2.10
Net income per share after removing the same kind of listed items.
Official (GAAP): Cash from operations, FY2025
$5.9B
Company's own measure: Available funds from operations (AFFO), FY2025
$5.9B
The company's cash measure; it divides AFFO by dividends paid to report dividend coverage of 2.40x for FY2025.
Official (GAAP): Net income attributable to Williams, Q3 FY2026
$700M
Company's own measure: Adjusted EBITDA, Q3 FY2026
$2.0B
Up from $1,920 million in Q3 FY2025, as stated in the Q3 FY2026 release.
Official (GAAP): Diluted earnings per share, Q3 FY2026
$0.56
Company's own measure: Adjusted earnings per share, Q3 FY2026
$0.54
Lower than GAAP EPS in this quarter; GAAP income included an $83 million gain on selling a Permian gathering system.
These are the company's own measures, defined by the company. They are not comparable across companies, and they are not added together. Each sits beside the nearest official (GAAP) figure.
Learn: Non-GAAP measures: what a company's "adjusted" numbers leave out
17Financial strength and debt
17Financial strength · Sep 30, 2026
How much debt does Williams have?
- Total debt$33.9B
- Cash and investments$1.8B
- Net debt (debt minus cash)$32.2B
- Net worth (shareholders' money)$15.7B
- Debt to equity
- 2.16×
- $ of debt for every $1 of shareholders' money
- Total debt is long-term debt of $31,732 million plus $2,202 million due within a year; there was no commercial paper. Net debt is debt minus $1,756 million of cash. Cityfort calculation from the Q3 FY2026 10-Q; the years of cash flow use the FY2025 10-K.
- Williams reports its own debt-to-Adjusted EBITDA of 3.80x for Q3 FY2026, stated in the Q3 FY2026 earnings release; it is not the loan-covenant ratio.
- A credit agreement of up to $3.75 billion was signed May 19, 2026. It limits debt to 5.00 times EBITDA, or 5.50 times in an acquisition quarter and the next two.
- Outside owners of subsidiaries held $5,761 million of equity on Sep 30, 2026, up from $2,188 million at the end of 2025. In July 2026 Williams sold a 49% stake in its power projects for $5.34 billion of committed capital.
- New notes in 2026 include $500 million at 5.650% due 2033 (January) and $500 million at 5.000% due 2029 (September). Each issue had longer tranches too.
18Who owns it
18Who owns it · ownership as of Feb 24, 2026
Who owns Williams?
- Officers and directors (as a group), shares
- 0.5%
Share classes
Holders of 5% or more
From the company's proxy statement (DEF 14A), later Schedule 13G filings and the share counts on its latest annual or quarterly report. Each holder row shows the date of its own filing.
Learn: How to read a proxy statement (DEF 14A): Nvidia's 2026 proxy · Form 4 insider filings: who files, the codes and the footnotes
19What it does with profit
19What it does with profit
What does Williams do with its profit?
Dividend per share
$2.00FY2025
Dividend paid for each share, by financial year.
$ per share
See the numbers
No buybacks or fund raises in the period covered.
Sources (1)
20Governance signals
20Governance signals
What do Williams' governance filings show?
- Auditor
- Ernst & Young LLP, since 1962
- Auditor changes
- None in the period covered
- Audit qualifications
- None reported
- Related-party dealings
- The 2026 proxy statement describes a written policy for reviewing transactions with related persons. The trading policy bars directors, officers and employees from using company shares as loan collateral or holding them in margin accounts. Nine of the 11 board nominees in 2026 were independent.
- Credit rating
- S&P, Moody's and Fitch (as stated in the Q3 FY2026 10-Q) BBB+ (S&P) / Baa2 (Moody's) / BBB (Fitch) (outlook Stable (S&P); Positive (Moody's and Fitch)), Nov 2, 2026
A credit rating describes the company's ability to repay debt. It is not a rating of the share.
21How it got here
21How it got here
How did Williams get here?
1908
Milestone
Founded
Williams was founded in 1908; it reincorporated in Delaware in 1987.
2023
Milestone
Court judgment against Energy Transfer
A $534 million net gain from a litigation judgment against Energy Transfer added to FY2023 net income.
2024
Milestone
Gulf Coast storage and Discovery
Bought gas storage in Louisiana and Mississippi in January 2024 and the remaining 40% of Discovery for $170 million in August 2024.
2025
Milestone
New CEO
Alan Armstrong retired as CEO in July 2025; Chad Zamarin became president and CEO, and Armstrong executive chair.
2026
Business-model change
Power joint venture
In July 2026 Williams sold a 49% stake in five power projects, in a joint venture with Blackstone, for $5.34 billion of committed capital.
2026
Milestone
Momentum acquisition
Closed the purchase of Momentum, which owns gathering, processing and transportation assets in the Haynesville region, on Sep 3, 2026. The price was about $5.1 billion, in cash and about 27 million Williams shares.
2026
Business-model change
Socrates South in service
Socrates South went into service in late July 2026; the Q3 10-Q expects Socrates North later in Q4 2026.
22Sources and changes
Where every number on this page comes from
Sources (25 documents)
- S1Form 10-Q for Q2 FY2026 · SEC EDGAR · Tier 1: company or exchange filing · Aug 3, 2026
- S2Form 10-Q for Q1 FY2026 · SEC EDGAR · Tier 1: company or exchange filing · May 4, 2026
- S3Form 10-K for FY2025 · SEC EDGAR · Tier 1: company or exchange filing · Feb 24, 2026
- S4Form 10-Q for Q3 FY2025 · SEC EDGAR · Tier 1: company or exchange filing · Nov 3, 2025
- S5Form 10-Q for Q2 FY2025 · SEC EDGAR · Tier 1: company or exchange filing · Aug 4, 2025
- S6Form 10-Q for Q1 FY2025 · SEC EDGAR · Tier 1: company or exchange filing · May 5, 2025
- S7Form 10-K for FY2024 · SEC EDGAR · Tier 1: company or exchange filing · Feb 25, 2025
- S8Form 10-Q for Q3 FY2024 · SEC EDGAR · Tier 1: company or exchange filing · Nov 6, 2024
- S9Form 10-Q for Q2 FY2024 · SEC EDGAR · Tier 1: company or exchange filing · Aug 5, 2024
- S10Form 10-Q for Q1 FY2024 · SEC EDGAR · Tier 1: company or exchange filing · May 6, 2024
- S11Form 10-K for FY2023 · SEC EDGAR · Tier 1: company or exchange filing · Feb 21, 2024
- S12Form 10-Q for Q3 FY2023 · SEC EDGAR · Tier 1: company or exchange filing · Nov 1, 2023
- S13Form 10-K for FY2022 · SEC EDGAR · Tier 1: company or exchange filing · Feb 27, 2023
- S14Form 10-K for FY2021 · SEC EDGAR · Tier 1: company or exchange filing · Feb 28, 2022
- S15Form 10-Q for Q3 FY2026 · SEC EDGAR · Tier 1: company or exchange filing · Nov 2, 2026
- S16Proxy statement (DEF 14A) 2026 · SEC EDGAR · Tier 1: company or exchange filing · Mar 18, 2026
- S17Earnings release (8-K Ex. 99.1), Q3 FY2026 · SEC EDGAR · Tier 1: company or exchange filing · Nov 2, 2026
- S18Earnings release (8-K Ex. 99.1), Q2 FY2026 · SEC EDGAR · Tier 1: company or exchange filing · Aug 3, 2026
- S20Earnings release (8-K Ex. 99.1), Q4 FY2025 · SEC EDGAR · Tier 1: company or exchange filing · Feb 10, 2026
- S24Earnings release (8-K Ex. 99.1), Q4 FY2024 · SEC EDGAR · Tier 1: company or exchange filing · Feb 12, 2025
- S258-K (Item 8.01) filed Nov 2, 2026: resale prospectus supplement · SEC EDGAR · Tier 1: company or exchange filing · Nov 2, 2026
- S268-K: senior notes issued Sep 10, 2026 · SEC EDGAR · Tier 1: company or exchange filing · Sep 10, 2026
- S278-K (Items 7.01, 9.01) filed Jul 13, 2026 · SEC EDGAR · Tier 1: company or exchange filing · Jul 13, 2026
- S288-K: Second Amended and Restated Credit Agreement (May 19, 2026) · SEC EDGAR · Tier 1: company or exchange filing · May 20, 2026
- S298-K: senior notes issued Jan 8, 2026 · SEC EDGAR · Tier 1: company or exchange filing · Jan 8, 2026
Changes to this page (v1 · Nov 20, 2026)
- v1 · Nov 20, 2026First version. (first version)
Numbers come only from tier 1 and tier 2 sources. Read how we research.
Disclaimer
For learning only. Cityfort is not a registered investment adviser or broker-dealer and does not recommend buying or selling any security. Prices shown are dated and may be out of date.
Investing in securities involves risk, including loss of capital. Before making any investment decision, do your own research and consider consulting a registered investment adviser or other qualified professional.
Cityfort, its owners and contributors may or may not hold securities of companies covered. Cityfort is not paid by any company it covers. Content is not an offer or solicitation to buy or sell any security, including in any initial public offering.
Read the positions policyRead the full disclaimerHide the full disclaimer
Cityfort publishes general educational content that explains how listed companies work. Cityfort is not registered with the US Securities and Exchange Commission or any state securities regulator as an investment adviser, and is not a broker-dealer or a member of FINRA. Cityfort does not provide investment, tax or legal advice, recommendations, ratings, price targets or any opinion on whether to buy, sell or hold any security. Nothing on the site is tailored to any person's circumstances.
All information is taken from publicly available sources, mainly company filings with the SEC, which are listed on each page with dates. We work to keep it accurate and correct errors publicly, but we do not guarantee that it is complete, accurate or up to date. Any market price or price-based ratio shown is dated, may be out of date by the time you read it, and is included only to explain concepts.
Statements by company management, including forward-looking statements and guidance, are reported as the company's statements, with their date and source; they are not our forecasts. Adjusted (non-GAAP) figures are the company's own measures and are shown next to the official (GAAP) figures.