Energy · NYSE: PSX
Phillips 66: how the business works
Phillips 66 refines crude oil into fuels at 10 refineries, runs pipelines and NGL plants, and had sales of $132.4 billion in FY2025.
By Hardik Bhandare · Checked against filings: . Editorial policy. Corrections
Follow Phillips 66
Email me when Phillips 66's page is updated after earnings.
We'll send a confirmation email first. See our privacy policy.
Phillips 66 · Houston, Texas · Founded 2011
Updated for Q3 FY2026 · checked
- Sales and other operating revenues, FY2025
- $132.4B
- Net income, FY2025
- $4.4B
- Refining crude capacity, end of 2025 (barrels a day)
- 1,868 thousand
- Dividends per share, FY2025
- $4.75
- Employees, Dec 31, 2025
- About 12,600
The short version
Phillips 66 in 5 points
1 · What it sells
Phillips 66 refines crude oil into gasoline, diesel and jet fuel at 10 refineries and runs pipelines and NGL plants, with sales of $132,376 million in FY2025.
2 · Who pays it
In FY2025 refined products and renewable fuels were 73.5% of Phillips 66 sales, NGL and natural gas 12.9%, crude oil resales 11.5%, and services and other 2.1% (Cityfort calculation from the FY2025 10-K).
3 · What it keeps from $100
Of every $100 that came in during FY2025, Phillips 66 kept $3.2 as net income, including $2,984 million of pre-tax gains on asset sales; adjusted earnings, the company's operating measure that leaves out such special items, were $2,632 million.
4 · Where the operating profit comes from
In FY2025 Marketing and Specialties earned $4,500 million and Midstream $2,817 million before tax, while Refining lost $274 million and Corporate and Other cost $1,540 million.
5 · The one thing to watch
Phillips 66's Refining segment earned $6,031 million before tax in Q3 FY2026, after losing $274 million in all of FY2025.
Sources: From Phillips 66's FY2025 10-K, Q4 2025 and Q3 2026 earnings releases · checked
01Where the money goes · FY2025
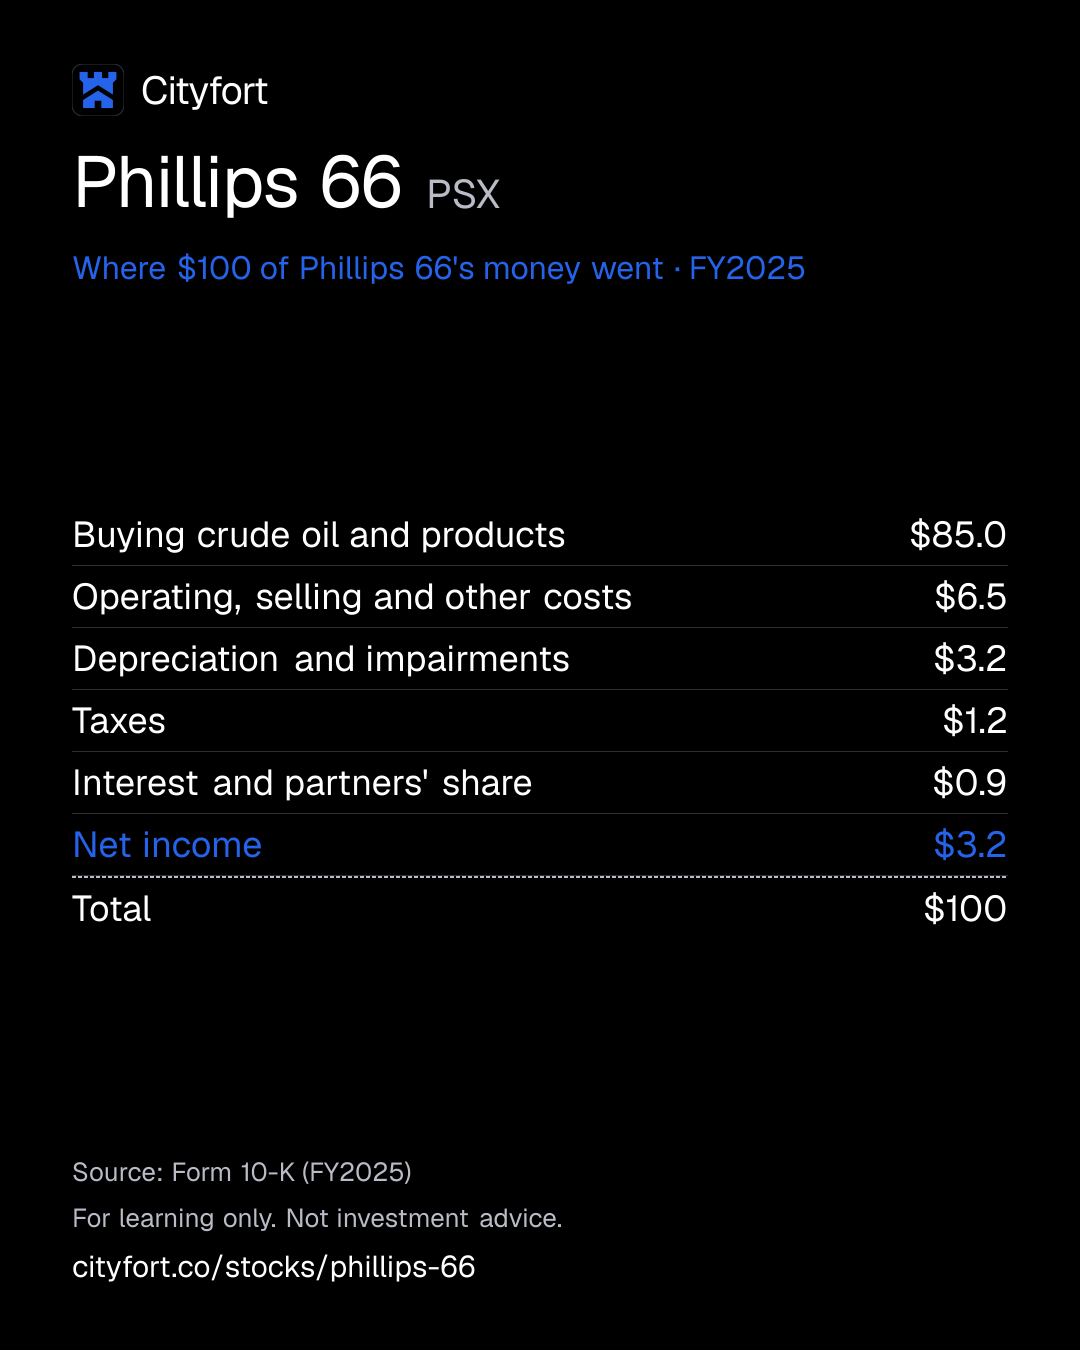
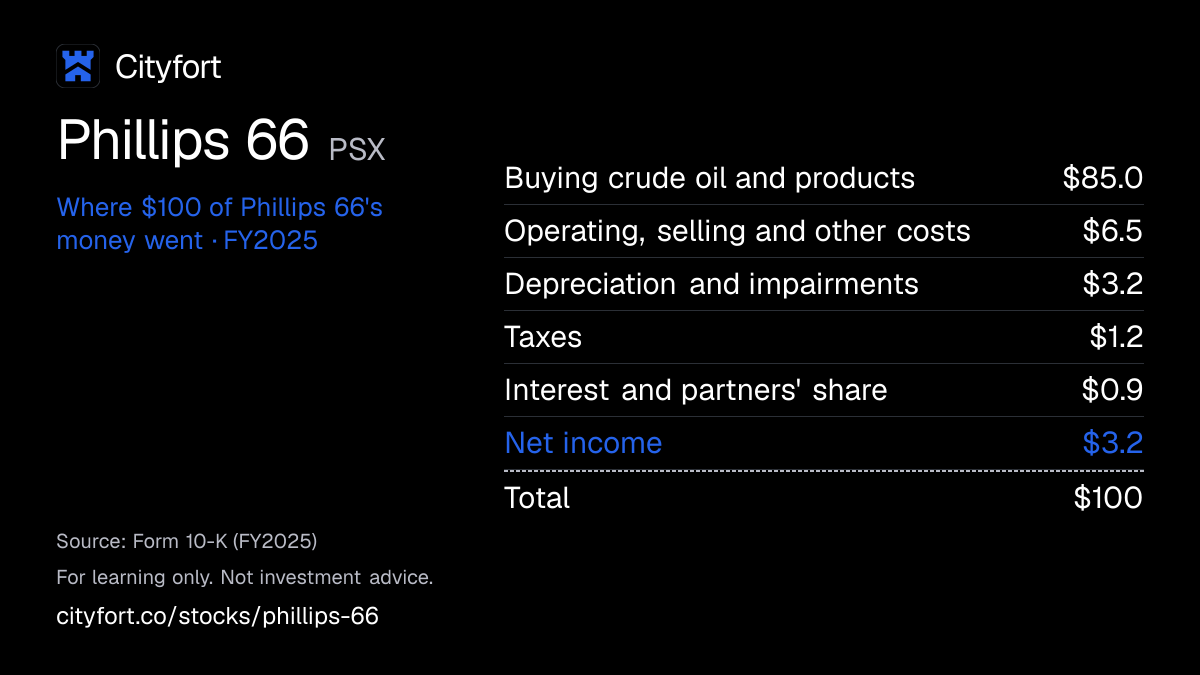
Where does $100 of Phillips 66's money go?
Phillips 66 · FY2025
Receipt for every $100
| Buying crude oil and products | $85.0 |
|---|---|
| Operating, selling and other costs | $6.5 |
| Depreciation and impairments | $3.2 |
| Taxes | $1.2 |
| Interest and partners' share | $0.9 |
| Net income | $3.2 |
| Total | $100 |
Each line = amount ÷ total money in × 100. Lines may not add to exactly $100 because of rounding.
How this is worked out
Cityfort calculation from the FY2025 10-K. Of every $100 that came in during FY2025: each line ÷ total revenues and other income of $136,560 million (sales of $132,376 million plus $4,184 million of affiliate earnings, asset-sale gains and other income). Net income includes $2,984 million of pre-tax gains on asset sales.
Save this receipt as an image
Embed this receipt or the key numbers
Paste this code into a blog or website to show the card you choose, with a link back to this page.
Each week: the next company due to report earnings, explained in 5 points.
No tips. Unsubscribe anytime.
We'll send a confirmation email. See our privacy policy.
02The business in one line
What does Phillips 66 do?
Fuel, crude oil and NGL buyers pay Phillips 66; in FY2025, $85 of every $100 that came in went on buying crude oil and products, and $3.2 was left as net income.
- Gasoline, diesel, jet fuel and renewable fuels brought in $97,359 million of the $132,376 million of FY2025 sales.
- Refining lost $274 million before tax in FY2025, while Midstream pipelines and NGL plants earned $2,817 million.
- FY2025 net income of $4,403 million includes $2,984 million of pre-tax gains on asset sales.
03Who pays it
Who pays Phillips 66?
Phillips 66 does not disclose how much each type of customer pays.
Fuel buyers
Stations, wholesale marketers, airlines and businesses buying gasoline, diesel and jet fuel. About 7,620 branded outlets in 48 states and about 800 Phillips 66-branded aviation locations carry its brands.
Crude oil buyers
Other buyers of crude oil that Phillips 66 resells: $15,183 million of FY2025 revenue.
NGL and gas buyers, and pipeline shippers
Buyers of natural gas liquids and gas ($17,066 million in FY2025), plus companies that pay fees to move oil and fuel through its pipelines and terminals.
Where its revenue came from · FY2025
- United States78.8%
- United Kingdom10%
- Germany3.8%
- Other countries7.5%
How spread out the customers are
The FY2025 10-K names no customer that brings in 10% of revenue. It describes a broad national and international customer base.
Sources (1)
04How it makes money
How does Phillips 66 make money?
Refining profit rides on the gap between crude oil costs and fuel prices.
Phillips 66 earns the difference between what crude oil costs and what fuels sell for. Its realized refining margin fell from $17.26 a barrel in FY2023 to $10.88 in FY2025. Midstream pre-tax income stayed between $2,638 million and $2,819 million over FY2023 to FY2025.
Realized refining margin, dollars per barrel (company measure)
$17.3$10.9
FY2023 to FY2025
- Buys crude oil at market prices
- Refines it into gasoline, diesel and jet fuel
- Sells fuel through its brands and to wholesalers
- Keeps the gap between fuel prices and crude cost
- Pipelines and NGL plants add fee income
↺ Step 5 feeds back into step 1.
Sources (1)
05Business segments · FY2025
Which businesses make up Phillips 66?
Marketing and Specialties
63.3%Sells gasoline, diesel, jet fuel, lubricants and base oils. Its $4,500 million FY2025 pre-tax income came in a year it sold its Coop stake and 65% of Germany and Austria retail.
Revenue $83.7B ($83,740M) · Operating profit $4.5B ($4,500M)
Refining
20.3%Turns crude oil into fuels at 10 refineries. Most of its output goes to other segments: $48,027 million of FY2025 Refining sales were inside the company.
Revenue $26.9B ($26,872M) · Operating profit −$274M
Midstream
14%Pipelines, terminals and NGL plants. NGL earned $1,899 million and Transportation $918 million before tax in FY2025.
Revenue $18.6B ($18,577M) · Operating profit $2.8B ($2,817M)
Renewable Fuels
2.4%Renewable fuels from the Rodeo complex and the Humber refinery. It lost $380 million before tax in FY2025.
Revenue $3.2B ($3,150M) · Operating profit −$380M
Chemicals
0%The 50% CPChem stake. It is counted as an affiliate, so no sales appear; pre-tax income was $297 million in FY2025.
Revenue $0M · Operating profit $297M
Corporate and Other
0%Head-office and other costs not assigned to a segment.
Revenue $37M · Operating profit −$1.5B (−$1,540M)
How the mix changed
- Marketing and Specialties
- Refining
- Midstream
- Renewable Fuels
- Chemicals
- Corporate and Other
Revenue by segment, FY2023 to FY2025.
US$
See the numbers
Sources (1)
06The numbers · Consolidated · US$
How has Phillips 66 done?
Revenue
$132.4BFY2025
Revenue peaked at $169,990 million in FY2022 and fell in each of the next three years, to $132,376 million in FY2025.
US$
See the numbers
Net income
$4.4BFY2025
Net income fell from $11,024 million in FY2022 to $2,117 million in FY2024, then rose to $4,403 million in FY2025, a year with $2,984 million of pre-tax gains on asset sales.
US$
See the numbers
Net income for every $100 of revenue
$3.3FY2025
Net income per $100 of revenue was $3.3 in FY2025 and $6.5 in FY2022; annual EBITDA is pre-tax income plus interest and depreciation (Cityfort calculation from the 10-Ks).
Net margin: $ of net income per $100 of revenue
See the numbers
Free cash flow
$2.7BFY2025
Free cash flow, operating cash flow minus capital spending and investments, was $2,729 million in FY2025 and $8,925 million in FY2022 (Cityfort calculation from the 10-Ks).
US$ · cash from operations minus spending on plants and equipment
See the numbers
See all yearly numbers
EBITDA here = operating income plus depreciation and amortization (from the cash flow statement). Fiscal years are the company's own: Fiscal year ends Dec 31 (the calendar year). Net income is the share belonging to the company's owners.
Learn: Fiscal years that don't end in December: Nvidia's FY2027 explained · Stock-based compensation and dilution: pay that becomes shares
Sources (20)
- Form 10-K for FY2021
- Form 10-K for FY2023
- Form 10-K for FY2022
- Form 10-K for FY2024
- Form 10-K for FY2025
- Form 10-Q for Q1 FY2024
- Form 10-Q for Q2 FY2024
- Form 10-Q for Q3 FY2024
- Form 10-Q for Q1 FY2025
- Q1 2025 earnings release (8-K Ex. 99.1)
- Form 10-Q for Q2 FY2025
- Q2 2025 earnings release (8-K Ex. 99.1)
- Form 10-Q for Q3 FY2025
- Q3 2025 earnings release (8-K Ex. 99.1)
- Form 10-Q for Q1 FY2026
- Q1 2026 earnings release (8-K Ex. 99.1)
- Form 10-Q for Q2 FY2026
- Q2 2026 earnings release (8-K Ex. 99.1)
- Form 10-Q for Q3 FY2026
- Q3 2026 earnings release (8-K Ex. 99.1)
07Who runs it
Who runs Phillips 66, and did they deliver?
Mark E. Lashier
Chairman and Chief Executive Officer · since 2022
CEO since Jul 2022 and Chairman since May 2024; earlier CEO of CPChem from 2017 to 2021.
Kevin J. Mitchell
Executive Vice President and Chief Financial Officer · since 2016
Donald A. Baldridge
Executive Vice President, Midstream and Chemicals · since 2024
Richard G. Harbison
Executive Vice President, Refining · since 2022
Retiring effective Dec 31, 2026, per an 8-K filed Oct 5, 2026.
Brian M. Mandell
Executive Vice President, Marketing and Commercial · since 2019
Vanessa L. Allen Sutherland
Executive Vice President, Government Affairs, General Counsel and Corporate Secretary · since 2022
Ann M. Kluppel
Senior Vice President and Controller · since 2024
What they said, and what happened
4 too early to tell
Said on Feb 20, 2026
Cut total debt to $17 billion by the end of 2027.
Too early to tellWhat happened
Total debt was $18,530 million at Sep 30, 2026, against $19,716 million at Dec 31, 2025.
Said on Feb 20, 2026
Keep the refining clean product yield above 86% annually through 2027.
Too early to tellWhat happened
The yield was 87% in 2025 and 86% in Q3 FY2026.
Said on Feb 20, 2026
Return more than 50% of operating cash flow, excluding working capital, to shareholders through 2027.
Too early to tellWhat happened
In Q3 FY2026 it returned $2,777 million through buybacks and dividends; operating cash flow excluding working capital was $6,185 million.
Said on Feb 20, 2026
Keep capital spending and investments at about $2.5 billion a year through 2027.
Too early to tellWhat happened
Spending was $2,233 million in 2025. In its Oct 28, 2026 10-Q the company said 2027 spending is expected to exceed this target.
08What could go wrong
What could go wrong for Phillips 66?
- Raw-material prices
Refining results swing with fuel margins
Refining earned $5,340 million before tax in FY2023, then lost $365 million in FY2024 and $274 million in FY2025. It earned $6,031 million in Q3 FY2026.
Watch Realized refining margin and Refining pre-tax income each quarter.
- Legal
$833 million Propel Fuels judgment under appeal
Propel Fuels alleged that Phillips 66 Company misappropriated its trade secrets. A California court entered an $833 million judgment in Aug 2025, and 10% post-judgment interest is accruing. The company denies wrongdoing and appealed in Nov 2025.
Watch The California First District Court of Appeal decision.
- Regulation
Environmental enforcement at refineries
In its Q3 FY2026 10-Q (Oct 28, 2026), Phillips 66 said it expects a civil penalty and injunctive relief from talks with the DOJ and EPA over alleged Clean Air Act violations at four refineries.
Watch Whether a consent decree is lodged, and its terms.
- Debt
Debt and a lower credit rating
Moody's cut its rating to Baa1 from A3 in Sep 2025. Total debt was $18,530 million at Sep 30, 2026; the 10-K says a cut below investment grade would raise borrowing costs.
Watch Total debt each quarter against the $17 billion target, and any rating action.
- Execution
Renewable fuels losses
Renewable Fuels lost $198 million before tax in FY2024 and $380 million in FY2025, before earning $544 million in Q2 FY2026.
Watch Renewable Fuels pre-tax income and output each quarter.
- Raw-material prices
Chemicals earnings follow plastics margins
Chemicals pre-tax income fell to $297 million in FY2025 from $876 million in FY2024. The HDPE chain margin, a plastics benchmark, fell to 7.1 cents a pound from 17.7.
Watch CPChem results, and full operations at its two new polymer plants, which Phillips 66's Q3 2026 earnings release (Oct 28, 2026) says are expected in 2027.
- Competition
Better-resourced competitors
The FY2025 10-K says competitors that produce their own feedstocks, have more retail outlets or greater financial resources may have an advantage.
Watch Refining utilization against the target of above the industry average.
09Supporters vs. critics
What do supporters and critics point to?
What supporters point to
- Midstream pre-tax income stayed between $2,638 million and $2,819 million each year from FY2023 to FY2025.
- Dividends per share rose every year, from $3.62 in FY2021 to $4.75 in FY2025.
- Q3 FY2026 net income was $5,616 million, against $133 million in Q3 FY2025.
- Total debt fell to $18,530 million at Sep 30, 2026, from $19,716 million at Dec 31, 2025.
- It bought the Coastal Bend NGL system in Apr 2025 and the other 50% of the WRB refineries in Oct 2025.
What critics point to
- Revenue fell in each year from $169,990 million in FY2022 to $132,376 million in FY2025.
- Refining lost money before tax in FY2024 ($365 million) and FY2025 ($274 million).
- FY2025 net income of $4,403 million included $2,984 million of pre-tax gains on asset sales; adjusted earnings were $2,632 million.
- Moody's cut its rating to Baa1 from A3 in Sep 2025.
- Propel Fuels alleged trade-secret misappropriation and won an $833 million judgment in Aug 2025; Phillips 66 denies wrongdoing and has appealed.
10What to watch next
What should you watch next at Phillips 66?
Next event
Q4 FY2026 results
Feb 4, 2027
Expected, based on last year's date
Refining results each quarter
Refining lost $274 million before tax in FY2025 and earned $6,031 million in Q3 FY2026; the realized refining margin shows how wide the crude-to-fuel gap was.
Debt against the company's own target
In its FY2025 10-K (Feb 20, 2026) Phillips 66 said it aims to cut total debt to $17 billion by the end of 2027; it was $18,530 million at Sep 30, 2026.
The Propel Fuels appeal
The California First District Court of Appeal has not yet ruled on the $833 million judgment, on which 10% post-judgment interest is accruing.
New volumes from NGL and chemicals projects
The company said in its Q3 FY2026 release that Coastal Bend expansion volumes start in Q4 2026 and CPChem expects full operations at two new polymer plants in 2027.
11Key dates
What are the key dates for Phillips 66?
| Event | Date | Source |
|---|---|---|
| Executive Vice President, Refining, Richard Harbison retires | 8-K Item 5.02: EVP Refining retirement notice | |
| Receivables securitization facility maturesThe committed amount rose to $2 billion from $1.75 billion on Aug 20, 2026. | 8-K Item 1.01: receivables securitization amendment | |
| $5 billion revolving credit facility matures | Form 10-K for FY2025 |
Learn: What is an 8-K? A company's news report, with a real Adobe filing
12Key facts
Key facts about Phillips 66
- What does Phillips 66 do?
- Phillips 66 refines crude oil into gasoline, diesel and jet fuel at 10 refineries in the US and Europe, sells fuel under the Phillips 66, Conoco and 76 brands, and runs pipelines and NGL plants. It also owns 50% of Chevron Phillips Chemical. Phillips 66 had about 12,600 employees at Dec 31, 2025.
- How does Phillips 66 make money?
- Phillips 66 buys crude oil and sells the fuels made from it, keeping the gap between the two prices, and earns fees from its pipelines and NGL plants. In FY2025 Marketing and Specialties earned $4,500 million and Midstream $2,817 million before tax, while Refining lost $274 million.
- Who are Phillips 66's customers?
- Phillips 66's FY2025 10-K names no customer that brings in 10% of revenue. Of FY2025 sales, refined products and renewable fuels were 73.5%, NGL and natural gas 12.9%, crude oil resales 11.5%, and services and other ($2,768 million) 2.1% (Cityfort calculation from the FY2025 10-K).
- How big is Phillips 66?
- Phillips 66 had sales and other operating revenues of $132,376 million and net income of $4,403 million in FY2025. In Q3 FY2026 it had revenue of $50,540 million and net income of $5,616 million.
- Is Phillips 66 profitable?
- Phillips 66 made a net profit in each year from FY2021 to FY2025. Net income was $11,024 million in FY2022, $2,117 million in FY2024 and $4,403 million in FY2025. FY2025 includes $2,984 million of pre-tax gains on asset sales; the company's adjusted earnings, which leave out special items such as these gains, were $2,632 million.
- Who owns Phillips 66?
- Phillips 66 has one class of common stock, with 400.98 million shares at Mar 20, 2026. Its 2026 proxy lists Vanguard at 12.9% (Sep 30, 2025), and BlackRock at 8.73% and State Street at 7.33% from filings of Jan 2024. Directors and executive officers together own less than 1%.
- How much does Phillips 66 pay in dividends and buybacks?
- Phillips 66 paid dividends of $4.75 a share in FY2025, up from $3.62 in FY2021. It bought back $1,207 million of its shares in FY2025 and $2,273 million in Q3 FY2026. In Oct 2026 it declared a quarterly dividend of $1.33 a share.
- How much debt does Phillips 66 have?
- Phillips 66 had total debt of $19,716 million and cash of $1,116 million at Dec 31, 2025. At Sep 30, 2026 total debt was $18,530 million and cash $5,848 million. The FY2025 10-K states ratings of Baa1 from Moody's and BBB+ from S&P.
- What is Chevron Phillips Chemical (CPChem) to Phillips 66?
- Phillips 66 owns 50% of Chevron Phillips Chemical, which makes olefins and polyolefins, the basic ingredients of plastics. CPChem is counted as an affiliate, and its sales are not in Phillips 66 revenue. The Chemicals segment earned $297 million before tax in FY2025.
Terms on this page
- Capital expenditures (capex)
- Debt-to-equity
- Earnings per share (EPS)
- EBITDA
- Free cash flow
- Net debt
- Net margin
- Revenue vs net income
- Stock buyback
Each explains the term in plain English, with the same number from other companies on Cityfort.
Go deeper
More detail from the same filings. Open any section.
13What it sells
13What it sells
What does Phillips 66 sell?
Fuels
Gasoline, diesel and jet fuel from 10 refineries in the US and Europe. Refined products and renewable fuels brought in $97,359 million in FY2025.
Natural gas liquids and pipelines
Natural gas liquids (NGLs) are liquids separated from natural gas. Phillips 66 gathers, processes, separates and ships them, and moves crude oil and fuel by pipeline for fees. NGL and natural gas sales were $17,066 million in FY2025.
Crude oil resales
Crude oil bought and sold on to other buyers: $15,183 million in FY2025.
Chemicals
A 50% stake in Chevron Phillips Chemical (CPChem), which makes olefins and polyolefins, the basic ingredients of plastics.
Renewable fuels
Fuels made from renewable feedstocks at the Rodeo complex in California and the Humber refinery in the UK. Output averaged 38 thousand barrels a day in FY2025.
Lubricants and base oils
Sold through the Marketing and Specialties segment alongside branded fuel.
Think of it like this
Like a bakery that buys flour at market prices and sells bread: its refining profit is the gap between the two prices.
What it does
- Does: Refines crude oil at 10 refineries in the US and Europe
- Does: Runs pipelines, terminals and NGL plants that earn fees
- Does: Supplies about 7,620 branded outlets in 48 states
What it does not do
- Does not: Does not pump crude oil: it was formed in 2012 from the downstream (refining and selling) businesses of ConocoPhillips
- Does not: Does not book its chemicals sales as revenue: CPChem is 50% owned and counted as an affiliate
- Does not: Does not own every refinery outright: it holds 18.75% of the MiRO refinery in Germany
Sources (2)
14How the money flows
14How the money flows · FY2025
How does money flow through Phillips 66?
Money in
- Sales and other operating revenues$132.4B
- Affiliates' earnings, asset-sale gains and other income$4.2B
The company
Phillips 66
$136.6B came in
Money out
- Crude oil and products bought$116.1B
- Operating, selling and other costs$8.9B
- Depreciation, impairments and accretion$4.4B
- Income tax and other taxes$1.7B
- Interest, and partners' share of profit$1.2B
- Net income for Phillips 66 shareholders$4.4B
- Phillips 66 took in $132,376 million from sales in FY2025, plus $4,184 million from affiliates, asset-sale gains and other income.
- Buying crude oil and products cost $116,093 million, by far the largest bill.
- Running refineries, pipelines and offices cost $8,859 million; depreciation and impairments took $4,358 million.
- Taxes took $1,683 million, interest $1,039 million and minority partners $125 million.
- That left $4,403 million of net income for Phillips 66 shareholders.
Sources (1)
15What it needs to run
15What it needs to run
What does Phillips 66 need to run?
Crude oil
Crude oil and products bought cost $116,093 million in FY2025, $85 of every $100 that came in.
Refineries
Crude capacity of 1,868 thousand barrels a day at the end of 2025; the refineries ran at 94% of capacity in FY2025.
Pipelines and NGL plants
Pipelines carried 3,023 thousand barrels a day in FY2025, and its plants separated 896 thousand barrels a day of NGLs.
People
About 12,600 employees at Dec 31, 2025.
Borrowing
Total debt of $19,716 million at Dec 31, 2025, rated Baa1 by Moody's and BBB+ by S&P.
Sources (1)
16Where it sells
16Where it sells · FY2025
Where does Phillips 66 sell?
- United States78.8%
- United Kingdom10%
- Germany3.8%
- Other countries7.5%
Sources (1)
17Competitors and what protects it
17Competitors and what protects it
Who does Phillips 66 compete with?
Marathon Petroleum
NYSE: MPC
Named in the 2025 peer group of Phillips 66's FY2025 10-K, which the company says closely aligns with its size and lines of business.
Valero Energy
Also in the 2025 peer group of Phillips 66's FY2025 10-K.
HF Sinclair
Also in the 2025 peer group of Phillips 66's FY2025 10-K.
ONEOK
Also in the 2025 peer group of Phillips 66's FY2025 10-K.
LyondellBasell Industries
Also in the 2025 peer group of Phillips 66's FY2025 10-K.
What protects the business
Each strength is scored 1 (weak) to 5 (strong) for the business, with the reason. It is not a rating of the share.
- Refining scale3 of 5
Ten refineries with 1,868 thousand barrels a day of crude capacity at the end of 2025, run at 94% of capacity in FY2025.
- Wellhead-to-market NGL chain3 of 5
Midstream gathers, processes, separates and ships NGLs; it earned $2,817 million before tax in FY2025.
- Fuel brands3 of 5
About 7,620 branded outlets in 48 states; Marketing sold 2,348 thousand barrels a day of fuel in FY2025.
Weak spot
Refining results swing with fuel margins
Refining earned $5,340 million before tax in FY2023, then lost $365 million in FY2024 and $274 million in FY2025.
Sources (1)
18Where growth could come from
18Where growth could come from
Where could Phillips 66's growth come from?
In its Q3 FY2026 10-Q, Phillips 66 said its targets through 2027 include cutting total debt to $17 billion and returning more than 50% of operating cash flow, excluding working capital, to shareholders. It said 2027 capital spending is expected to exceed its earlier target of about $2.5 billion.
NGL pipelines and plants
WorkingMidstream pre-tax income $2,817M in FY2025
Phillips 66 bought the Coastal Bend NGL system in Apr 2025 for $2.2 billion net of cash. The company said in its Q3 FY2026 release that expansion volumes start in Q4 2026, ramping to 350 thousand barrels a day in early 2027.
Status: Working, on track against what the company said.
Full ownership of the WRB refineries
WorkingRefining pre-tax income $6,031M in Q3 FY2026
It bought the other 50% of WRB (the Wood River and Borger refineries) on Oct 1, 2025. The company said in its Q3 FY2026 release that combining WRB with its other businesses had already brought more than $50 million of near-term benefits.
Status: Working, on track against what the company said.
New CPChem polymer plants
EarlyChemicals pre-tax income $297M in FY2025
The company said in its Q3 FY2026 release that CPChem expects full operations at its Golden Triangle (Texas) and Ras Laffan (Qatar) polymer projects in 2027.
Status: Early, too early to judge.
Renewable fuels
MixedPre-tax loss $380M in FY2025; income $191M in Q3 FY2026
Renewable Fuels lost money before tax in FY2024 and FY2025, then earned $544 million in Q2 FY2026 and $191 million in Q3 FY2026.
Status: Mixed, partly on track.
Western Gateway Pipeline
NewIn service expected 2029
Phillips 66 said in its Q3 FY2026 release it reached a final investment decision on the Western Gateway Pipeline system, which it expects in service in 2029. Its 10-Q gives a 49.9% stake.
Status: New, recently announced.
Status compares progress with what the company itself said it would do: Working = on track against what the company said; Mixed = partly on track; Behind = behind the company's own plan; New = recently announced; Early = too early to judge.
19The company's own measures (non-GAAP)
19The company's own measures · FY2025
What do Phillips 66's own measures show?
Official (GAAP): Net income attributable to Phillips 66, FY2025
$4.4B
Company's own measure: Adjusted earnings, FY2025
$2.6B
Phillips 66 leaves out items it labels special items.
Official (GAAP): Diluted earnings per share, FY2025
$10.79
Company's own measure: Adjusted earnings per share, FY2025
$6.44
Adjusted earnings divided by diluted shares, as the company reports it.
Official (GAAP): Net income attributable to Phillips 66, Q3 FY2026
$5.6B
Company's own measure: EBITDA, Q3 FY2026 (company measure)
$7.9B
The company adds income tax, net interest and depreciation to net income, including partners' share. The quarterly EBITDAOperating profit before wear-and-tear charges (depreciation and amortization). As a margin: per $100 of sales. in the numbers table is this figure.
Official (GAAP): Net income attributable to Phillips 66, Q3 FY2026
$5.6B
Company's own measure: Adjusted EBITDA, Q3 FY2026
$8.1B
Its EBITDA without special items, plus its share of affiliates' depreciation, minus partners' share.
Official (GAAP): Refining income per barrel, FY2025 ($)
−$0.4M
Company's own measure: Realized refining margin, FY2025 ($ per barrel)
10.9 $ per barrel
Both figures are per barrel, as defined in the FY2025 10-K.
These are the company's own measures, defined by the company. They are not comparable across companies, and they are not added together. Each sits beside the nearest official (GAAP) figure.
Learn: Non-GAAP measures: what a company's "adjusted" numbers leave out
20Financial strength and debt
20Financial strength · Dec 31, 2025
How much debt does Phillips 66 have?
- Total debt$19.7B
- Cash and investments$1.1B
- Net debt (debt minus cash)$18.6B
- Net worth (shareholders' money)$29.1B
- Debt to equity
- 0.68×
- $ of debt for every $1 of shareholders' money
- Total debt is short-term plus long-term debt from the FY2025 10-K ($1,038 million and $18,678 million); it includes $338 million of finance leases and leaves out operating lease liabilities.
- At Sep 30, 2026, total debt was $18,530 million and cash $5,848 million; the Q3 FY2026 earnings release states net debt of $12,682 million.
- Phillips 66 reported debt-to-capital of 39% at Dec 31, 2025; its credit agreements cap debt-to-capitalization at 65%.
- Debt due in 2026 to 2030: $1,038 million, $1,282 million, $1,319 million, $1,217 million and $1,192 million.
21Who owns it
21Who owns it · ownership as of Mar 20, 2026
Who owns Phillips 66?
Share classes
Holders of 5% or more
From the company's proxy statement (DEF 14A), later Schedule 13G filings and the share counts on its latest annual or quarterly report. Each holder row shows the date of its own filing.
Learn: How to read a proxy statement (DEF 14A): Nvidia's 2026 proxy · Form 4 insider filings: who files, the codes and the footnotes
22What it does with profit
22What it does with profit
What does Phillips 66 do with its profit?
Dividend per share
$4.75FY2025
Dividend paid for each share, by financial year.
$ per share
See the numbers
Buyback · Dec 31, 2022
FY2022: paid $1,513 million for its own shares.
$1.5B
Buyback · Dec 31, 2023
FY2023: paid $4,014 million for its own shares.
$4.0B
Buyback · Dec 31, 2024
FY2024: paid $3,451 million for its own shares.
$3.5B
Buyback · Dec 31, 2025
FY2025: paid $1,207 million for its own shares.
$1.2B
Buyback · Sep 30, 2026
Q3 FY2026: paid $2,273 million for its own shares.
$2.3B
23Governance signals
23Governance signals
What do Phillips 66's governance filings show?
- Auditor
- Ernst & Young LLP, since 2011
- Auditor changes
- None in the period covered
- Audit qualifications
- None reported
- Related-party dealings
- Phillips 66 buys from and sells to its equity affiliates, mainly CPChem and, until Oct 1, 2025, WRB Refining. Related-party receivables were $613 million at Dec 31, 2025.
- Credit rating
- Moody's and S&P Global Ratings (as stated in the FY2025 10-K) Baa1 (Moody's) / BBB+ (S&P) (outlook Stable), Feb 20, 2026
A credit rating describes the company's ability to repay debt. It is not a rating of the share.
Flags to know about
regulatory · Jan 20, 2026
Clean Water Act indictment: deferred prosecution agreement entered Jan 20, 2026
A November 2024 federal indictment alleged Clean Water Act violations at the Carson part of the Los Angeles Refinery. Under a Jan 20, 2026 Deferred Prosecution Agreement, Phillips 66 agreed to pay an $8 million penalty and update compliance policies and training.
regulatory · Oct 28, 2026
Talks with the DOJ and EPA on alleged Clean Air Act violations
The Q3 FY2026 10-Q says Phillips 66 is in discussions over alleged violations of chemical accident prevention rules at the Wood River, Borger, Ferndale and Carson refineries. It expects a civil penalty and injunctive relief; no consent decree has been lodged.
Sources (2)
24How it got here
24How it got here
How did Phillips 66 get here?
2012
Milestone
Split from ConocoPhillips
Incorporated in 2011. ConocoPhillips distributed all Phillips 66 shares to its own shareholders at the market close on Apr 30, 2012.
2023
Milestone
Bought out DCP Midstream public unitholders
In Jun 2023 it acquired the public units of DCP Midstream, LP, adding to its NGL business.
2024
Crisis
Jury verdict in the Propel Fuels case
On Oct 16, 2024 a jury returned a $604.9 million verdict against Phillips 66 Company; the company has appealed.
2025
Milestone
Coastal Bend NGL system bought
Acquired in Apr 2025 for $2.2 billion net of cash.
2025
Crisis
Moody's rating cut
Moody's lowered its rating to Baa1 from A3 in Sep 2025, with a stable outlook.
2025
Business-model change
Full ownership of two refineries
On Oct 1, 2025 it bought the other 50% of WRB (Wood River and Borger refineries) from Cenovus.
2025
Business-model change
Los Angeles refinery stops fuel production
Fuel production ended in Q4 2025. In Dec 2025 it also sold 65% of its Germany and Austria retail business.
2026
Milestone
Lindsey Oil Refinery assets bought
Phillips 66 bought the UK Lindsey Oil Refinery assets on Apr 28, 2026 for $115 million.
2026
Milestone
Western Gateway Pipeline approved
Reached a final investment decision in Q3 2026; service is expected in 2029.
25Sources and changes
Where every number on this page comes from
Sources (24 documents)
- S1Form 10-Q for Q3 FY2026 · SEC EDGAR · Tier 1: company or exchange filing · Oct 28, 2026
- S2Form 10-Q for Q2 FY2026 · SEC EDGAR · Tier 1: company or exchange filing · Aug 5, 2026
- S3Form 10-Q for Q1 FY2026 · SEC EDGAR · Tier 1: company or exchange filing · Apr 29, 2026
- S4Form 10-K for FY2025 · SEC EDGAR · Tier 1: company or exchange filing · Feb 20, 2026
- S5Form 10-Q for Q3 FY2025 · SEC EDGAR · Tier 1: company or exchange filing · Oct 29, 2025
- S6Form 10-Q for Q2 FY2025 · SEC EDGAR · Tier 1: company or exchange filing · Jul 28, 2025
- S7Form 10-Q for Q1 FY2025 · SEC EDGAR · Tier 1: company or exchange filing · Apr 25, 2025
- S8Form 10-K for FY2024 · SEC EDGAR · Tier 1: company or exchange filing · Feb 21, 2025
- S9Form 10-Q for Q3 FY2024 · SEC EDGAR · Tier 1: company or exchange filing · Oct 29, 2024
- S10Form 10-Q for Q2 FY2024 · SEC EDGAR · Tier 1: company or exchange filing · Jul 31, 2024
- S11Form 10-Q for Q1 FY2024 · SEC EDGAR · Tier 1: company or exchange filing · Apr 29, 2024
- S12Form 10-K for FY2023 · SEC EDGAR · Tier 1: company or exchange filing · Feb 21, 2024
- S13Form 10-K for FY2022 · SEC EDGAR · Tier 1: company or exchange filing · Feb 22, 2023
- S14Form 10-K for FY2021 · SEC EDGAR · Tier 1: company or exchange filing · Feb 18, 2022
- S15Definitive proxy statement (DEF 14A) 2026 · SEC EDGAR · Tier 1: company or exchange filing · Apr 2, 2026
- S16Q3 2026 earnings release (8-K Ex. 99.1) · SEC EDGAR · Tier 1: company or exchange filing · Oct 28, 2026
- S17Q2 2026 earnings release (8-K Ex. 99.1) · SEC EDGAR · Tier 1: company or exchange filing · Aug 5, 2026
- S18Q1 2026 earnings release (8-K Ex. 99.1) · SEC EDGAR · Tier 1: company or exchange filing · Apr 29, 2026
- S19Q4 2025 earnings release (8-K Ex. 99.1) · SEC EDGAR · Tier 1: company or exchange filing · Feb 4, 2026
- S20Q3 2025 earnings release (8-K Ex. 99.1) · SEC EDGAR · Tier 1: company or exchange filing · Oct 29, 2025
- S21Q2 2025 earnings release (8-K Ex. 99.1) · SEC EDGAR · Tier 1: company or exchange filing · Jul 25, 2025
- S22Q1 2025 earnings release (8-K Ex. 99.1) · SEC EDGAR · Tier 1: company or exchange filing · Apr 25, 2025
- S248-K Item 1.01: receivables securitization amendment · SEC EDGAR · Tier 1: company or exchange filing · Aug 21, 2026
- S258-K Item 5.02: EVP Refining retirement notice · SEC EDGAR · Tier 1: company or exchange filing · Oct 5, 2026
Changes to this page (v1 · Nov 20, 2026)
- v1 · Nov 20, 2026First version. (first version)
Numbers come only from tier 1 and tier 2 sources. Read how we research.
Disclaimer
For learning only. Cityfort is not a registered investment adviser or broker-dealer and does not recommend buying or selling any security. Prices shown are dated and may be out of date.
Investing in securities involves risk, including loss of capital. Before making any investment decision, do your own research and consider consulting a registered investment adviser or other qualified professional.
Cityfort, its owners and contributors may or may not hold securities of companies covered. Cityfort is not paid by any company it covers. Content is not an offer or solicitation to buy or sell any security, including in any initial public offering.
Read the positions policyRead the full disclaimerHide the full disclaimer
Cityfort publishes general educational content that explains how listed companies work. Cityfort is not registered with the US Securities and Exchange Commission or any state securities regulator as an investment adviser, and is not a broker-dealer or a member of FINRA. Cityfort does not provide investment, tax or legal advice, recommendations, ratings, price targets or any opinion on whether to buy, sell or hold any security. Nothing on the site is tailored to any person's circumstances.
All information is taken from publicly available sources, mainly company filings with the SEC, which are listed on each page with dates. We work to keep it accurate and correct errors publicly, but we do not guarantee that it is complete, accurate or up to date. Any market price or price-based ratio shown is dated, may be out of date by the time you read it, and is included only to explain concepts.
Statements by company management, including forward-looking statements and guidance, are reported as the company's statements, with their date and source; they are not our forecasts. Adjusted (non-GAAP) figures are the company's own measures and are shown next to the official (GAAP) figures.