Health Care · NYSE: RDY
Dr. Reddy's: how the business works
Dr. Reddy's, a drug maker based in Hyderabad, India, sells generic medicines, mostly in North America, and branded medicines in India and emerging markets, with revenue of INR 335,933 million in FY2026 (year ended Mar 31, 2026).
By Hardik Bhandare · Checked against filings: . Editorial policy. Corrections
Follow Dr. Reddy's
Email me when Dr. Reddy's's page is updated after earnings.
We'll send a confirmation email first. See our privacy policy.
Dr. Reddy's Laboratories Limited · Hyderabad, India · Founded 1984
Updated for Q2 FY2027 · checked
- Revenue, FY2026
- INR 335,933 million
- Profit for equity holders, FY2026
- INR 42,850 million
- Revenue, Q2 FY2027 (INR 88,051 million a year earlier)
- INR 86,708 million
- Employees, Mar 31, 2026
- 27,527
- Held by the two founding families and their trusts, Mar 31, 2026
- 26.63%
The short version
Dr. Reddy's in 5 points
1 · What it sells
Dr. Reddy's sells generic and branded medicines and drug ingredients; its Global Generics segment brought in INR 299,033 million of FY2026 revenue of INR 335,933 million.
2 · Who pays it
North America paid 33.9% of FY2026 revenue, India 18.5%, Europe 16.5%, Russia 10.4%, other CIS countries and Romania 2.7%, the rest of the world 7.1%, ingredient and service buyers 10.4% and others 0.6%.
3 · What it keeps from INR 100
Of every INR 100 that came in during FY2026, including INR 12,277 million of other income, net finance income, its share of associates' profit and the minority partner's losses, Dr. Reddy's kept INR 12.3 as profit; operating profit, which included one-off trademark and settlement gains, was INR 15.0 per INR 100 of revenue.
4 · Where the operating profit comes from
Dr. Reddy's reports segment profit only down to gross profit: Global Generics earned INR 169,698 million of FY2026's INR 177,264 million, PSAI INR 5,984 million and Others INR 1,582 million.
5 · The one thing to watch
North America revenue was INR 24,890 million in Q2 FY2027, against INR 32,408 million a year earlier, while emerging markets revenue rose to INR 20,595 million from INR 16,548 million.
Sources: From Dr. Reddy's Form 20-Fs for FY2022 to FY2026 and its Form 6-K results · checked
01Where the money goes · FY2026
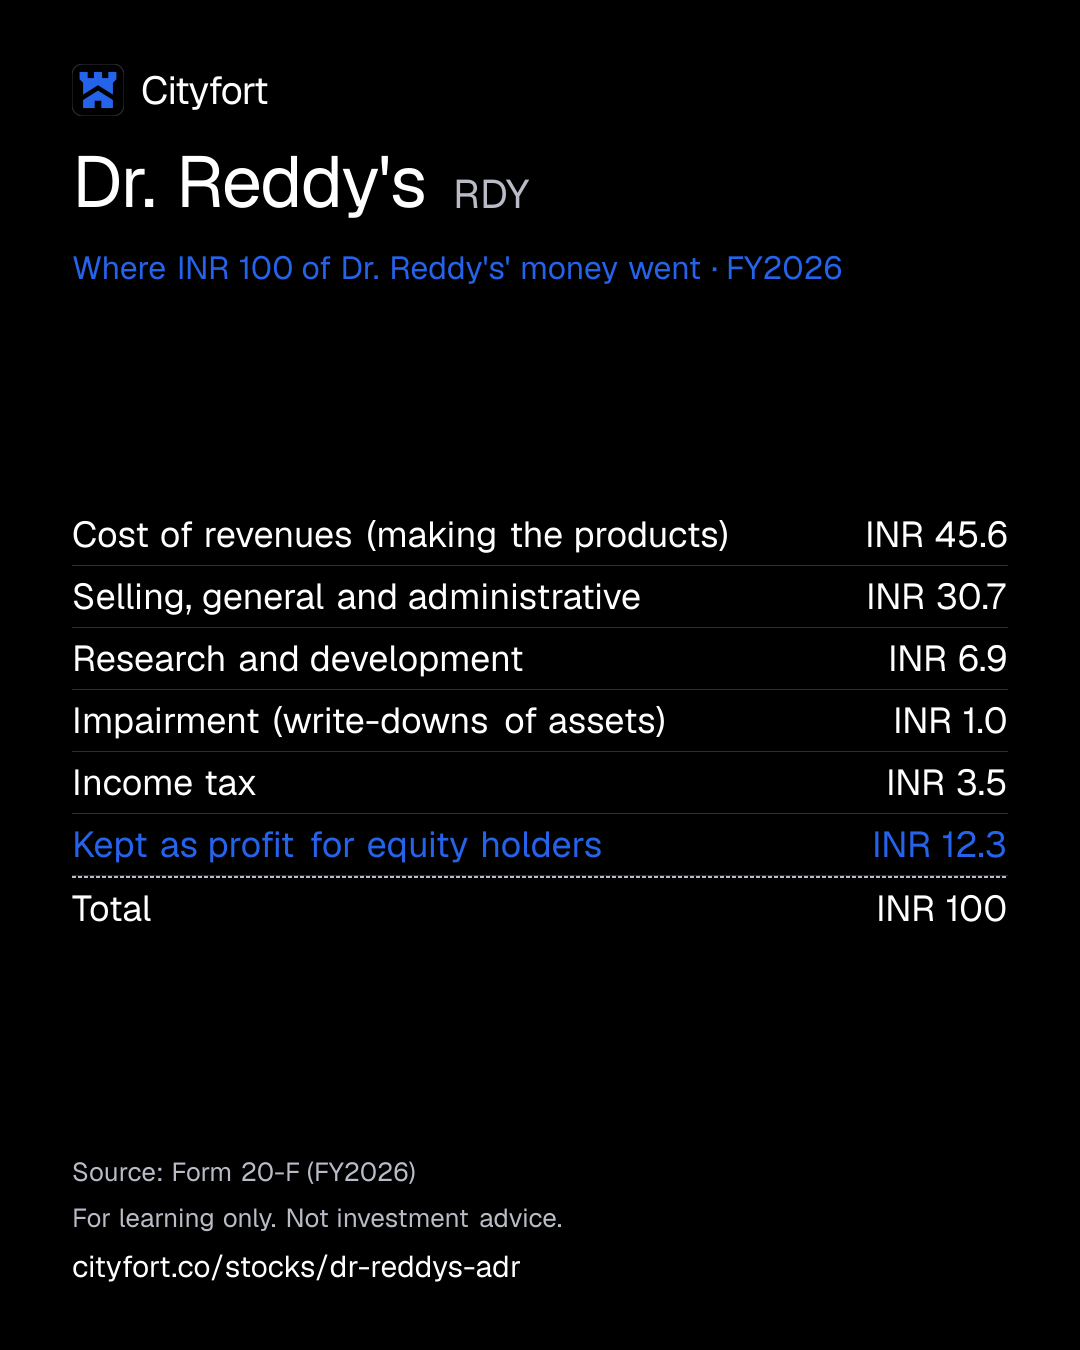
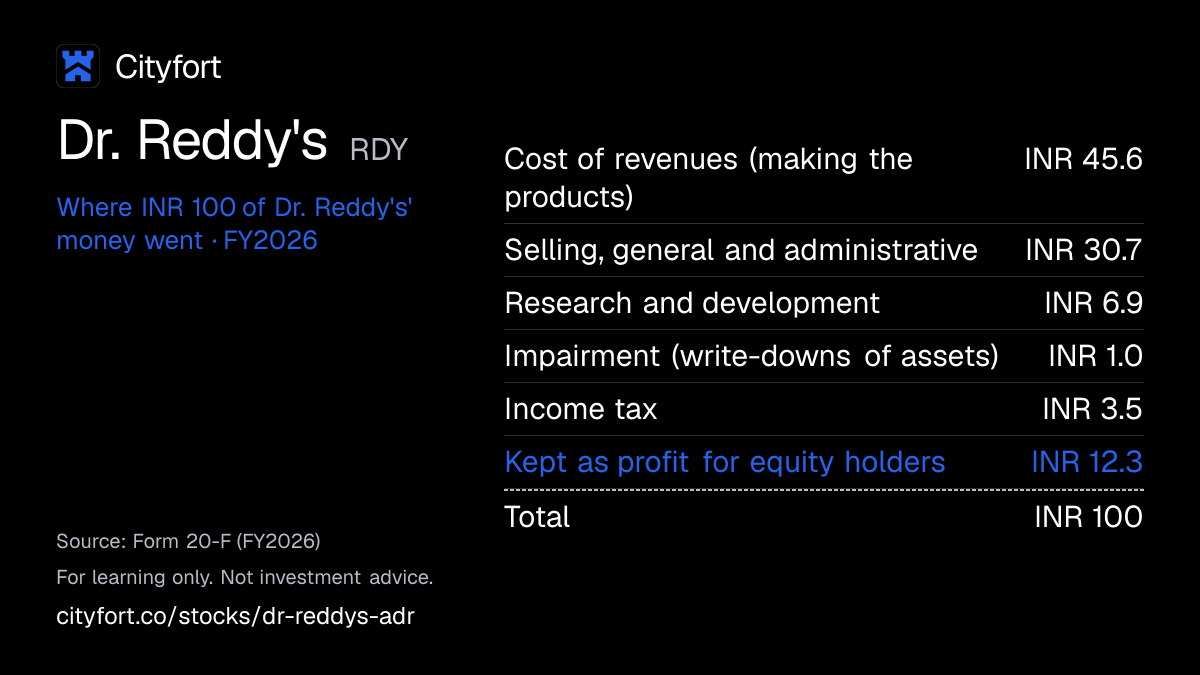
Where does INR 100 of Dr. Reddy's' money go?
Dr. Reddy's · FY2026
Receipt for every INR 100
| Cost of revenues (making the products) | INR 45.6 |
|---|---|
| Selling, general and administrative | INR 30.7 |
| Research and development | INR 6.9 |
| Impairment (write-downs of assets) | INR 1.0 |
| Income tax | INR 3.5 |
| Kept as profit for equity holders | INR 12.3 |
| Total | INR 100 |
Each line = amount ÷ total money in × 100. Lines may not add to exactly INR 100 because of rounding.
How this is worked out
Cityfort calculation from the FY2026 20-F. Of every INR 100 that came in during FY2026 (revenue of INR 335,933 million plus INR 12,277 million of other income, finance income, share of associates' profit and the minority partner's INR 384 million share of losses): each line = line ÷ INR 348,210 million × 100.
Save this receipt as an image
Embed this receipt or the key numbers
Paste this code into a blog or website to show the card you choose, with a link back to this page.
Each week: the next company due to report earnings, explained in 5 points.
No tips. Unsubscribe anytime.
We'll send a confirmation email. See our privacy policy.
02The business in one line
What does Dr. Reddy's do?
Wholesalers, pharmacy chains and hospitals pay Dr. Reddy's for medicines; after costs and tax, it kept INR 12.3 of every INR 100 that came in during FY2026 as profit.
- North America brought in 33.9% of FY2026 revenue, down from 44.6% in FY2025, after sales there fell 22% (Cityfort calculation from the FY2026 20-F).
- Revenue rose 3% to INR 335,933 million in FY2026, while profit for equity holders fell from INR 56,544 million to INR 42,850 million.
03Who pays it
Who pays Dr. Reddy's?
North America
33.9%
of revenue
Mostly retail chains, wholesalers and private-label customers. Revenue was INR 113,737 million in FY2026, down 22% from FY2025.
India
18.5%
of revenue
Sold through agents to about 6,500 wholesalers, who sell on to retailers. Revenue was INR 62,186 million, up 16%.
Europe
16.5%
of revenue
Revenue was INR 55,501 million, up 55%, including INR 28,189 million from the nicotine replacement brands bought from Haleon.
Russia
10.4%
of revenue
Revenue was INR 34,786 million in FY2026.
Other CIS countries and Romania
2.7%
of revenue
Revenue was INR 9,074 million in FY2026.
Rest of the world
7.1%
of revenue
Revenue was INR 23,749 million in FY2026.
Drug makers buying ingredients and services (PSAI)
10.4%
of revenue
External revenue was INR 34,773 million, not counting INR 7,270 million sold to Dr. Reddy's own Global Generics unit.
Others
0.6%
of revenue
INR 2,127 million, mainly from Aurigene Oncology, a drug-discovery subsidiary, and proprietary products.
- North America33.9%
- India18.5%
- Europe16.5%
- Russia10.4%
- Other CIS countries and Romania2.7%
- Rest of the world7.1%
- Drug makers buying ingredients and services (PSAI)10.4%
- Others0.6%
How spread out the customers are
Shares are of FY2026 revenue by market (Cityfort calculation from the FY2026 20-FThe annual report a foreign company listed in the US files with the SEC, in place of a 10-K. Learn more). In North America, most revenue comes from retail chains, wholesalers and private-label customers; in India, Dr. Reddy's sells to about 6,500 wholesalers.
04How it makes money
How does Dr. Reddy's make money?
Dr. Reddy's earns almost all of its gross profit from finished medicines, and its operating profit per INR 100 of revenue fell from INR 22.1 in FY2025 to INR 15.0 in FY2026.
Global Generics earned INR 169,698 million of FY2026's INR 177,264 million of gross profit, and PSAI INR 5,984 million. Operating profit per INR 100 of revenue ranged from INR 13.7 to INR 24.3 between FY2022 and FY2026.
Operating profit per INR 100 of revenue
INR 22.1INR 15.0
FY2025 to FY2026
- It applies to sell copies of medicines as patents expire: 80 US applications were pending at Sep 30, 2026
- The first approved copy usually wins a large share; as rivals arrive, sales and gross profit typically decline, the 20-F says
- Branded businesses in India, emerging markets and the nicotine brands made 53% of Q2 FY2027 revenue, by the company's count
- Operating profit was INR 15.0 per INR 100 of revenue in FY2026
- Cash from operations, INR 56,755 million in FY2026, pays for factories, product rights, dividends and acquisitions
↺ Step 5 feeds back into step 1.
05Business segments · FY2026
Which businesses make up Dr. Reddy's?
Global Generics
89%Finished medicines in all markets, including biosimilars and the nicotine brands. Segment gross profit was INR 169,698 million, 56.7% of its revenue.
Revenue INR 299,033M
PSAI (drug ingredients and services)
10.4%Active ingredients and contract research and manufacturing. Segment gross profit was INR 5,984 million, 17.2% of its revenue, against 27.1% in FY2025.
Revenue INR 34,773M
Others
0.6%Aurigene Oncology, a drug-discovery subsidiary, and proprietary products. Segment gross profit was INR 1,582 million.
Revenue INR 2,127M
How the mix changed
- Global Generics
- PSAI (drug ingredients and services)
- Others
Revenue by segment, FY2024 to FY2026.
INR million
See the numbers
06The numbers · Consolidated · INR million
How has Dr. Reddy's done?
Dr. Reddy's files a Form 20-F each year and furnishes quarterly results on Form 6-KHow a foreign company listed in the US furnishes the SEC with reports it publishes at home, such as quarterly results. It is not a 10-Q. Learn more, as a foreign private issuerA non-US company that the SEC lets file a 20-F instead of a 10-K. It files no US proxy statement. Learn more. Its financial statements follow IFRSInternational Financial Reporting Standards: accounting rules set by the International Accounting Standards Board. The SEC accepts them from foreign companies in place of US GAAP. (International Financial Reporting Standards, as issued by the IASB) and are reported in Indian rupees, shown here as filed in INR million (not converted to dollars). Quarterly figures: IFRS as issued by the IASB, in INR, from the quarterly results furnished on Form 6-K; unaudited, with a limited review by the auditors.
Dr. Reddy's 20-F uses IFRS as issued by the IASB, in Indian rupees, so amounts show in INR million as filed, never converted. EPS reflects the five-for-one split of October 2024; no comparable FY2022 EPS is filed, so that year is blank.
Revenue
INR 335,933MFY2026
Revenue rose every year from INR 214,391 million in FY2022 to INR 335,933 million in FY2026; Q2 FY2027 revenue was 1.5% below a year earlier.
INR million
See the numbers
Net income
INR 42,850MFY2026
Profit for equity holders was INR 42,850 million in FY2026, down from INR 56,544 million; Q4 FY2026, at INR 2,201 million, was the lowest of the eight quarters shown and included a lenalidomide claim of INR 4,530 million against revenue.
INR million
See the numbers
Net income for every INR 100 of revenue
INR 12.8FY2026
EBITDA per INR 100 of revenue ranged from INR 19.3 to INR 29.6 between FY2022 and FY2026; EBITDA here is a Cityfort calculation from the Form 20-Fs (operating profit plus depreciation and amortization) and differs from the company's own EBITDA (FY2026: INR 76,595 million).
Net margin: INR of net income per INR 100 of revenue
See the numbers
Free cash flow
INR 33,429MFY2026
Free cash flow (cash from operations minus spending on property, plant and equipment) was INR 33,429 million in FY2026; it leaves out the INR 15,099 million spent on product rights and other intangible assets.
INR million · cash from operations minus spending on plants and equipment
See the numbers
See all yearly numbers
EBITDA here = operating income plus depreciation and amortization (from the cash flow statement). Fiscal years are the company's own: Mar 31 (fiscal 2026 = Apr 1, 2025 to Mar 31, 2026). EPS is per equity share, as filed. One American depositary share (ADS) represents one equity share. J.P. Morgan Chase Bank, N.A. is the depositary, and the ADSs trade on the New York Stock Exchange. So earnings per ADS equal earnings per share. Net income is the share belonging to the company's owners.
Learn: Fiscal years that don't end in December: Nvidia's FY2027 explained · Stock-based compensation and dilution: pay that becomes shares
Sources (11)
- Form 20-F for FY2022 (year ended March 31, 2022)
- Form 20-F for FY2023 (year ended March 31, 2023)
- Form 20-F for FY2025 (year ended March 31, 2025)
- Form 20-F for FY2026 (year ended March 31, 2026)
- Form 6-K: Q3 FY2026 results under IFRS (Exhibit 99.2)
- Form 6-K: Q4 FY2026 results under IFRS (Exhibit 99.3)
- Form 6-K: Q1 FY2026 earnings release (Exhibit 99.2)
- Form 6-K: Q1 FY2026 results under IFRS (Exhibit 99.3)
- Form 6-K: Q2 FY2027 results under IFRS (Exhibit 99.3)
- Form 6-K: Q2 FY2027 earnings release (Exhibit 99.2)
- Form 6-K: Q4 FY2026 earnings release (Exhibit 99.2)
07Who runs it
Who runs Dr. Reddy's, and did they deliver?
K. Satish Reddy
Chairman
A trustee of the VSD Family Trust, which held 9.06% of shares at Mar 31, 2026.
G.V. Prasad
Co-Chairman and Managing Director
A trustee of the GVP Family Trust, which held 11.51% of shares at Mar 31, 2026.
Erez Israeli
Chief Executive Officer
Holds options on ADSsA certificate a US bank (the depositary) issues for shares of a foreign company that it holds. It trades in US dollars on a US exchange, and one may stand for more than one share. Learn more, according to Item 6.E of the FY2026 20-F.
M.V. Narasimham
Chief Financial Officer
Named as Chief Financial Officer in the FY2026 20-F.
What they said, and what happened
1 too early to tell
Said on May 12, 2026
G.V. Prasad said in the Q4 FY2026 release: "We remain focused on strengthening our base business and improving margins, through cost efficiencies and portfolio optimization."
Too early to tellWhat happened
The statement names no target or date. Operating margin was 4.7% in Q1 FY2027 and 14.6% in Q2 FY2027, against 1.8% in Q4 FY2026 and 19.9% in Q2 FY2026 (Cityfort calculation from the Form 6-K results).
08What could go wrong
What could go wrong for Dr. Reddy's?
- Concentration
A few products can move results
The 20-F says a limited number of products may account for a significant portion of revenue. North America revenue fell 22% in FY2026, which the company linked mainly to lower lenalidomide sales and a one-time claim.
Watch North America revenue each quarter: INR 24,890 million in Q2 FY2027, against INR 32,408 million a year earlier.
- Pricing
Falling prices for US generics
The 20-F says new manufacturers keep entering the US generic market, which may further lower its pricing power. Price changes cut Global Generics revenue by about 10% in FY2026, including the lenalidomide claim.
Watch Price, volume and new-product effects in the next 20-F's segment review.
- Regulation
Manufacturing and quality
Semaglutide batches found out of specification led to an INR 2,397 million provision in Q1 FY2027. A separate Canada recall reduced Q2 FY2027 revenue by INR 710 million, booked as expected returns.
Watch Results of the US FDA inspections at the two Indian sites, reported in the 6-K releases.
- Other
Business in Russia
Russia brought in INR 34,786 million, 10.4% of FY2026 revenue. Dr. Reddy's booked INR 1,836 million in FY2026 after a Federal Tax Service VAT audit of one of its foreign subsidiaries. It believes "the likelihood of any further liability that may arise on account of this field tax audit is not probable".
Watch Russia's revenue and the company's notes on geopolitical conflicts in each 6-K.
- Currency
Rupee and other currencies
Much of Dr. Reddy's revenue is in US dollars, euros, rubles, pounds and Brazilian reals, while much of its costs are in rupees, the 20-F says. FY2026 revenue rose 3% as reported but fell 2% excluding currency moves.
Watch Reported growth against growth excluding currency moves in each 20-F.
- Regulation
US drug pricing rules and tariffs
The 20-F says US drug pricing changes, including most-favored-nation requirements, and tariffs could hurt its prices and costs. North America brought in 33.9% of FY2026 revenue.
Watch US pricing and tariff rules and the company's comments on them in its 6-K releases.
- Legal
US price-fixing lawsuits
Lawsuits combined in a Philadelphia federal court since 2016 allege that certain US generic makers conspired on prices from about 2009. Dr. Reddy's US subsidiary is a defendant; the company believes the claims are "without merit", denies any wrongdoing and has made no provision.
Watch Test trials expected in late 2026 or 2027, the 20-F says; in two of them the subsidiary is named for three drugs in total.
- Governance
Two families' influence
The founding families and their trusts held 26.63% of shares at Mar 31, 2026. The 20-F says their influence could delay or prevent a change in control.
Watch The families' holding in the next 20-F and any Schedule 13D amendment.
Sources (6)
- Form 20-F for FY2026 (year ended March 31, 2026)
- Form 6-K: Q4 FY2026 earnings release (Exhibit 99.2)
- Form 6-K: Q2 FY2027 earnings release (Exhibit 99.2)
- Form 6-K: Q2 FY2027 results under IFRS (Exhibit 99.3)
- Form 6-K: Q4 FY2026 results under IFRS (Exhibit 99.3)
- Schedule 13D/A (Amendment No. 6) by G.V. Prasad, K. Satish Reddy and family trusts
09Supporters vs. critics
What do supporters and critics point to?
What supporters point to
- Dr. Reddy's was profitable in every year from FY2022 to FY2026, with profit for equity holders of INR 42,850 million in FY2026.
- Revenue rose every year from FY2022 to FY2026, from INR 214,391 million to INR 335,933 million.
- India revenue grew 17% and emerging markets revenue 24% year on year in Q2 FY2027.
- At Sep 30, 2026, cash and current investments of INR 76,242 million were more than borrowings, not counting leases, of INR 58,260 million.
- 80 US applications were waiting for approval at Sep 30, 2026, by the company's count.
What critics point to
- North America revenue fell 22% in FY2026 and 23% year on year in Q2 FY2027.
- Profit for equity holders was INR 9,250 million in Q2 FY2027, against INR 14,372 million a year earlier.
- Operating profit per INR 100 of revenue was INR 15.0 in FY2026, down from INR 24.3 in FY2024.
- Borrowings including leases rose from INR 46,766 million to INR 77,341 million during FY2026.
- Out-of-specification semaglutide batches led to an INR 2,397 million provision in Q1 FY2027.
10What to watch next
What should you watch next at Dr. Reddy's?
Next event
Q3 FY2027 results (quarter ending Dec 31, 2026)
Date not announced yet.
North America after lenalidomide
North America revenue was INR 24,890 million in Q2 FY2027, up from INR 22,048 million in Q1 FY2027 and down from INR 32,408 million a year earlier.
Semaglutide
Generic semaglutide was approved in 10 countries by Oct 23, 2026. The Q1 FY2027 provision was INR 2,397 million and the Q2 FY2027 Canada recall INR 710 million.
Margins
Operating profit per INR 100 of revenue was INR 14.6 in Q2 FY2027, against INR 19.9 a year earlier and INR 1.8 in Q4 FY2026.
11Key dates
What are the key dates for Dr. Reddy's?
| Event | Date | Source |
|---|---|---|
| Fiscal 2027 endsDr. Reddy's fiscal year runs from Apr 1 to Mar 31. | Form 20-F for FY2026 (year ended March 31, 2026) |
Learn: Fiscal years that don't end in December: Nvidia's FY2027 explained
12Key facts
Key facts about Dr. Reddy's
- What does Dr. Reddy's do?
- Dr. Reddy's Laboratories is an Indian drug maker based in Hyderabad. It makes and sells generic and branded medicines and the active ingredients used in medicines, and had 27,527 employees at Mar 31, 2026.
- How does Dr. Reddy's make money?
- Dr. Reddy's earns most of its money selling finished medicines: its Global Generics segment brought in INR 299,033 million of FY2026 revenue of INR 335,933 million. Drug ingredients and contract services (its PSAI segment) brought in INR 34,773 million.
- Who are Dr. Reddy's customers?
- In North America, Dr. Reddy's sells mostly to retail chains, wholesalers and private-label customers, its FY2026 20-F says; in India it sells to about 6,500 wholesalers. North America paid 33.9% of FY2026 revenue and India 18.5% (Cityfort calculation from the FY2026 20-F).
- How big is Dr. Reddy's?
- Dr. Reddy's had revenue of INR 335,933 million and profit for equity holders of INR 42,850 million in FY2026 (year ended Mar 31, 2026), with 27,527 employees at Mar 31, 2026.
- Is Dr. Reddy's profitable?
- Yes. Dr. Reddy's profit for equity holders was INR 42,850 million in FY2026, INR 12.8 for every INR 100 of revenue, and it was profitable in every year from FY2022 to FY2026.
- What is a Dr. Reddy's ADS?
- A Dr. Reddy's American depositary share (ADS) trades on the New York Stock Exchange under the ticker RDY. Each ADS represents one Dr. Reddy's equity share, held by the depositary, J.P. Morgan Chase Bank, N.A., according to the FY2026 20-F.
- Who owns Dr. Reddy's?
- The families of Chairman K. Satish Reddy and Co-Chairman G.V. Prasad, with their family trusts, held 26.63% of Dr. Reddy's shares at Mar 31, 2026, according to the FY2026 20-F. Life Insurance Corporation of India and its associates held 12.16%.
- Does Dr. Reddy's have debt?
- Dr. Reddy's had borrowings of INR 58,260 million, not counting lease liabilities of INR 14,027 million, at Sep 30, 2026, against cash and current investments of INR 76,242 million (Cityfort calculation from Dr. Reddy's Q2 FY2027 Form 6-K).
- What were Dr. Reddy's latest quarterly results?
- In Q2 FY2027 (quarter ended Sep 30, 2026), Dr. Reddy's revenue was INR 86,708 million, down 1.5% from INR 88,051 million a year earlier. Profit for equity holders was INR 9,250 million, down from INR 14,372 million, and diluted EPS INR 11.10 against INR 17.25.
- Does Dr. Reddy's pay dividends?
- Yes. Dr. Reddy's paid INR 8 per equity share in each of FY2024, FY2025 and FY2026, counted after its 2024 share split. Its INR 8 dividend for FY2026 was approved on Jul 23, 2026, and the depositary converts dividends into US dollars for ADS holders.
Sources (6)
- Form 20-F for FY2026 (year ended March 31, 2026)
- Form 20-F for FY2023 (year ended March 31, 2023)
- Form 20-F for FY2022 (year ended March 31, 2022)
- Form 6-K: Q2 FY2027 results under IFRS (Exhibit 99.3)
- Form 6-K: Q2 FY2027 earnings release (Exhibit 99.2)
- Form 6-K: Q2 FY2027 report (interim condensed consolidated financial statements)
Go deeper
More detail from the same filings. Open any section.
13What it sells
13What it sells
What does Dr. Reddy's sell?
Global Generics: finished medicines
Medicines sold as generics or under brand names, including biosimilars and quit-smoking brands. The segment brought in INR 299,033 million, 89.0% of FY2026 revenue.
Generics in North America
Generic tablets, injectables and store-brand over-the-counter products: INR 113,737 million in FY2026, down 22%. The company said in its Q4 FY2026 release that the fall was mainly due to lower lenalidomide sales and a one-time claim.
Nicotine replacement brands
Nicotinell, Nicabate and related quit-smoking products outside the US, bought from Haleon in September 2024. They brought in INR 28,189 million in FY2026.
Branded medicines in India and emerging markets
India revenue was INR 62,186 million in FY2026, up 16%, and Russia INR 34,786 million. IQVIA ranked Dr. Reddy's 10th by sales in India, with a 3.2% share, the 20-F says.
Drug ingredients and contract services (PSAI)
Active pharmaceutical ingredients (API), the main ingredient in a medicine, sold to other drug makers, plus contract research and manufacturing. External revenue was INR 34,773 million in FY2026.
Think of it like this
Like a store-brand maker for medicines: once a patent expires, it makes a cheaper copy and competes on price with other copy makers.
What it does
- Does: Makes generic and branded medicines and their active ingredients
- Does: Sold 81% of FY2026 revenue outside India
- Does: Launched 25 US products and made 15 US generic filings in FY2026
What it does not do
- Does not: Report in US dollars: its 20-F figures are in Indian rupees
- Does not: Sell its nicotine replacement brands in the US: the business bought from Haleon covers markets outside the US
- Does not: Own its nutrition subsidiary alone: Nestlé India holds 49% of it
14How the money flows
14How the money flows · FY2026
How does money flow through Dr. Reddy's?
Money in
- Revenue from customersINR 335,933M
- Other income, finance income, share of associates' profit and the minority partner's share of lossesINR 12,277M
The company
Dr. Reddy's
INR 348,210M came in
Money out
- Cost of revenues (making the products)INR 158,669M
- Selling, general and administrativeINR 106,763M
- Research and developmentINR 24,058M
- Impairment (write-downs of assets)INR 3,519M
- Income taxINR 12,351M
- Profit attributable to Dr. Reddy's equity holdersINR 42,850M
- Customers paid Dr. Reddy's INR 335,933 million in FY2026 for medicines, drug ingredients and services.
- Making the products cost INR 158,669 million, leaving gross profit of INR 177,264 million.
- Selling, general and administrative costs took INR 106,763 million, research INR 24,058 million and write-downs INR 3,519 million.
- Other income of INR 7,627 million included INR 1,890 million from selling trademarks and INR 1,400 million from lawsuit settlements. Operating profit was INR 50,551 million.
- Finance income and associates added INR 4,266 million and income tax took INR 12,351 million. With the minority partner's INR 384 million share of losses, INR 42,850 million was left for equity holders.
15What it needs to run
15What it needs to run
What does Dr. Reddy's need to run?
People
27,527 employees at Mar 31, 2026, of whom 24,650 worked in India.
Factories and research sites
The 20-F puts FY2026 capital spending at INR 36,715 million, mainly for manufacturing and research facilities. A further INR 9,716 million was committed at Mar 31, 2026.
Research and approvals
Research and development cost INR 24,058 million in FY2026, 7.2% of revenue. At Sep 30, 2026, 80 US applications awaited approval: 77 for generics (ANDAs) and 3 new drug applications (NDAs).
Bought product rights and brands
Dr. Reddy's spent INR 15,099 million on intangible assets in FY2026. Purchases included the Stugeron brand and local brands for INR 4,464 million and Progynova trademarks in India for INR 3,014 million.
16Competitors and what protects it
16Competitors and what protects it
Who does Dr. Reddy's compete with?
Teva
NYSE: DECK
Named in the FY2026 20-F as a major US generics competitor; also named in Russia.
Viatris Inc.
Named in the FY2026 20-F as a major US generics competitor.
Sandoz
Named in the FY2026 20-F as a major US generics competitor.
Sun Pharmaceuticals Limited
An Indian drug maker named in the FY2026 20-F as a major US generics competitor.
Hikma Pharmaceuticals plc
Named in the FY2026 20-F as a major US generics competitor.
What protects the business
Each strength is scored 1 (weak) to 5 (strong) for the business, with the reason. It is not a rating of the share.
- Spread across markets3 of 5
No market brought in more than 34% of FY2026 revenue: North America 33.9%, India 18.5%, Europe 16.5% and Russia 10.4%.
- US filings waiting for approval3 of 5
80 US applications were pending at Sep 30, 2026; 46 challenge a brand's patent and 27 may be the first such filing, the company says.
- Brands in India3 of 5
IQVIA ranked Dr. Reddy's 10th in India by sales, with a 3.2% share, in the year to Mar 31, 2026, the 20-F says.
Weak spot
A few US products
The 20-F says "a limited number of products may account for a significant portion of our revenues". North America revenue fell 22% in FY2026.
17Where growth could come from
17Where growth could come from
Where could Dr. Reddy's' growth come from?
On Oct 23, 2026, Co-Chairman and Managing Director G.V. Prasad said the company remains focused on "strengthening our core businesses, enhancing productivity, and investing in strategic growth platforms". The releases used for this page give no revenue or profit forecast.
Branded medicines in India and emerging markets
Working+17% and +24% year on year, Q2 FY2027
India revenue was INR 18,508 million in Q2 FY2027. Emerging markets revenue rose to INR 20,595 million from INR 16,548 million, with Russia up 15%.
Status: Working, on track against what the company said.
Nicotine replacement brands
MixedINR 28,189 million in FY2026
The brands bought from Haleon brought in INR 12,020 million in the part of FY2025 after the deal. In Q2 FY2027 their revenue fell 6% from a year earlier, the company said.
Status: Mixed, partly on track.
Generic semaglutide
EarlyApproved in 10 countries by Oct 23, 2026
Dr. Reddy's launched it in Canada in May 2026, after receiving the first marketing authorization there for a generic semaglutide injection. Some batches were found out of specification in Q1 FY2027, and a separate Canada recall began in August 2026.
Status: Early, too early to judge.
Generics in North America
Behind-23% year on year, Q2 FY2027
North America revenue was INR 24,890 million, against INR 32,408 million a year earlier. The company said the decline was largely due to lower lenalidomide sales.
Status: Behind, behind the company's own plan.
Biosimilars through partners
EarlyNo separate biosimilar revenue figure is shown on this page
Biosimilars are close copies of biological drugs. The 20-F names partnerships with Alvotech (2024, a denosumab biosimilar) and Shanghai Henlius Biotech (2025, a daratumumab biosimilar) for the US and Europe.
Status: Early, too early to judge.
Status compares progress with what the company itself said it would do: Working = on track against what the company said; Mixed = partly on track; Behind = behind the company's own plan; New = recently announced; Early = too early to judge.
18The company's own measures (non-GAAP)
18The company's own measures · FY2026 (year ended Mar 31, 2026), unless stated
What do Dr. Reddy's' own measures show?
Official (IFRS): Results from operating activities (IFRS), FY2026
INR 50,551M
Company's own measure: EBITDA (Dr. Reddy's measure), FY2026
INR 76,595M
Dr. Reddy's starts from profit before tax, removes finance and investment income, and adds back depreciation, amortization and INR 3,520 million of impairment. "The numbers" shows INR 71,156 million: operating profit plus depreciation and amortization.
Official (IFRS): Operating margin (IFRS), Q2 FY2027
14.6%
Company's own measure: EBITDA margin (Dr. Reddy's measure), Q2 FY2027
20.6%
The company's EBITDAOperating profit before wear-and-tear charges (depreciation and amortization). As a margin: per $100 of sales. of INR 17,828 million ÷ revenue of INR 86,708 million. The IFRS margin is a Cityfort calculation from the Q2 FY2027 Form 6-K: operating profit of INR 12,683 million ÷ revenue.
Official (IFRS): Net cash from operating activities (IFRS), FY2026
INR 56,755M
Company's own measure: Free cash flow (Dr. Reddy's definition), FY2026
INR 20,040M
The company takes cash generated from operations after taxes and subtracts INR 36,715 million of spending on property, plant, equipment and intangible assets; after INR 3,152 million of acquisition payments it was INR 16,888 million. "The numbers" shows INR 33,429 million, which subtracts only property, plant and equipment.
Official (IFRS): Cash and cash equivalents (IFRS), Sep 30, 2026
INR 13,294M
Company's own measure: Net cash surplus (Dr. Reddy's measure), Sep 30, 2026
INR 25,024M
Cash and investments less borrowings, leaving out lease liabilities of INR 14,027 million, restricted cash and equity investments. It was INR 32,714 million at Mar 31, 2026.
These are the company's own measures, defined by the company. They are not comparable across companies, and they are not added together. Each sits beside the nearest official (IFRS) figure.
Learn: Non-GAAP measures: what a company's "adjusted" numbers leave out
19Financial strength and debt
19Financial strength · Sep 30, 2026
How much debt does Dr. Reddy's have?
- Total debtINR 58,260M
- Cash and investmentsINR 76,242M
- Net cash (cash minus debt)INR 17,982M
- Net worth (shareholders' money)INR 386,179M
- Debt to equity
- 0.15×
- INR of debt for every INR 1 of shareholders' money
- Cash and current investments is a Cityfort calculation from the Q2 FY2027 Form 6-K: cash of INR 13,294 million plus current investments of INR 62,948 million. Non-current investments of INR 10,428 million are left out.
- Lease liabilities of INR 14,027 million are not counted as debt here; with them, borrowings were INR 72,287 million at Sep 30, 2026.
- Dr. Reddy's own measure, "net cash surplus", was INR 25,024 million at Sep 30, 2026. It leaves out lease liabilities, restricted cash and equity investments, and counts non-current investments.
- Borrowings including leases rose from INR 46,766 million at Mar 31, 2025 to INR 77,341 million at Mar 31, 2026. Short-term borrowings rose from INR 38,045 million to INR 59,135 million.
- Equity attributable to equity holders was INR 386,179 million at Sep 30, 2026. Other intangible assets, mostly product rights and brands, were INR 105,059 million at Mar 31, 2026.
20Who owns it
20Who owns it · ownership as of Mar 31, 2026
Who owns Dr. Reddy's?
Share classes
Holders of 5% or more
One American depositary share (ADS) represents one equity share. J.P. Morgan Chase Bank, N.A. is the depositary, and the ADSs trade on the New York Stock Exchange. Each ADS holder owns the shares through the depositary, so the ADSs are not a separate share class.
From the company's annual report on Form 20-F (Items 6.E and 7.A), later Schedule 13G filings and the share count in that report. Each holder row shows the date of its own filing.
21What it does with profit
21What it does with profit
What does Dr. Reddy's do with its profit?
Dividend per share
INR 8.00FY2026
Dividend paid for each share, by financial year.
INR per share
See the numbers
No buybacks or fund raises in the period covered.
22Governance signals
22Governance signals
What do Dr. Reddy's' governance filings show?
- Auditor
- Deloitte Haskins & Sells, LLP, since 2026
- Auditor changes
- Jul 22, 2026: Ernst & Young Associates LLP → Deloitte Haskins & Sells, LLP (Approved on the Audit Committee's recommendation; Deloitte will audit the FY2027 20-F and review interim statements. The Q2 FY2027 report gives no reason for the change.)
- Audit qualifications
- None reported
- Related-party dealings
- This page does not summarize related-party transactions; the notes to the FY2026 20-F's financial statements list them.
- Credit rating
- Not checked for this page
Flags to know about
other
Two founding families hold about a quarter of the shares
The families of K. Satish Reddy and G.V. Prasad and their trusts held 26.63% of shares at Mar 31, 2026. The 20-F says they are likely to have "significant influence over most matters requiring approval by our shareholders".
regulatory
US anti-corruption inquiry closed
The SEC and the DOJ looked into an anonymous complaint, received in September 2020, alleging improper payments to healthcare professionals in Ukraine and potentially other countries. In a letter received on Feb 23, 2026, the SEC said that, based on the information available to it, it "does not intend to recommend any enforcement action against the Company at this time". On Mar 5, 2026, the DOJ said it "has closed its inquiry".
regulatory
US FDA inspection findings
The US FDA issued Form 483 inspection findings at two sites in India in July and August 2026, with three and four observations. The company said its responses were "provided within the stipulated timeline".
23What the market paid
23What the market paid · price as of Nov 16, 2026
What did the market pay for Dr. Reddy's on Nov 16, 2026?
Price as of Nov 16, 2026 (shown for education; prices change daily).
ADS price (NYSE) as of Nov 16, 2026: $14.70, the closing price in Nasdaq.com's historical price table for RDY; the ADSs are listed on the New York Stock Exchange. One ADS represents one equity share, so with 833,072,850 shares outstanding at Sep 30, 2026 (net of treasury shares), the market value is about $12,246 million (Cityfort calculation from the Nov 16, 2026 closing price and the Q2 FY2027 report on Form 6-K). No P/E, P/B or EV/EBITDA is shown: Dr. Reddy's reports earnings and equity in Indian rupees, so dividing them into a US-dollar price would mix two currencies.
- ADS price (NYSE)
- $14.70
- Market value (market cap)
- $12.2B
Source: RDY historical daily prices, Nov 2 to Nov 16, 2026 (Nasdaq.com table for the NYSE-listed ADS; close of Nov 16, 2026: $14.70); Form 6-K: Q2 FY2027 report (interim condensed consolidated financial statements)
24How it got here
24How it got here
How did Dr. Reddy's get here?
1984
Milestone
Founded in Hyderabad
Incorporated on Feb 24, 1984 by the late Dr. K. Anji Reddy, the company's former Chairman, to develop and supply pharmaceutical products.
2001
Milestone
ADSs listed in New York
Its ADSs have been listed on the New York Stock Exchange since Apr 11, 2001.
2024
Business-model change
Quit-smoking brands bought; shares split
Completed the purchase of Haleon's nicotine replacement business outside the US in September 2024, paying INR 51,407 million at closing. A five-for-one share split followed, with a record date of Oct 28, 2024; each ADS still represents one share.
2025
Milestone
Family shares moved into trusts
On Sep 17, 2025, family members moved shares into the GVP and VSD Family Trusts, according to a Schedule 13D/A filed the next day.
2026
Crisis
Lenalidomide claim and write-downs
In Q4 FY2026 (Jan to Mar 2026), Dr. Reddy's booked an INR 4,530 million lenalidomide claim against revenue, discontinued certain CAR-T research programs and wrote down eftilagimod alfa. Profit for equity holders that quarter was INR 2,201 million.
2026
Milestone
Semaglutide launched in Canada, then a recall
Launched generic semaglutide in Canada in May 2026. In August 2026 it began recalling some batches there for an impurity and a labeling error.
25Sources and changes
Where every number on this page comes from
Sources (17 documents)
- S1Form 20-F for FY2026 (year ended March 31, 2026) · Dr. Reddy's Laboratories Limited (SEC EDGAR) · Tier 1: company or exchange filing · May 29, 2026
- S2Form 20-F for FY2025 (year ended March 31, 2025) · Dr. Reddy's Laboratories Limited (SEC EDGAR) · Tier 1: company or exchange filing · Jun 6, 2025
- S4Form 20-F for FY2023 (year ended March 31, 2023) · Dr. Reddy's Laboratories Limited (SEC EDGAR) · Tier 1: company or exchange filing · Jun 13, 2023
- S5Form 20-F for FY2022 (year ended March 31, 2022) · Dr. Reddy's Laboratories Limited (SEC EDGAR) · Tier 1: company or exchange filing · Jun 27, 2022
- S6Form 6-K: Q2 FY2027 results under IFRS (Exhibit 99.3) · Dr. Reddy's Laboratories Limited (SEC EDGAR) · Tier 1: company or exchange filing · Oct 23, 2026
- S7Form 6-K: Q2 FY2027 earnings release (Exhibit 99.2) · Dr. Reddy's Laboratories Limited (SEC EDGAR) · Tier 1: company or exchange filing · Oct 23, 2026
- S8Form 6-K: Q2 FY2027 report (interim condensed consolidated financial statements) · Dr. Reddy's Laboratories Limited (SEC EDGAR) · Tier 1: company or exchange filing · Oct 23, 2026
- S9Form 6-K: Q4 FY2026 results under IFRS (Exhibit 99.3) · Dr. Reddy's Laboratories Limited (SEC EDGAR) · Tier 1: company or exchange filing · May 12, 2026
- S10Form 6-K: Q4 FY2026 earnings release (Exhibit 99.2) · Dr. Reddy's Laboratories Limited (SEC EDGAR) · Tier 1: company or exchange filing · May 12, 2026
- S11Form 6-K: Q3 FY2026 results under IFRS (Exhibit 99.2) · Dr. Reddy's Laboratories Limited (SEC EDGAR) · Tier 1: company or exchange filing · Jan 21, 2026
- S12Form 6-K: Q1 FY2026 results under IFRS (Exhibit 99.3) · Dr. Reddy's Laboratories Limited (SEC EDGAR) · Tier 1: company or exchange filing · Jul 23, 2025
- S13Form 6-K: Q1 FY2026 earnings release (Exhibit 99.2) · Dr. Reddy's Laboratories Limited (SEC EDGAR) · Tier 1: company or exchange filing · Jul 23, 2025
- S14Schedule 13D/A (Amendment No. 6) by G.V. Prasad, K. Satish Reddy and family trusts · SEC EDGAR · Tier 1: company or exchange filing · Sep 18, 2025
- S15Schedule 13G/A (Amendment No. 1) by BlackRock, Inc. · SEC EDGAR · Tier 1: company or exchange filing · Apr 28, 2025
- S16Schedule 13G by BlackRock, Inc. · SEC EDGAR · Tier 1: company or exchange filing · Oct 24, 2024
- S17Form F-6 registration of American Depositary Shares (stock split) · SEC EDGAR · Tier 1: company or exchange filing · Oct 23, 2024
- S18RDY historical daily prices, Nov 2 to Nov 16, 2026 (Nasdaq.com table for the NYSE-listed ADS; close of Nov 16, 2026: $14.70) · Nasdaq, Inc. · Tier 1: company or exchange filing · Nov 17, 2026
Changes to this page (v1 · Nov 17, 2026)
- v1 · Nov 17, 2026First version. (first version)
Numbers come only from tier 1 and tier 2 sources. Read how we research.
Disclaimer
For learning only. Cityfort is not a registered investment adviser or broker-dealer and does not recommend buying or selling any security. Prices shown are dated and may be out of date.
Investing in securities involves risk, including loss of capital. Before making any investment decision, do your own research and consider consulting a registered investment adviser or other qualified professional.
Cityfort, its owners and contributors may or may not hold securities of companies covered. Cityfort is not paid by any company it covers. Content is not an offer or solicitation to buy or sell any security, including in any initial public offering.
Read the positions policyRead the full disclaimerHide the full disclaimer
Cityfort publishes general educational content that explains how listed companies work. Cityfort is not registered with the US Securities and Exchange Commission or any state securities regulator as an investment adviser, and is not a broker-dealer or a member of FINRA. Cityfort does not provide investment, tax or legal advice, recommendations, ratings, price targets or any opinion on whether to buy, sell or hold any security. Nothing on the site is tailored to any person's circumstances.
All information is taken from publicly available sources, mainly company filings with the SEC, which are listed on each page with dates. We work to keep it accurate and correct errors publicly, but we do not guarantee that it is complete, accurate or up to date. Any market price or price-based ratio shown is dated, may be out of date by the time you read it, and is included only to explain concepts.
Statements by company management, including forward-looking statements and guidance, are reported as the company's statements, with their date and source; they are not our forecasts. Adjusted (non-GAAP) figures are the company's own measures and are shown next to the official (GAAP) figures.