Consumer Discretionary · NYSE: DECK
Deckers: how the business works
Deckers designs HOKA running shoes and UGG sheepskin boots, pays outside factories to make them, and had net sales of $5,472 million in FY2026.
By Hardik Bhandare · Checked against filings: . Editorial policy. Corrections
Follow Deckers
Email me when Deckers's page is updated after earnings.
We'll send a confirmation email first. See our privacy policy.
Deckers Outdoor Corporation · Goleta, California
Updated for Q2 FY2027 · checked
- Net sales, FY2026
- $5.47B
- Net income, FY2026
- $1.02B
- Sales outside the US, FY2026
- 41.7%
- Employees, Mar 31, 2026
- About 6,000
- Borrowings, Sep 30, 2026
- $0
The short version
Deckers in 5 points
1 · What it sells
Deckers sells HOKA running and outdoor shoes, UGG sheepskin boots and fashion footwear, and Teva sandals, with net sales of $5,472 million in FY2026.
2 · Who pays it
In FY2026, retailers and distributors paid 58.6% of Deckers' net sales and shoppers on its own websites and in its stores paid 41.4%.
3 · What it keeps from $100
Of every $100 that came in during FY2026, including $63.5 million of other income outside its operations, Deckers kept $18.50 as net income; operating income was $1,263 million.
4 · Where the operating profit comes from
UGG earned $1,045 million of FY2026 segment operating income, HOKA $911 million and Other brands $16.4 million, before costs the company does not assign to a brand.
5 · The one thing to watch
On Oct 22, 2026 Deckers lowered its FY2027 net sales outlook to $5.700 billion to $5.725 billion, from $5.86 billion to $5.91 billion in May, and comparable sales on its own websites and stores fell 6.4% in Q2 FY2027.
Sources: From Deckers' FY2026 10-K, the Q2 FY2027 10-Q and the Q4 FY2026 and Q2 FY2027 earnings releases · checked
01Where the money goes · FY2026 (Apr 2025 to Mar 2026)
Where does $100 of Deckers' money go?
Deckers · FY2026 (Apr 2025 to Mar 2026)
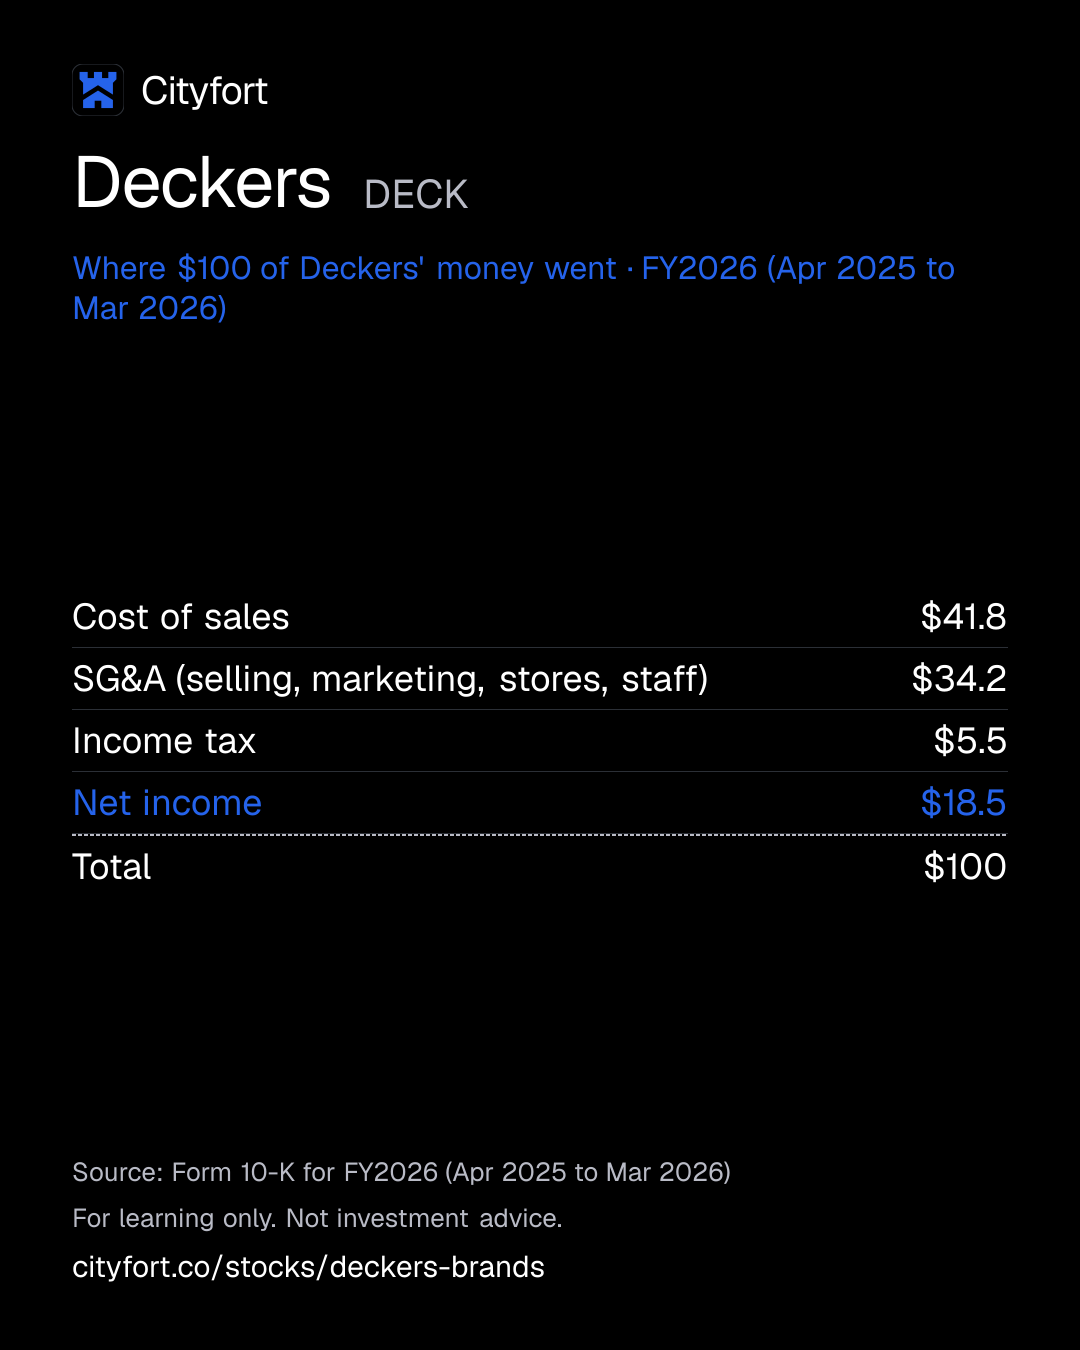
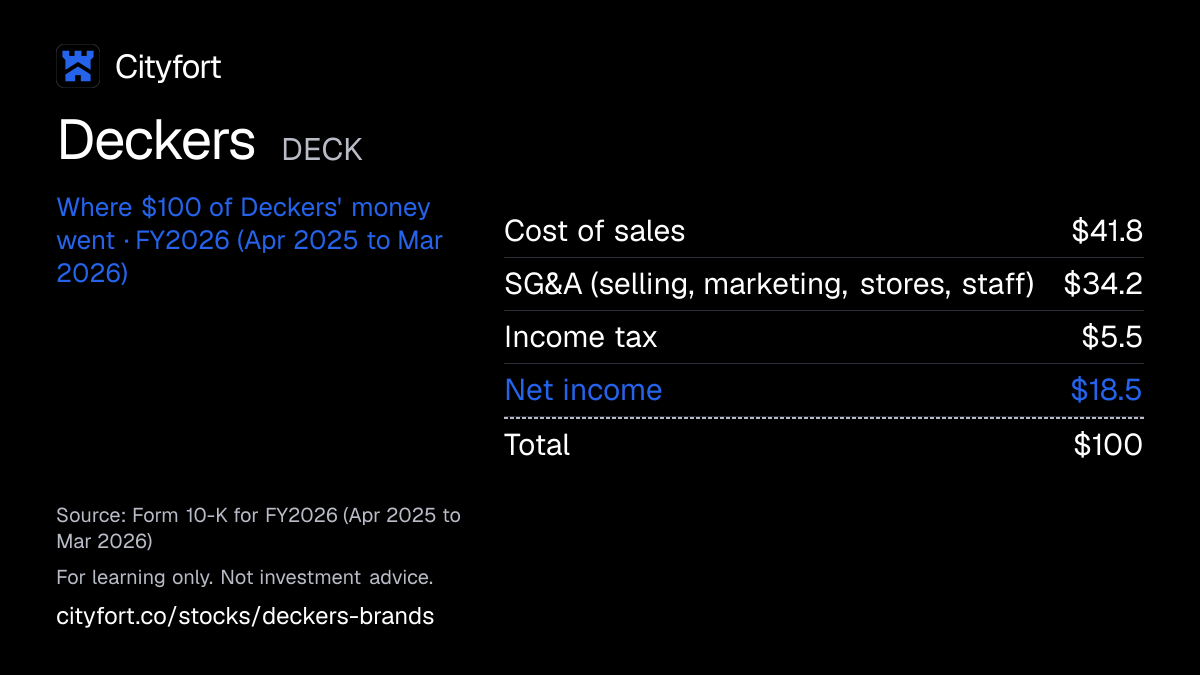
Receipt for every $100
| Cost of sales | $41.8 |
|---|---|
| SG&A (selling, marketing, stores, staff) | $34.2 |
| Income tax | $5.5 |
| Net income | $18.5 |
| Total | $100 |
Each line = amount ÷ total money in × 100. Lines may not add to exactly $100 because of rounding.
How this is worked out
Cityfort calculation from the FY2026 10-K. Of every $100 that came in during FY2026 (net sales plus $63.5 million of total other income, net): each line = line ÷ $5,535.7 million × 100.
Save this receipt as an image
Embed this receipt or the key numbers
Paste this code into a blog or website to show the card you choose, with a link back to this page.
Each week: the next company due to report earnings, explained in 5 points.
No tips. Unsubscribe anytime.
We'll send a confirmation email. See our privacy policy.
02The business in one line
What does Deckers do?
Deckers builds demand for two brands, HOKA and UGG, and pays independent factories in Asia to make what it sells.
- Retailers and distributors paid 58.6% of FY2026 net sales; shoppers on its own websites and in its stores paid 41.4%.
- Of every $100 that came in during FY2026, $41.80 went on making the products, $34.20 on selling, marketing and staff, and $18.50 was left as net income.
03Who pays it
Who pays Deckers?
Retailers and distributors (wholesale)
58.6%
of revenue
Running and outdoor specialty shops, sporting goods chains, fashion stores, department stores, online retailers and overseas distributors buy at wholesale prices and resell.
Shoppers buying direct (DTC)
41.4%
of revenue
People who buy at retail prices on Deckers’ own websites or in its 141 UGG and 62 HOKA stores.
- Retailers and distributors (wholesale)58.6%
- Shoppers buying direct (DTC)41.4%
How spread out the customers are
No single customer reached 10% of net sales in FY2024, FY2025 or FY2026. The top ten customers made up 23.7% of FY2025 net sales; the FY2026 10-K gives no top-ten figure. One customer owed 18.5% of trade receivables on Mar 31, 2026.
- Top 10 customers
- 24%
04How it makes money
How does Deckers make money?
Brand demand, outside factories and a high gross margin
Deckers owns brands, not factories. It kept $57.70 of gross profit per $100 of FY2026 net sales; marketing, stores and staff then took most of that, leaving $18.70 of net income.
Net income per $100 of net sales
$14.3$18.7
FY2022 to FY2026
- Design HOKA and UGG products
- Pay independent factories, mostly in Vietnam and Indonesia, to make them
- Spend on advertising to build demand ($495.8 million in FY2026)
- Sell through retailers (58.6% of sales) and its own websites and stores (41.4%)
- Use the cash to buy back shares ($1,075 million in FY2026)
↺ Step 5 feeds back into step 1.
05Business segments · FY2026
Which businesses make up Deckers?
HOKA
47.3%Cushioned running and outdoor shoes; grew 15.9% in FY2026, led by sales outside the US.
Revenue $2.6B ($2,587M) · Operating profit $911M
UGG
50%Sheepskin boots and fashion footwear; grew 8.2% in FY2026, led by sales outside the US.
Revenue $2.7B ($2,739M) · Operating profit $1.0B ($1,045M)
Other brands
2.7%Mainly Teva sandals; fell 33.9% in FY2026 after Koolaburra was wound down and Sanuk was sold.
Revenue $146M · Operating profit $16.4M
How the mix changed
- HOKA
- UGG
- Other brands
Revenue by segment, FY2024 to FY2026.
US$
See the numbers
06The numbers · Consolidated · US$
How has Deckers done?
Revenue
$5.5BFY2026
Net sales rose every year, from $3,150 million in FY2022 to $5,472 million in FY2026, and the October to December quarter is always the largest.
US$
See the numbers
Net income
$1.0BFY2026
EPS for every year is adjusted for the six-for-one split of Sep 13, 2024 (FY2022: Cityfort calculation from the FY2022 10-K, $16.26 ÷ 6)
US$
See the numbers
Net income for every $100 of revenue
$18.7FY2026
Net income per $100 of net sales rose from $14.30 in FY2022 to $19.40 in FY2025, then eased to $18.70 in FY2026.
Net margin: $ of net income per $100 of revenue
See the numbers
Free cash flow
$1.1BFY2026
Free cash flow (cash from operations minus spending on property and equipment) was above $940 million in each year from FY2024 to FY2026, up from $121 million in FY2022.
US$ · cash from operations minus spending on plants and equipment
See the numbers
See all yearly numbers
EBITDA here = operating income plus depreciation and amortization (from the cash flow statement). Fiscal years are the company's own: Fiscal year ends Mar 31 (FY2026 = Apr 2025 to Mar 2026). Net income is the share belonging to the company's owners.
Learn: Fiscal years that don't end in December: Nvidia's FY2027 explained · Stock-based compensation and dilution: pay that becomes shares
Sources (16)
- Form 10-K for FY2022
- Form 10-K for FY2023
- Form 10-K for FY2025
- Form 10-K for FY2024
- Form 10-K for FY2026
- Form 10-Q for Q3 FY2024
- Form 10-Q for Q3 FY2025
- Q4 FY2025 earnings release (Form 8-K, Exhibit 99.1)
- Form 10-Q for Q1 FY2025
- Form 10-Q for Q1 FY2026
- Form 10-Q for Q2 FY2025
- Form 10-Q for Q2 FY2026
- Form 10-Q for Q3 FY2026
- Q4 FY2026 earnings release (Form 8-K, Exhibit 99.1)
- Form 10-Q for Q1 FY2027
- Form 10-Q for Q2 FY2027
07Who runs it
Who runs Deckers, and did they deliver?
Stefano Caroti
President and Chief Executive Officer · since 2024
Chief Commercial Officer from Apr 2023 to Jul 2024; on the board since Sep 2024.
Steven J. Fasching
Chief Financial Officer · since 2018
Cynthia L. Davis
Independent Chair of the Board · since 2025
Chair since May 22, 2025.
Robin Spring-Green
President, HOKA
Anne Spangenberg
President, UGG
What they said, and what happened
2 delivered · 2 too early to tell
Said on Jan 30, 2025
FY2025 net sales of about $4.9 billion and diluted EPS of $5.75 to $5.80.
DeliveredWhat happened
FY2025 net sales were $4,986 million and diluted EPS was $6.33.
Said on Oct 23, 2025
FY2026 net sales of about $5.35 billion, an operating margin of about 21.5% and diluted EPS of $6.30 to $6.39.
DeliveredWhat happened
FY2026 net sales were $5,472 million, operating income $1,263 million and diluted EPS $7.02.
Said on May 21, 2026
FY2027 net sales of $5.86 billion to $5.91 billion and diluted EPS of $7.30 to $7.45, with HOKA up a low-double-digit percentage.
Too early to tellWhat happened
On Oct 22, 2026 the sales outlook was lowered to $5.700 billion to $5.725 billion and the EPS outlook raised to $7.80 to $7.95, including about $0.52 of tariff refunds.
Said on May 21, 2026
From FY2028 to FY2030: net sales up a high-single-digit percentage each year, an operating margin in the low 20s percent, and low-double-digit EPS growth with continued buybacks.
Too early to tellWhat happened
Not yet reported.
Sources (8)
- 2026 proxy statement (DEF 14A)
- Q3 FY2025 earnings release (Form 8-K, Exhibit 99.1)
- Q4 FY2025 earnings release (Form 8-K, Exhibit 99.1)
- Form 10-K for FY2025
- Q2 FY2026 earnings release (Form 8-K, Exhibit 99.1)
- Q4 FY2026 earnings release (Form 8-K, Exhibit 99.1)
- Form 10-K for FY2026
- Q2 FY2027 earnings release (Form 8-K, Exhibit 99.1)
08What could go wrong
What could go wrong for Deckers?
- Concentration
Two brands bring in almost all sales
HOKA and UGG were about 97% of FY2026 net sales. The other brands fell 33.9% that year.
Watch HOKA and UGG growth in each quarterly release
- Regulation
Tariffs on imported products
Independent manufacturers make all its products, mostly in Vietnam and Indonesia. The 10-K names added tariffs on goods sold in the US as one reason FY2026 gross margin fell to 57.7% from 57.9%.
Watch Gross margin, and refunds of the IEEPA tariffs the Supreme Court invalidated in Feb 2026
- Raw-material prices
Sheepskin supply for UGG
Sheepskin goes into a large share of UGG products. It comes mainly from Australia and is processed by two tanneries in China.
Watch UGG segment gross margin in the 10-K
- Demand
One season and the weather
UGG sales are concentrated in October to December. Q3 FY2026 brought in $1,957 million, about 36% of the year; the 10-K lists weather among factors affecting demand.
Watch Q3 FY2027 net sales in the January 2027 release
- Demand
Weaker sales on its own websites and stores
DTC comparable net sales fell 6.4% in Q2 FY2027. The 10-Q says the company believes consumers delayed purchases in a challenging economy.
Watch DTC comparable net sales in each release
- Concentration
Large wholesale customers
The top ten customers were 23.7% of FY2025 net sales. One customer owed 18.5% of trade receivables on Mar 31, 2026.
Watch Customer figures in the FY2027 10-K
- Currency
Exchange rates
$1,748 million of FY2026 net sales were in currencies other than the US dollar. Reported growth was 9.8%, against 9.0% in constant currency.
Watch Constant-currency growth in each release
- Competition
Larger rivals and new brands
The 10-K says some competitors are larger with greater resources. It adds that offshore factories and e-commerce make it easier for new brands to enter.
Watch HOKA growth against the company’s outlook
09Supporters vs. critics
What do supporters and critics point to?
What supporters point to
- Net sales rose every year, from $3,150 million in FY2022 to $5,472 million in FY2026.
- Sales outside the US grew 26.8% in FY2026 to $2,281 million, 41.7% of net sales.
- Free cash flow was above $940 million in each year from FY2024 to FY2026.
- FY2026 diluted EPS was $7.02, above the $6.30 to $6.39 range the company gave on Oct 23, 2025.
- Deckers had $1,210 million of cash and no borrowings on Sep 30, 2026.
What critics point to
- HOKA and UGG were about 97% of FY2026 net sales, and the other brands fell 33.9% that year.
- US net sales rose 0.2% in FY2026.
- Comparable sales on its own websites and stores fell 6.4% in Q2 FY2027; the 10-Q says the company believes consumers delayed purchases.
- On Oct 22, 2026 the company cut its FY2027 HOKA outlook to a high-single-digit rise, from low-double-digit in May.
- Independent manufacturers make all its products, mainly in Vietnam and Indonesia, and the 10-K names added US tariffs as one reason FY2026 gross margin fell to 57.7% from 57.9%.
10What to watch next
What should you watch next at Deckers?
Next event
Q3 FY2027 results
Date not announced yet.
The holiday quarter
October to December is UGG's main season: Q3 FY2026 brought in $1,957 million, about 36% of FY2026 net sales.
HOKA against the outlook
HOKA grew 6.8% in Q2 FY2027. On Oct 22, 2026 the company said it expected a high-single-digit FY2027 rise.
Sales on its own websites and stores
DTC comparable net sales fell 6.4% in Q2 FY2027, after DTC net sales grew 6.3% in FY2026.
Tariff refunds
Deckers had received $87.9 million of IEEPA tariff refunds by Oct 8, 2026; its FY2027 EPS outlook of Oct 22, 2026 includes about $0.52 from refunds.
Buybacks
Deckers said in its Oct 22, 2026 earnings release that its FY2027 outlook assumes $1.0 billion of buybacks; about $4.4 billion of authorization remained after Q2 FY2027.
11Key facts
Key facts about Deckers
- What does Deckers do?
- Deckers Outdoor Corporation designs and sells shoes, boots, sandals, clothing and accessories under the HOKA, UGG and Teva brands. Deckers owns no factories: independent manufacturers, mainly in Vietnam and Indonesia, made its FY2026 products.
- How does Deckers make money?
- Deckers sells its branded products to retailers at wholesale prices and to shoppers on its own websites and in 203 company stores. In FY2026, Deckers kept $57.70 of gross profit per $100 of net sales, and $18.70 per $100 was left as net income.
- Who are Deckers' customers?
- In FY2026, retailers and distributors (wholesale) paid 58.6% of Deckers' net sales and shoppers buying direct paid 41.4%. No single customer reached 10% of Deckers' FY2026 net sales; the top ten customers were 23.7% of FY2025 net sales.
- How big is Deckers?
- Deckers had net sales of $5,472 million and net income of $1,024 million in FY2026 (the year to Mar 31, 2026), up from $3,150 million and $452 million in FY2022. Diluted EPS (net income per share) was $7.02 in FY2026.
- How much do HOKA and UGG sell?
- In FY2026, Deckers' UGG brand had net sales of $2,739 million, up 8.2%, and HOKA $2,587 million, up 15.9%. Together they were about 97% of Deckers' FY2026 net sales; Teva and the other brands brought in $146 million.
- Who owns Deckers?
- Deckers' 2026 proxy statementThe yearly filing about shareholder votes, the board and executive pay. Learn more lists BlackRock with 10.5% (from its filing of Apr 17, 2025) and Vanguard Capital Management with 7.8% (Apr 29, 2026). Deckers' directors and executive officers held 0.4% on Jun 30, 2026, and Deckers has one class of stock.
- Does Deckers pay a dividend?
- Deckers has never declared or paid a cash dividend, its FY2026 10-K says. It returns cash through buybacks instead: $1,075 million in FY2026 and $637.5 million in the first half of FY2027.
- Does Deckers have debt?
- Deckers had no borrowings and $1,209.7 million of cash on Sep 30, 2026. It also has an unsecured revolving credit line of $500 million, due Aug 27, 2031, after an Aug 27, 2026 amendment.
Terms on this page
- Capital expenditures (capex)
- Customer concentration
- Debt-to-equity
- Earnings per share (EPS)
- EBITDA
- Free cash flow
- Gross margin
- Net debt
- Net margin
- Revenue vs net income
Each explains the term in plain English, with the same number from other companies on Cityfort.
Go deeper
More detail from the same filings. Open any section.
12What it sells
12What it sells
What does Deckers sell?
HOKA
Running, trail, hiking, fitness and everyday shoes with extra cushioning, first designed for ultra-distance runners. $2,587 million of FY2026 net sales.
UGG
Sheepskin boots and other footwear, clothing and accessories, sold as fashion and comfort products all year round. $2,739 million of FY2026 net sales.
Teva and other brands
Mostly Teva outdoor sandals, shoes and boots. Koolaburra and AHNU were wound down in FY2026, and Sanuk was sold in Aug 2024. $146 million of FY2026 net sales.
What it does
- Does: Designs and markets its own brands
- Does: Sells to retailers and distributors (wholesale)
- Does: Sells direct on its own websites in 54 countries and in 203 company stores (Mar 31, 2026)
- Does: Runs its own US warehouses in Moreno Valley, California and Mooresville, Indiana
What it does not do
- Does not: Own factories: independent manufacturers make every product
- Does not: Make most products in China: FY2026 production was mainly in Vietnam and Indonesia
- Does not: Pay a cash dividend: it has never declared one
Sources (1)
13How the money flows
13How the money flows · FY2026 (Apr 2025 to Mar 2026)
How does money flow through Deckers?
Money in
- Net sales$5.5B
- Total other income, net (mostly interest earned on cash)$63.5M
The company
Deckers
$5.5B came in
Money out
- Cost of sales (making and shipping the products)$2.3B
- Selling, general and administrative (SG&A)$1.9B
- Income tax$302M
- Net income$1.0B
- Retailers and shoppers paid Deckers $5,472 million for its products in FY2026.
- $2,315 million went to the factories and freight behind those products.
- $1,895 million paid for selling, marketing, stores, staff and offices.
- Interest on its cash added $63 million net, and $302 million went in income tax.
- $1,024 million was left as net income.
Sources (1)
14What it needs to run
14What it needs to run
What does Deckers need to run?
Outside factories in Asia
Independent manufacturers make every product, mainly in Vietnam and Indonesia in FY2026; no other single country, China included, made more than 5%.
Sheepskin
A large share of UGG products use sheepskin, sourced mainly from Australia and processed by two tanneries in China under fixed purchase contracts.
Marketing
Advertising, marketing and promotion cost $495.8 million in FY2026, mostly for HOKA and UGG.
Warehouses and stores
Two US distribution centers, third-party logistics firms abroad, 203 company stores and about 6,000 employees on Mar 31, 2026.
Sources (1)
15Where it sells
15Where it sells · FY2026
Where does Deckers sell?
- United States58.3%
- Outside the US41.7%
Sources (1)
16Where growth could come from
16Where growth could come from
Where could Deckers' growth come from?
On Oct 22, 2026 Deckers said it expected FY2027 (year ending Mar 31, 2027) net sales of $5.700 billion to $5.725 billion and diluted EPS of $7.80 to $7.95, including about $0.52 from tariff refunds. In May 2026 it had expected $5.86 billion to $5.91 billion of sales and EPS of $7.30 to $7.45.
HOKA
Mixed+15.9% in FY2026; +6.8% in Q2 FY2027
HOKA net sales reached $2,587 million in FY2026. On Oct 22, 2026 the company cut its FY2027 HOKA outlook to a high-single-digit rise, from low-double-digit in May.
Status: Mixed, partly on track.
Sales outside the US
Working+26.8% in FY2026
International net sales reached $2,281 million in FY2026 while US sales rose 0.2%. International grew 9.0% in Q2 FY2027.
Status: Working, on track against what the company said.
UGG
Mixed+8.2% in FY2026; +3.5% in Q2 FY2027
UGG net sales were $2,739 million in FY2026. The company now expects a low-single-digit FY2027 rise, down from mid-single-digit in its May 2026 outlook.
Status: Mixed, partly on track.
Own websites and stores (DTC)
Mixed−6.4% comparable, Q2 FY2027
DTC net sales grew 6.3% in FY2026 but fell 1.8% in Q2 FY2027. The 10-Q says the company believes consumers delayed purchases in a challenging economy.
Status: Mixed, partly on track.
Status compares progress with what the company itself said it would do: Working = on track against what the company said; Mixed = partly on track; Behind = behind the company's own plan; New = recently announced; Early = too early to judge.
17The company's own measures (non-GAAP)
17The company's own measures · FY2026 and Q2 FY2027
What do Deckers' own measures show?
Official (GAAP): Reported net sales growth, FY2026
9.8%
Company's own measure: Constant-currency net sales growth, FY2026
9.0%
Deckers’ measure: this year’s sales converted at last year’s exchange rates, excluding hedges. The 9.8% is stated in the release.
Official (GAAP): Reported net sales growth, Q2 FY2027
3.5%
Company's own measure: Constant-currency net sales growth, Q2 FY2027
2.8%
Same definition, as stated in the Q2 FY2027 release.
Official (GAAP): DTC net sales growth, Q2 FY2027
−1.8%
Company's own measure: DTC comparable net sales growth, Q2 FY2027
−6.4%
Deckers’ measure: DTC net sales from comparable operations in both periods, on a constant-currency basis.
Official (GAAP): Gross margin, Q2 FY2027
60.5%
Company's own measure: Effect of tariff refunds on gross margin, Q2 FY2027
3.1%
Deckers’ statement: about $46.0 million of IEEPA tariff refunds lowered cost of sales, adding about 310 basis points to gross and operating margin.
Official (GAAP): Diluted EPS, Q2 FY2027
$2.31
Company's own measure: Effect of tariff refunds on diluted EPS, Q2 FY2027
$0.28
Deckers’ statement: the refunds and $3.0 million of related interest added about $0.28 to diluted EPS.
These are the company's own measures, defined by the company. They are not comparable across companies, and they are not added together. Each sits beside the nearest official (GAAP) figure.
Learn: Non-GAAP measures: what a company's "adjusted" numbers leave out
18Financial strength and debt
18Financial strength · Sep 30, 2026
How much debt does Deckers have?
- Total debt$0M
- Cash and investments$1.2B
- Net cash (cash minus debt)$1.2B
- Net worth (shareholders' money)$2.3B
- Debt to equity
- 0×
- $ of debt for every $1 of shareholders' money
- Net cash of $1,209.7 million is a Cityfort calculation from the Q2 FY2027 earnings release: cash minus borrowings, which were zero. Operating lease liabilities are not counted as debt.
- Cash fell from $1,907 million on Mar 31, 2026, while inventories rose to $860.8 million from $487.0 million.
- Long-term operating lease liabilities were $459.3 million on Sep 30, 2026.
- An Aug 27, 2026 amendment raised the unsecured revolving credit line to $500 million and extended it to Aug 27, 2031 (8-K filed Aug 31, 2026).
19Who owns it
19Who owns it · ownership as of Jun 30, 2026
Who owns Deckers?
- Officers and directors (as a group), shares
- 0.4%
Share classes
Holders of 5% or more
From the company's proxy statement (DEF 14A), later Schedule 13G filings and the share counts on its latest annual or quarterly report. Each holder row shows the date of its own filing.
Learn: How to read a proxy statement (DEF 14A): Nvidia's 2026 proxy · Form 4 insider filings: who files, the codes and the footnotes
20What it does with profit
20What it does with profit
What does Deckers do with its profit?
Buyback · Mar 31, 2024
Shares repurchased during FY2024 (cash flow statement).
$415M
Buyback · Mar 31, 2025
Shares repurchased during FY2025 (cash flow statement): 3.8 million shares at an average $149.21.
$567M
Buyback · Mar 31, 2026
Shares repurchased during FY2026 (cash flow statement): 10.5 million shares at an average $102.43.
$1.1B
Buyback · Sep 30, 2026
Shares repurchased in the first half of FY2027: 6.5 million shares at an average $98.77.
$638M
21Governance signals
21Governance signals
What do Deckers' governance filings show?
- Auditor
- KPMG LLP, since 1992
- Auditor changes
- None in the period covered
- Audit qualifications
- None reported
- Related-party dealings
- The 2026 proxy reports one related-person matter: director Lauri Shanahan’s child, employed since March 2025, was paid more than $120,000 in FY2026. She does not sit on the pay committee.
- Credit rating
- No public credit rating found in a search of rating agency sites on Nov 20, 2026
22How it got here
22How it got here
How did Deckers get here?
2024
Milestone
New CEO
Stefano Caroti, Chief Commercial Officer since Apr 2023, became President and CEO in Aug 2024.
2024
Business-model change
Sanuk sold
Deckers completed the sale of the Sanuk brand on Aug 15, 2024.
2024
Milestone
Six-for-one stock split
Each share became six on Sep 13, 2024; earlier per-share figures are divided by six.
2025
Business-model change
Reporting by brand
From Q4 FY2025 the company reports three segments: HOKA, UGG and Other brands.
2026
Business-model change
Koolaburra and AHNU wound down
Standalone operations of both brands ended in Q3 and Q4 FY2026, leaving Teva as the main other brand.
2026
Milestone
International sales pass 40%
Sales outside the US rose from $1,424 million in FY2024 to $2,281 million, 41.7% of FY2026 net sales.
2026
Milestone
Tariff refunds
The US Supreme Court invalidated IEEPA tariffs in Feb 2026. Deckers had received $87.9 million of refunds by Oct 8, 2026.
2026
Milestone
Larger credit line
An Aug 27, 2026 amendment raised the unsecured revolving credit line to $500 million, due Aug 27, 2031.
23Sources and changes
Where every number on this page comes from
Sources (21 documents)
- S1Form 10-Q for Q2 FY2027 · SEC EDGAR · Tier 1: company or exchange filing · Oct 29, 2026
- S2Form 10-Q for Q1 FY2027 · SEC EDGAR · Tier 1: company or exchange filing · Jul 30, 2026
- S3Form 10-K for FY2026 · SEC EDGAR · Tier 1: company or exchange filing · May 22, 2026
- S4Form 10-Q for Q3 FY2026 · SEC EDGAR · Tier 1: company or exchange filing · Feb 3, 2026
- S5Form 10-Q for Q2 FY2026 · SEC EDGAR · Tier 1: company or exchange filing · Oct 31, 2025
- S6Form 10-Q for Q1 FY2026 · SEC EDGAR · Tier 1: company or exchange filing · Jul 31, 2025
- S7Form 10-K for FY2025 · SEC EDGAR · Tier 1: company or exchange filing · May 23, 2025
- S8Form 10-Q for Q3 FY2025 · SEC EDGAR · Tier 1: company or exchange filing · Feb 3, 2025
- S9Form 10-Q for Q2 FY2025 · SEC EDGAR · Tier 1: company or exchange filing · Oct 31, 2024
- S10Form 10-Q for Q1 FY2025 · SEC EDGAR · Tier 1: company or exchange filing · Aug 1, 2024
- S11Form 10-K for FY2024 · SEC EDGAR · Tier 1: company or exchange filing · May 24, 2024
- S12Form 10-Q for Q3 FY2024 · SEC EDGAR · Tier 1: company or exchange filing · Feb 5, 2024
- S13Form 10-K for FY2023 · SEC EDGAR · Tier 1: company or exchange filing · May 26, 2023
- S14Form 10-K for FY2022 · SEC EDGAR · Tier 1: company or exchange filing · May 27, 2022
- S152026 proxy statement (DEF 14A) · SEC EDGAR · Tier 1: company or exchange filing · Jul 24, 2026
- S16Form 8-K: amendment to the credit agreement ($500 million revolving credit facility) · SEC EDGAR · Tier 1: company or exchange filing · Aug 31, 2026
- S17Q2 FY2027 earnings release (Form 8-K, Exhibit 99.1) · SEC EDGAR · Tier 1: company or exchange filing · Oct 22, 2026
- S19Q4 FY2026 earnings release (Form 8-K, Exhibit 99.1) · SEC EDGAR · Tier 1: company or exchange filing · May 21, 2026
- S21Q2 FY2026 earnings release (Form 8-K, Exhibit 99.1) · SEC EDGAR · Tier 1: company or exchange filing · Oct 23, 2025
- S23Q4 FY2025 earnings release (Form 8-K, Exhibit 99.1) · SEC EDGAR · Tier 1: company or exchange filing · May 22, 2025
- S24Q3 FY2025 earnings release (Form 8-K, Exhibit 99.1) · SEC EDGAR · Tier 1: company or exchange filing · Jan 30, 2025
Changes to this page (v1 · Nov 20, 2026)
- v1 · Nov 20, 2026First version. (first version)
Numbers come only from tier 1 and tier 2 sources. Read how we research.
Disclaimer
For learning only. Cityfort is not a registered investment adviser or broker-dealer and does not recommend buying or selling any security. Prices shown are dated and may be out of date.
Investing in securities involves risk, including loss of capital. Before making any investment decision, do your own research and consider consulting a registered investment adviser or other qualified professional.
Cityfort, its owners and contributors may or may not hold securities of companies covered. Cityfort is not paid by any company it covers. Content is not an offer or solicitation to buy or sell any security, including in any initial public offering.
Read the positions policyRead the full disclaimerHide the full disclaimer
Cityfort publishes general educational content that explains how listed companies work. Cityfort is not registered with the US Securities and Exchange Commission or any state securities regulator as an investment adviser, and is not a broker-dealer or a member of FINRA. Cityfort does not provide investment, tax or legal advice, recommendations, ratings, price targets or any opinion on whether to buy, sell or hold any security. Nothing on the site is tailored to any person's circumstances.
All information is taken from publicly available sources, mainly company filings with the SEC, which are listed on each page with dates. We work to keep it accurate and correct errors publicly, but we do not guarantee that it is complete, accurate or up to date. Any market price or price-based ratio shown is dated, may be out of date by the time you read it, and is included only to explain concepts.
Statements by company management, including forward-looking statements and guidance, are reported as the company's statements, with their date and source; they are not our forecasts. Adjusted (non-GAAP) figures are the company's own measures and are shown next to the official (GAAP) figures.