Health Care · NYSE: ELV
Elevance Health: how the business works
Elevance Health sells health plans, including Anthem Blue Cross and Blue Shield, covering 45.2 million people and runs the Carelon pharmacy and care businesses, with total revenues of $199.1 billion in FY2025.
By Hardik Bhandare · Checked against filings: . Editorial policy. Corrections
Follow Elevance Health
Email me when Elevance Health's page is updated after earnings.
We'll send a confirmation email first. See our privacy policy.
Elevance Health, Inc. · Indianapolis, Indiana
Updated for Q3 FY2026 · checked
- Total revenues, FY2025
- $199.1B
- Net income, FY2025
- $5.66B
- Medical members, Dec 31, 2025
- 45.2 million
- Benefit expense ratio, FY2025
- 90.0%
- Employees, Dec 31, 2025
- About 97,100
The short version
Elevance Health in 5 points
1 · What it sells
Elevance Health sells health plans, including Anthem Blue Cross and Blue Shield, covering 45.2 million people, and drug-benefit and care services through Carelon, with total revenues of $199.1 billion in FY2025.
2 · Who pays it
In FY2025, state Medicaid programs brought in 28.4% of total revenues, employers and individuals 25.3%, Medicare 22.5%, Carelon's outside customers and other 15.3%, the Federal Employee Program 7.7% and investment income 0.8%.
3 · What it keeps from $100
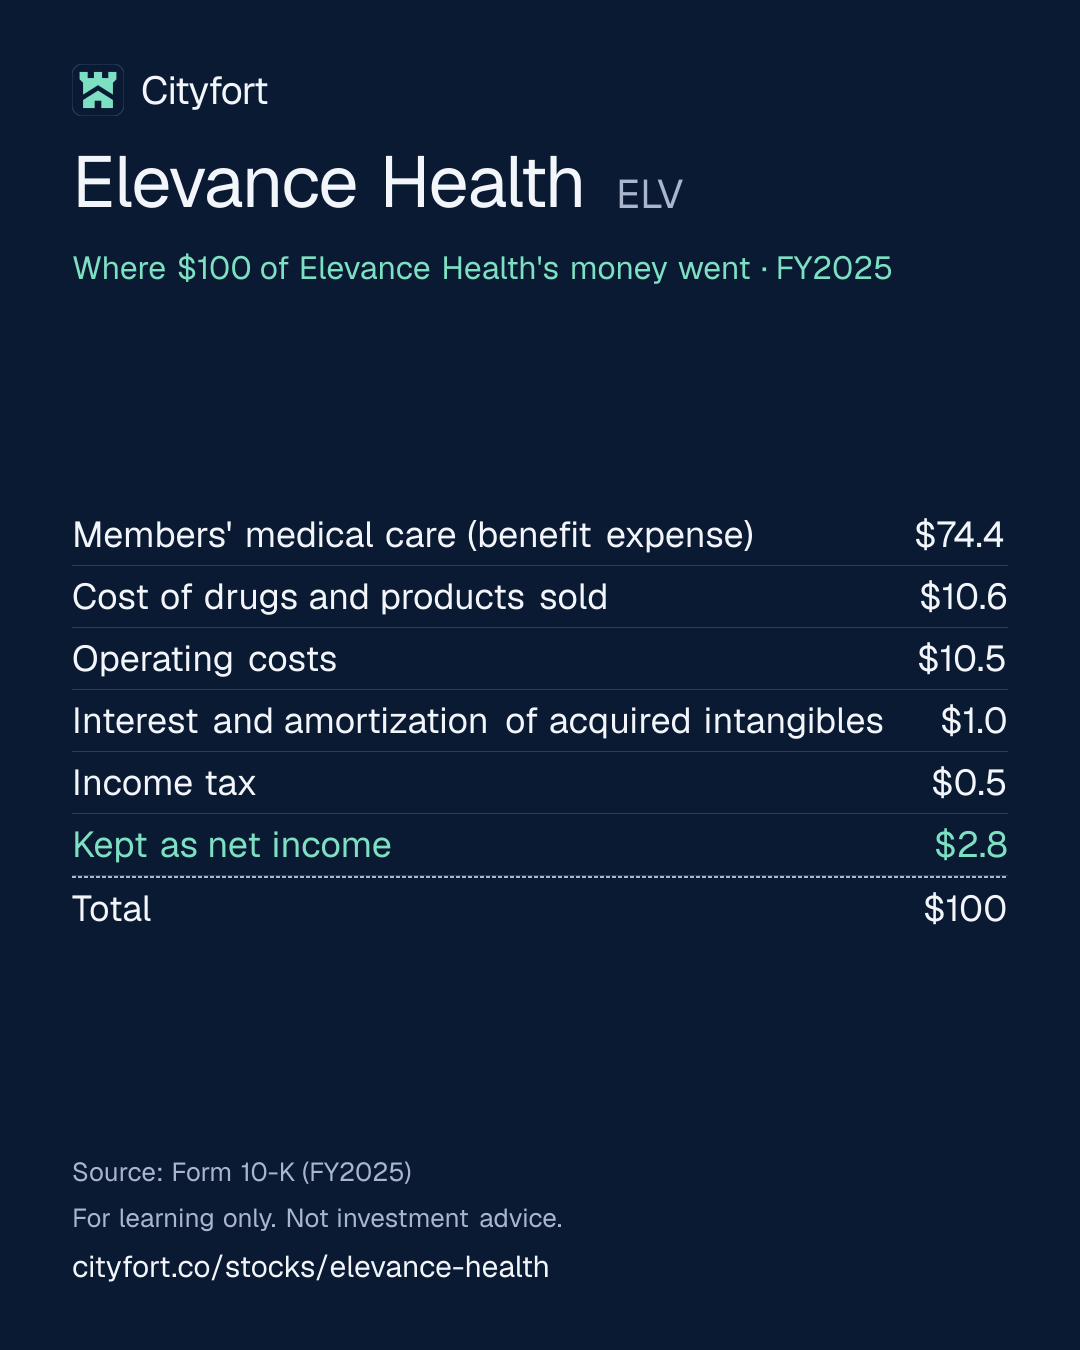
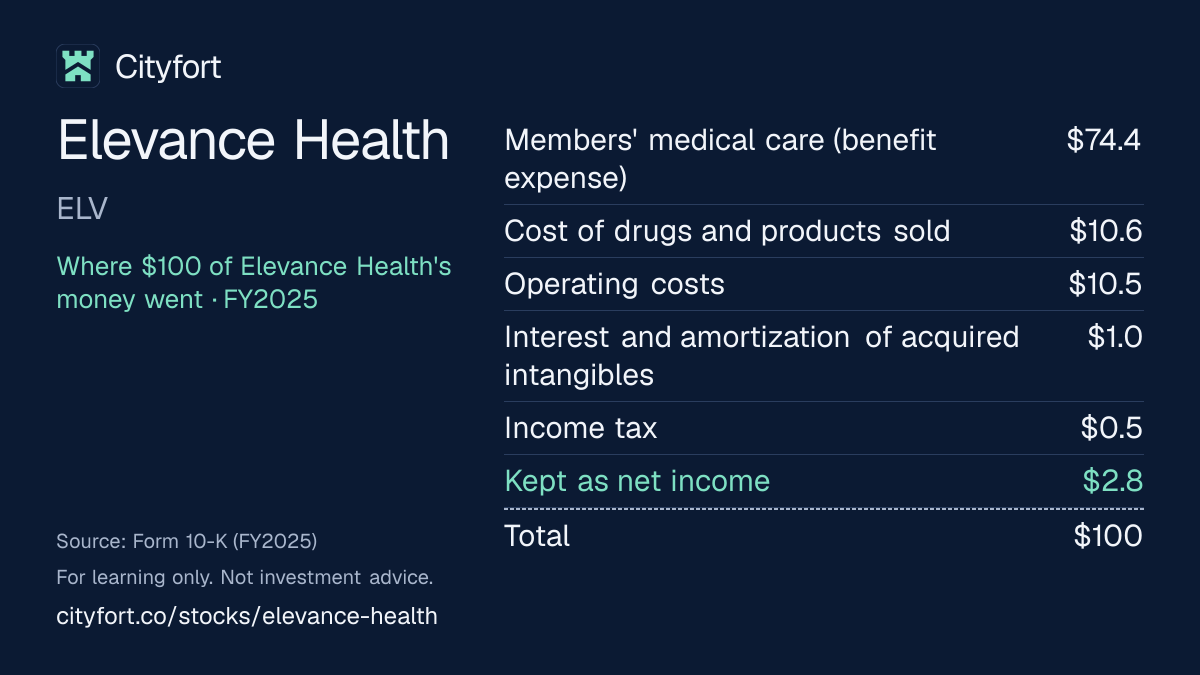
Of every $100 that came in during FY2025, Elevance Health spent $74.44 on members' medical care and kept $2.84 as net income after $653 million of net losses on financial instruments, while its operating gain before investment results, interest and tax was $7.2 billion.
4 · Where the operating profit comes from
FY2025 operating gain was $4.2 billion in Health Benefits, $2.4 billion at CarelonRx and $960 million at Carelon Services, while Corporate & Other lost $337 million.
5 · The one thing to watch
The benefit expense ratio, the share of premiums paid out for members' care, was 90.6% in Q3 FY2026, against 91.3% a year earlier.
Sources: From Elevance Health's FY2025 10-K and its Q3 FY2026 earnings release · checked
See the full receipt and the management scorecard below
01Where $100 of an insurer's money goes · FY2025
Where does $100 of Elevance Health's money go?
Elevance Health · FY2025
Receipt for every $100
| Members' medical care (benefit expense) | $74.4 |
|---|---|
| Cost of drugs and products sold | $10.6 |
| Operating costs | $10.5 |
| Interest and amortization of acquired intangibles | $1.0 |
| Income tax | $0.5 |
| Kept as net income | $2.8 |
| Total | $100 |
Each line = amount ÷ total money in × 100. Lines may not add to exactly $100 because of rounding.
How this is worked out
Cityfort calculation from the FY2025 10-K: each line ÷ total revenues of $199,125 million × 100. Total revenues include net investment income of $2,194 million less $653 million of net losses on financial instruments. Lines add to $100.01 because of rounding; a $1 million loss belonging to noncontrolling holders is left out. Operating gain, the company's segment measure before investment income and losses, interest, amortization of acquired intangibles and tax, was $7.2 billion, or $3.64 per $100 of operating revenue (Cityfort calculation from the FY2025 10-K).
Save this receipt as an image:
1080 × 1350 PNG for Instagram, LinkedIn1200 × 675 PNG for X
Embed this receipt
Paste this code into a blog or website to show the receipt, with a link back to this page:
Each week: one company explained in 5 points, picked by earnings date.
Free, no tips, unsubscribe anytime.
We'll send a confirmation email. See our privacy policy.
02The business in one line
What does Elevance Health do?
Employers, people, states and the federal government pay Elevance Health premiums and fees for health coverage, drug benefits and care services; $74.44 of every $100 that came in during FY2025 paid members' medical bills, and $2.84 was left as net income.
- Elevance Health has health plans (its Health Benefits segment) and Carelon, which manages drug benefits (CarelonRx) and sells care and data services (Carelon Services).
- About 32% of FY2025 total revenues came from US government agencies, as the FY2025 10-K states.
03Who pays it
Who pays Elevance Health?
State Medicaid programs
28%
of revenue
Premiums for Medicaid plans that states run with federal matching money: $56.6 billion, 28.4% of FY2025 total revenues (Cityfort calculation from the FY2025 10-K). Elevance does not give a figure for any single state.
Employers and individuals
25%
of revenue
Commercial premiums and fees, including individual plans: $50.4 billion, 25.3% of total revenues.
Medicare members and the federal government
23%
of revenue
Medicare Advantage, Medicare Supplement and drug plan premiums: $44.8 billion, 22.5% of total revenues.
Carelon's outside customers and other
15%
of revenue
Drug-benefit and care services sold outside Elevance's health plans, and other revenue: $30.5 billion, 15.3% of total revenues (Cityfort calculation from the FY2025 10-K: total operating revenue minus Health Benefits revenue).
Federal Employee Program
8%
of revenue
Premiums for health plans for federal government employees and their families: $15.3 billion, 7.7% of total revenues.
Investment income
1%
of revenue
Not a customer: net investment income of $2.2 billion less $653 million of net losses on financial instruments, $1.5 billion or 0.8% of total revenues.
- State Medicaid programs28%
- Employers and individuals25%
- Medicare members and the federal government23%
- Carelon's outside customers and other15%
- Federal Employee Program8%
- Investment income1%
How spread out the customers are
About 32% of Elevance Health's FY2025 total revenues came from US government agencies, against 31% in FY2024 and 29% in FY2023, as the 10-K states. Medicaid money comes through each state's program, and the 10-K gives no figure for any single state.
04Why it makes money
Why does Elevance Health make money?
It profits when premiums cover members' medical bills and running costs, and Carelon earns again on the same members
Premiums are set in advance, mostly for a year, so profit depends on medical bills staying below what was priced in. Carelon then earns from drug benefits and care services sold to Elevance's own plans and to outside customers.
Benefit expense ratio (medical bills per $100 of premiums)
87.4%90.0%
FY2021 to FY2025
- Employers, people and governments pay premiums
- Elevance negotiates prices with doctors and hospitals
- It pays members' medical bills
- CarelonRx and Carelon Services sell drug and care services to its plans and others
- It invests premiums until bills are paid
- What is left after costs and tax is profit
↺ Step 6 feeds back into step 1.
05Business segments · FY2025
Which businesses make up Elevance Health?
Health Benefits
70%Health plans: Commercial, Medicare, Medicaid and the Federal Employee Program. Operating gain was $4.2 billion, a 2.5% margin, down from $6.2 billion in FY2024. Revenue shares here are of $239.3 billion of segment revenue, before $41.7 billion of sales between segments is removed (Cityfort calculation from the FY2025 10-K).
Revenue $167.1B · Operating profit $4.2B
CarelonRx
18%Pharmacy benefits. Operating gain was $2.4 billion, a 5.6% margin, up from $2.2 billion in FY2024.
Revenue $43.4B · Operating profit $2.4B
Carelon Services
12%Care management, behavioral health and data services. Operating gain was $960 million, a 3.4% margin, up from $717 million in FY2024.
Revenue $28.3B · Operating profit $960M
Corporate & Other
0%Small businesses and unallocated corporate costs. It lost $337 million, against a $1.3 billion loss in FY2024 that included the provider antitrust settlement accrual.
Revenue $463M · Operating profit −$337M
How the mix changed
- Health Benefits
- CarelonRx
- Carelon Services
- Corporate & Other
Revenue by segment, FY2021 to FY2025.
US$
See the numbers
06The numbers · Consolidated · US$
How has Elevance Health done?
Premiums
$164.6BFY2025
Premiums rose from $117.4 billion in FY2021 to $164.6 billion in FY2025, and were $41.7 billion in Q3 FY2026.
US$ · premiums from policyholders and plan members, as reported
See the yearly numbers
See the quarterly numbers
Medical care ratio
90.0%FY2025
The benefit expense ratio, medical bills as a share of premiums, rose from 87.0% in FY2023 to 90.0% in FY2025, and was 90.6% in Q3 FY2026.
Elevance calls its medical care ratio the benefit expense ratio (benefit expense ÷ premiums), and its operating expense ratio divides operating expense by total operating revenue, not premiums, so no expense ratio is shown here.
% of premiums · medical costs per $100 of premiums, as reported
See the yearly numbers
See the quarterly numbers
Net income
$5.7BFY2025
Net income fell from $6.16 billion in FY2021 to $5.66 billion in FY2025, which included $653 million of net losses on financial instruments.
US$ · after claims, costs, investment results and tax; the table shows where it came from
See the numbers
See all yearly numbers
Medical care ratio = medical costs ÷ premiums, as the company reports it. Net investment income is interest and dividends on the money the company holds before paying claims; realized and unrealized gains are shown apart because they move with markets. Net income is the amount for common stockholders. Fiscal years are the company's own (December 31. Elevance Health's fiscal year matches the calendar year: FY2025 ended Dec 31, 2025, and Q3 FY2026 ended Sep 30, 2026.).
- Premiums are Elevance's premium revenue; claims are its benefit expense (members' medical care). Operating costs are its whole operating expense line, which also covers the Carelon businesses.
- Fees and other are product revenue (mostly CarelonRx drug sales) plus service fees.
- Realized gains are the results on bonds and stocks sold; unrealized gains are changes on stocks still held. Losses on other investments ($502 million in FY2025, including $435 million of impairments) are in neither column but are part of total revenues. The split is not shown for FY2021 and FY2022.
- Book value per share and ROE are Cityfort calculations from the FY2023 and FY2025 10-Ks: shareholders' equity ÷ year-end shares outstanding, and net income ÷ average shareholders' equity. Elevance does not report ROE.
- FY2021 and FY2022 are restated for the accounting change for long-duration insurance contracts adopted in 2023. Members are medical members at year end; FY2023 is as restated in the FY2025 10-K.
Download Elevance Health's yearly and quarterly numbers (CSV, with source ids)
Learn: How to read a US earnings release: Nvidia's Q2 fiscal 2027 · What is return on equity? Profit on equity, with real US companies
Sources (10)
- Form 10-K, fiscal year 2023 (ended Dec 31, 2023)
- Form 10-K, fiscal year 2025 (ended Dec 31, 2025)
- Q3 FY2025 earnings release (8-K Ex. 99.1, Oct 21, 2025)
- Q4 FY2024 earnings release (8-K Ex. 99.1, Jan 23, 2025)
- Q1 FY2025 earnings release (8-K Ex. 99.1, Apr 22, 2025)
- Q2 FY2025 earnings release (8-K Ex. 99.1, Jul 17, 2025)
- Q4 FY2025 earnings release (8-K Ex. 99.1, Jan 28, 2026)
- Q1 FY2026 earnings release (8-K Ex. 99.1, Apr 22, 2026)
- Q2 FY2026 earnings release (8-K Ex. 99.1, Jul 15, 2026)
- Q3 FY2026 earnings release (8-K Ex. 99.1, Oct 21, 2026)
07Who runs it
Who runs Elevance Health, and did they deliver?
Gail K. Boudreaux
President and Chief Executive Officer · since 2017
CEO and a director since November 2017. She was earlier CEO of UnitedHealthcare and an executive vice president of UnitedHealth Group. Her 2025 total pay was $22,582,314; the CEO pay ratio was 286 to 1.
Mark B. Kaye
Executive Vice President and Chief Financial Officer · since 2023
CFO since November 2023, after serving as CFO of Moody's Corporation.
Felicia F. Norwood
Executive Vice President and President, Government Health Benefits · since 2018
Runs the Medicare and Medicaid business since June 2018. She earlier ran the Illinois state agency for health care and family services.
Peter D. Haytaian
Special Advisor; President of Carelon and CarelonRx until May 4, 2026 · since 2021
Led Carelon and CarelonRx from October 2021. The company said on Feb 26, 2026 that he would leave the role on May 4, 2026 and stay as Special Advisor until Dec 31, 2026.
Ramiro G. Peru
Independent Chair of the Board · since 2025
Became Independent Chair after the retirement of director Elizabeth Tallett, as the 2026 proxy describes. The chair and CEO roles are held by different people.
What they said, and what happened
1 missed · 1 delivered · 3 too early to tell
Said on Jan 23, 2025
Elevance guided on Jan 23, 2025 to 2025 GAAP EPS of $30.40 to $31.10 and adjusted EPS of $34.15 to $34.85, and reaffirmed the adjusted range in April 2025.
MissedWhat happened
On Jul 17, 2025 it cut the adjusted guide to about $30.00. FY2025 GAAP EPS was $25.21 and adjusted EPS $30.29.
Said on Jul 17, 2025
Elevance guided on Jul 17, 2025 to 2025 adjusted EPS of about $30.00, and on Oct 21, 2025 added a benefit expense ratio of about 90.0%.
DeliveredWhat happened
FY2025 adjusted EPS was $30.29 and the benefit expense ratio 90.0%.
Said on Jan 28, 2026
Elevance guided on Jan 28, 2026 to 2026 GAAP EPS of at least $22.30 and adjusted EPS of at least $25.50.
Too early to tellWhat happened
After the CMS accrual it cut the GAAP guide to at least $19.85 on Apr 22, 2026, then raised it to at least $22.00 on Oct 21, 2026; adjusted went to at least $29.00. Nine-month GAAP EPS was $21.01 and adjusted EPS $27.06.
Said on Jan 28, 2026
Elevance guided on Jan 28, 2026 to 2026 cash from operations of at least $5.5 billion, and reaffirmed it on Apr 22, 2026.
Too early to tellWhat happened
It raised the guide to at least $6.0 billion on Jul 15, 2026 and at least $6.5 billion on Oct 21, 2026. Cash from operations was $7.5 billion in the first nine months.
Said on Jan 28, 2026
Elevance said on Jan 28, 2026 that it expects at least 12% adjusted EPS growth in 2027.
Too early to tellWhat happened
On Oct 21, 2026 it repeated at least 12%, measured from an earnings baseline of at least $26.75. 2027 results are not yet reported.
Sources (13)
- Form 10-K, fiscal year 2025 (ended Dec 31, 2025)
- 2026 proxy statement (DEF 14A, annual meeting May 13, 2026)
- Form 10-Q, Q3 FY2026 (quarter ended Sep 30, 2026)
- Form 8-K (Items 5.02, 7.01), Carelon president transition; 2026 guidance reaffirmed
- Q4 FY2024 earnings release (8-K Ex. 99.1, Jan 23, 2025)
- Form 8-K (Items 2.02, 7.01), preliminary Q1 2025 results and 2025 guidance (Apr 17, 2025)
- Q1 FY2025 earnings release (8-K Ex. 99.1, Apr 22, 2025)
- Q2 FY2025 earnings release (8-K Ex. 99.1, Jul 17, 2025)
- Q4 FY2025 earnings release (8-K Ex. 99.1, Jan 28, 2026)
- Q3 FY2025 earnings release (8-K Ex. 99.1, Oct 21, 2025)
- Q1 FY2026 earnings release (8-K Ex. 99.1, Apr 22, 2026)
- Q3 FY2026 earnings release (8-K Ex. 99.1, Oct 21, 2026)
- Q2 FY2026 earnings release (8-K Ex. 99.1, Jul 15, 2026)
08What could go wrong
What could go wrong for Elevance Health?
- Pricing
Medical costs above premiums
Premiums are set in advance, so higher use of care cuts profit. The benefit expense ratio rose from 87.0% in FY2023 to 90.0% in FY2025, which the 10-K links to higher medical cost trend across all lines of business.
Watch The benefit expense ratio each quarter: 90.6% in Q3 FY2026, against a full-year 2026 guide of 90.2%, plus or minus 0.5 points (Sep 10, 2026).
- Regulation
Government programs and their rules
About 32% of FY2025 total revenues came from US government agencies, and Medicaid depends on state budgets. CMS rules on Medicare Advantage data and star ratings affect payments; a CMS notice in February 2026 led to a $935 million accrual.
Watch Medicare star ratings: about 49% of Medicare Advantage members in plans rated 4 stars or more for 2028 payments, against about 55% the year before.
- Legal
Lawsuits on Medicare data, antitrust and guidance
The DOJ's False Claims Act suit, filed in March 2020, alleges inaccurate Medicare Advantage diagnosis data. Blue antitrust opt-out cases and a shareholder class action over 2024 guidance are also pending; the company says they are without merit.
Watch Fact discovery in the DOJ case, due Nov 20, 2026, and the California antitrust trial set for March 2027.
- Demand
Fewer Medicaid and Medicare Advantage members
Medicaid members fell from 11.6 million at the end of FY2022 to 8.2 million at Sep 30, 2026. Medicare Advantage members fell 15.5% in the year to Sep 30, 2026, to 1.9 million.
Watch Membership by line in each earnings release.
- Debt
More debt, less operating cash
Total debt rose from $23.0 billion at the end of FY2021 to $32.0 billion at the end of FY2025, while cash from operations fell from $8.4 billion to $4.3 billion. S&P lowered its rating from A to A- between October 2025 and February 2026.
Watch Cash from operations against the company's 2026 guide of at least $6.5 billion; it was $7.5 billion in the first nine months.
- Concentration
Reliance on CVS for pharmacy services
A CVS Health subsidiary does core pharmacy services for CarelonRx, such as claims and pharmacy networks, under a contract running through Dec 31, 2027. The 10-K says a CVS failure to perform could hurt the business.
Watch Any renewal, extension or change of the CVS agreement before Dec 31, 2027.
- Other
Investment losses
Net losses on financial instruments were $653 million in FY2025, including $435 million of impairments on other investments. The company estimates that a 1-point rise in interest rates would lower the market valueShare price × number of shares: what all the shares were worth at one dated price. Learn more of its bonds by about $1.6 billion.
Watch Net gains or losses on financial instruments in each 10-Q.
Sources (7)
- Form 10-K, fiscal year 2025 (ended Dec 31, 2025)
- Q3 FY2026 earnings release (8-K Ex. 99.1, Oct 21, 2026)
- Form 8-K (Item 7.01), 2026 guidance reaffirmed (Sep 10, 2026)
- Form 10-Q, Q3 FY2026 (quarter ended Sep 30, 2026)
- Form 10-K, fiscal year 2023 (ended Dec 31, 2023)
- Form 10-K, fiscal year 2022 (ended Dec 31, 2022)
- Form 10-Q, Q3 FY2025 (quarter ended Sep 30, 2025)
09Both sides
What do supporters and critics point to?
What supporters point to
- Total revenues rose every year, from $138.6 billion in FY2021 to $199.1 billion in FY2025.
- CarelonRx's operating gain rose from $1.7 billion in FY2021 to $2.4 billion in FY2025, and Carelon Services' from $187 million to $960 million.
- The benefit expense ratio was 90.6% in Q3 FY2026, against 91.3% a year earlier, and on Oct 21, 2026 the company raised its 2026 adjusted EPS guide to at least $29.00.
- CMS said on Jul 13, 2026 that it would not impose the sanctions it had proposed in February.
- Dividends per share rose every year, from $4.52 in FY2021 to $6.84 in FY2025.
What critics point to
- Net income fell from $6.16 billion in FY2021 to $5.66 billion in FY2025, while total revenues grew 43.6%.
- The benefit expense ratio rose from 87.0% in FY2023 to 90.0% in FY2025.
- FY2025 adjusted EPS was $30.29, against an initial guide of $34.15 to $34.85.
- Medicare Advantage members fell 15.5% in the year to Sep 30, 2026, and Medicaid members fell from 11.6 million at the end of FY2022 to 8.2 million.
- Total debt rose from $23.0 billion in FY2021 to $32.0 billion in FY2025, and S&P lowered its rating to A-.
10What to watch next
What should you watch next at Elevance Health?
Next event
Q4 and full-year FY2026 results
Date not announced yet.
The benefit expense ratio
It was 90.6% in Q3 FY2026. On Sep 10, 2026, the company guided to 90.2%, plus or minus 0.5 points, for full-year 2026.
FY2026 results against the guide
On Oct 21, 2026, the company guided to 2026 GAAP EPS of at least $22.00, adjusted EPS of at least $29.00 and cash from operations of at least $6.5 billion.
Medicare Advantage and Medicaid members
Medicare Advantage had 1.9 million members and Medicaid 8.2 million at Sep 30, 2026, both lower than a year earlier.
Legal updates
The DOJ False Claims Act case, the Blue antitrust opt-out cases and the shareholder suits, in each 10-Q and 10-K.
11Key dates
What are the key dates for Elevance Health?
| Event | Date | Source |
|---|---|---|
| DOJ False Claims Act case: fact discovery deadlineExpert discovery is due by Aug 2, 2027, as the Q3 FY2026 10-Q states. | Form 10-Q, Q3 FY2026 (quarter ended Sep 30, 2026) | |
| California Blue antitrust case (VHS) trialScheduled for March 2027, as the Q3 FY2026 10-Q states. | Not yet stated | Form 10-Q, Q3 FY2026 (quarter ended Sep 30, 2026) |
| CVS pharmacy services contract term endsElevance can elect a three-year extension on the same terms, as the FY2025 10-K states. | Form 10-K, fiscal year 2025 (ended Dec 31, 2025) |
12Key facts
Key facts about Elevance Health
- What does Elevance Health do?
- Elevance Health, Inc., formerly Anthem, Inc., sells health plans to employers, individuals, Medicare and Medicaid members and federal employees, and is a Blue Cross and/or Blue Shield licensee in 14 states (Blue Cross only in California). Its Carelon businesses manage drug benefits and sell care services. It had 45.2 million medical members at Dec 31, 2025 and total revenues of $199.1 billion in FY2025.
- How does Elevance Health make money?
- Elevance Health's business model is collecting premiums and fees for health coverage and paying members' medical bills: in FY2025, premiums were $164.6 billion of its $199.1 billion of total revenues, and medical bills took $74.44 of every $100 that came in. CarelonRx drug sales and service fees bring in most of the rest, and $2.84 of every $100 was left as net income.
- Who are Elevance Health's customers?
- In FY2025, state Medicaid programs brought in 28.4% of Elevance Health's total revenues, employers and individuals 25.3%, Medicare 22.5%, Carelon's outside customers and other 15.3%, the Federal Employee Program 7.7% and investment income 0.8% (Cityfort calculation from the FY2025 10-K). About 32% of total revenues came from US government agencies.
- Is Elevance Health profitable?
- Yes. Elevance Health reported net income of $5.66 billion in FY2025, with diluted EPS of $25.21, down from $5.98 billion in FY2024, on total revenues of $199.1 billion. In the first nine months of FY2026 its net income was $4.59 billion.
- What is Elevance Health's revenue by segment?
- Elevance Health reports four segments. In FY2025, Health Benefits had operating revenue of $167.1 billion, CarelonRx $43.4 billion, Carelon Services $28.3 billion and Corporate & Other $463 million; $41.7 billion of sales between the segments is removed in the consolidated total.
- How many members does Elevance Health have?
- Elevance Health had 44.9 million medical members at Sep 30, 2026, against 45.4 million a year earlier. Of these, 27.6 million were in fee-based commercial plans, including BlueCard members of other Blue plans, where Elevance earns fees and does not carry the medical cost.
- What is CarelonRx?
- CarelonRx is Elevance Health's pharmacy benefits business: it runs drug benefits, home delivery and specialty pharmacy for Elevance's own health plans and outside customers. In FY2025 it had operating revenue of $43.4 billion and an operating gain of $2.4 billion.
- What is Carelon Services?
- Carelon Services is Elevance Health's care and data services business: behavioral health, home and post-acute care management, care for people with complex conditions, and payment checking for health plans. Its operating revenue was $28.3 billion in FY2025, up from $18.0 billion in FY2024, with an operating gain of $960 million.
- What is Elevance Health's benefit expense ratio?
- Elevance Health's benefit expense ratio, the share of premiums paid out for members' medical care, was 90.0% in FY2025, up from 88.5% in FY2024 and 87.0% in FY2023. It was 90.6% in Q3 FY2026.
- Who owns Elevance Health?
- Elevance Health has one class of common stock, with 216.1 million shares at Oct 15, 2026 and no controlling holder. Vanguard Capital Management reported 7.13% as of Mar 31, 2026 and BlackRock 7.8% in an April 2025 filing; directors and executive officers held less than 1% at Feb 1, 2026, as the 2026 proxy states.
Sources (6)
- Form 10-K, fiscal year 2025 (ended Dec 31, 2025)
- EDGAR company submissions for Elevance Health (CIK 0001156039)
- Q3 FY2026 earnings release (8-K Ex. 99.1, Oct 21, 2026)
- Form 10-Q, Q3 FY2026 (quarter ended Sep 30, 2026)
- 2026 proxy statement (DEF 14A, annual meeting May 13, 2026)
- Schedule 13G by Vanguard Capital Management (7.13%, event date Mar 31, 2026)
Terms on this page
- Capital expenditures (capex)
- Earnings per share (EPS)
- Market cap
- Net margin
- P/E ratio
- Revenue vs net income
- Stock buyback
Each explains the term in plain English, with the same number from other companies on Cityfort.
Go deeper
More detail from the same filings. Open any section.
13What it sells
13What it sells
What does Elevance Health sell?
Commercial health plans
Plans for employers and for individuals, including plans bought on the Affordable Care Act exchanges. In fee-based plans the employer pays the medical bills and Elevance is paid to run the plan. Revenue was $50.4 billion in FY2025.
Medicare plans
Medicare Advantage, Medicare Supplement and drug plans for people aged 65 or older and some people with disabilities. Revenue was $44.8 billion in FY2025.
Medicaid plans
Plans that states pay Elevance to run for people with low incomes or high medical needs, under each state's program. Revenue was $56.6 billion in FY2025.
Federal Employee Program
Health plans for US government employees and their families in Elevance's states. Revenue was $15.3 billion in FY2025.
CarelonRx
Pharmacy benefits: drug lists, pharmacy networks, claims, home delivery, specialty pharmacy and infusion centers, for Elevance's own plans and outside customers. Operating revenue was $43.4 billion in FY2025.
Carelon Services
Behavioral health, home and post-acute care management, care for people with complex conditions, and data services such as payment checking for health plans. Operating revenue was $28.3 billion in FY2025.
Think of it like this
Like a shared pot: members and their employers or governments pay in each month, and the pot pays the medical bills of the members who need care.
What it does
- Does: Sells health plans as the Blue Cross or Blue Cross and Blue Shield licensee in 14 states, mostly under the Anthem name
- Does: Runs Medicaid plans for states and Medicare Advantage plans
- Does: Runs plans for employers that pay their own medical bills, for a fee
- Does: Manages drug benefits and runs specialty and home-delivery pharmacies through CarelonRx
- Does: Invests premiums until medical bills are paid
What it does not do
- Does not: Own the Blue Cross Blue Shield brands outright: it is one of 33 licensees of the association
- Does not: Hold the Blue license in every state: it has it in 14 (in California, Blue Cross only)
- Does not: Handle every pharmacy task itself: a CVS Health subsidiary does core pharmacy services under a contract running through Dec 31, 2027
14How the money flows
14How the money flows · FY2025
How does money flow through Elevance Health?
Money in
- Premiums$164.6B
- Product sales (mostly CarelonRx drugs)$24.5B
- Service fees$8.5B
- Investment income, less losses on financial instruments$1.5B
The company
Elevance Health
$199.1B came in
Money out
- Members' medical care (benefit expense)$148.2B
- Cost of drugs and products sold$21.2B
- Operating costs$21.0B
- Interest and amortization of acquired intangibles$2.0B
- Income tax$1.0B
- Net income attributable to Elevance Health$5.7B
- Members, employers, states and the federal government paid Elevance $164.6 billion of premiums in FY2025. Drug and other product sales brought $24.5 billion and service fees $8.5 billion.
- Investments earned $2.2 billion, less $653 million of net losses on financial instruments.
- Members' medical bills took $148.2 billion, 90.0% of premiums.
- The drugs and products it sold cost $21.2 billion, and running the business cost $21.0 billion.
- Interest, amortization of acquired intangibles and tax took $3.1 billion. Shareholders were left with $5.66 billion of net income.
15What it needs to run
15What it needs to run
What does Elevance Health need to run?
Blue Cross Blue Shield licenses
Elevance is the Blue licensee in 14 states, one of 33 licensees at Dec 31, 2025. Through the BlueCard program its members can use other Blue plans' doctor networks and discounts when they travel or work in other states.
Doctor and hospital networks
Contracts with hospitals, doctors and other providers set the prices Elevance pays for care. The 10-K names failing to keep cost-effective contracts as a risk.
The CVS pharmacy services contract
A CVS Health subsidiary handles core pharmacy services for CarelonRx, such as claims and pharmacy networks, under a contract running through Dec 31, 2027, with an option for a three-year extension.
Regulatory capital
State regulators require its insurance and HMO subsidiaries to hold capital; the company put the risk-based capital requirement at about $9.1 billion at Dec 31, 2025.
People
About 97,100 employees at Dec 31, 2025: 71,900 in the US and 25,200 in other countries.
16Where growth could come from
16Where growth could come from
Where could Elevance Health's growth come from?
Elevance Health said in its Q3 FY2026 earnings release (Oct 21, 2026) that it expects 2026 GAAP EPS of at least $22.00, adjusted EPS of at least $29.00 and cash from operations of at least $6.5 billion. It also said it expects adjusted EPS to grow at least 12% in 2027 from an earnings baseline of at least $26.75.
Medical costs against premiums
MixedBenefit expense ratio 90.6%, Q3 FY2026
The ratio was 90.6% in Q3 FY2026, against 91.3% a year earlier; the company credited better results in Medicare Advantage and individual ACA plans. On Sep 10, 2026 it guided to 90.2%, plus or minus 0.5 points, for full-year 2026.
Status: Mixed, partly on track.
Carelon Services
WorkingOperating revenue $28.3 billion, FY2025
Carelon Services' operating revenue rose from $10.1 billion in FY2021 to $28.3 billion in FY2025, and its operating gain from $187 million to $960 million. In Q3 FY2026 revenue was $7.7 billion, against $7.3 billion a year earlier.
Status: Working, on track against what the company said.
CarelonRx
WorkingOperating gain $2.4 billion, FY2025
CarelonRx's operating revenue rose from $25.4 billion in FY2021 to $43.4 billion in FY2025, and its operating gain from $1.7 billion to $2.4 billion. Adjusted scripts were 82.6 million in Q3 FY2026, 2.8% fewer than a year earlier.
Status: Working, on track against what the company said.
Medicare Advantage
Mixed1.9 million members, Sep 30, 2026
Medicare Advantage members fell 15.5% in a year, to 1.9 million at Sep 30, 2026. About 49% of members are in plans rated 4 stars or more in the ratings released in October 2026, against about 55% a year before; star ratings decide Medicare bonus payments.
Status: Mixed, partly on track.
Medicaid
Mixed8.2 million members, Sep 30, 2026
Medicaid members fell from 11.6 million at the end of FY2022 to 8.2 million at Sep 30, 2026. Medicaid revenue was $15.0 billion in Q3 FY2026, against $14.2 billion a year earlier.
Status: Mixed, partly on track.
Status compares progress with what the company itself said it would do: Working = on track against what the company said; Mixed = partly on track; Behind = behind the company's own plan; New = recently announced; Early = too early to judge.
17The company's own measures (non-GAAP)
17The company's own measures · FY2023 to FY2025, and Q3 FY2026 (quarter ended Sep 30, 2026)
What do Elevance Health's own measures show?
Official (GAAP): Diluted EPS, FY2025
$25.21
Company's own measure: Adjusted diluted EPS, FY2025
$30.29
Elevance leaves out, per share before tax, $2.80 of amortization of acquired intangibles, $2.91 of net losses on financial instruments, $1.05 of transaction and integration costs and smaller items, then takes off $1.79 of tax on them.
Official (GAAP): Shareholders' net income, FY2025
$5.7B
Company's own measure: Adjusted shareholders' net income, FY2025
$6.8B
Same definition, in dollars.
Official (GAAP): Diluted EPS, FY2024
$25.68
Company's own measure: Adjusted diluted EPS, FY2024
$33.04
Also leaves out $2.97 a share of litigation costs, mainly the provider antitrust settlement accrual, and $1.21 for businesses sold, and takes out a $0.86 gain on a sale.
Official (GAAP): Diluted EPS, FY2023
$25.22
Company's own measure: Adjusted diluted EPS, FY2023
$33.14
Same definition, including business optimization charges of $719 million before tax that year.
Official (GAAP): Diluted EPS, first nine months of FY2026
$21.01
Company's own measure: Adjusted diluted EPS, first nine months of FY2026
$27.06
Leaves out $4.28 a share for the $935 million accrual tied to the CMS notice. A year earlier, adjusted EPS was $26.88 and diluted EPS $22.67.
Official (GAAP): Diluted EPS, Q3 FY2026
$6.27
Company's own measure: Adjusted diluted EPS, Q3 FY2026
$6.99
Same definition. A year earlier, adjusted EPS was $6.03 and diluted EPS $5.32. The company said the quarter included a net non-operating benefit of $1.85 a share.
Official (GAAP): Total debt (short and long term), Sep 30, 2026
30,757.0%
Company's own measure: Debt-to-capital ratio, Sep 30, 2026
40.7%
As stated by the company: total debt ÷ (total debt + total equity), which it calls a non-GAAPThe company's own "adjusted" numbers, not the official (GAAP) ones. Always read them next to the official figure. Learn more measure. It was 42.1% at Dec 31, 2025; its credit facility caps it at 60%.
These are the company's own measures, defined by the company. They are not comparable across companies, and they are not added together. Each sits beside the nearest official (GAAP) figure.
Learn: Non-GAAP measures: what a company's "adjusted" numbers leave out
Sources (7)
- Form 10-K, fiscal year 2025 (ended Dec 31, 2025)
- Q4 FY2025 earnings release (8-K Ex. 99.1, Jan 28, 2026)
- Q4 FY2024 earnings release (8-K Ex. 99.1, Jan 23, 2025)
- Q4 FY2022 earnings release (8-K Ex. 99.1, Jan 25, 2023)
- Form 10-K, fiscal year 2022 (ended Dec 31, 2022)
- Q3 FY2026 earnings release (8-K Ex. 99.1, Oct 21, 2026)
- Form 10-Q, Q3 FY2026 (quarter ended Sep 30, 2026)
18Financial strength: investments, debt, capital
18Financial strength · Dec 31, 2025
How strong is Elevance Health's balance sheet?
What the premiums are invested in
- Bonds (fixed maturity securities)$27.0B
70.0% of the investments listed
- Other invested assets$10.8B
28.1% of the investments listed
- Stocks (equity securities)$740M
1.9% of the investments listed
Shares of the portfolio: Cityfort calculation from the FY2025 10-K, each type ÷ the total listed.
- Book value per share
- $198.81
- shareholders' equity per share at the end of FY2025, as reported
- Return on equity
- 13.3%
- net income as % of average shareholders' equity, as reported
- Investments
- $38.6B
- money held in bonds, stocks and cash until claims are paid
- Debt
- $32.0B
- borrowings on the balance sheet
- Shareholders' equity
- $43.9B
- what the company owns minus what it owes
- Debt to capital
- 42.1%
- debt ÷ (debt + equity), as reported by the company
- Members
- 45.2 million
- people covered at the end of FY2025, as reported
The company put regulators' risk-based capital requirement at about $9.1 billion at Dec 31, 2025, and its insurance and HMO subsidiaries, other than those regulated by California's DMHC, held $22.6 billion of statutory capital and surplus. Debt to capital is the company's own measure: total debt ÷ (total debt + total equity). At Sep 30, 2026 it was 40.7%, with total debt of $30.8 billion and cash of $10.3 billion.
Figures at Dec 31, 2025, consolidated, as reported by the company in its 10-K and earnings release; see the dates on each source.
19Who owns it
19Who owns it · ownership as of Mar 13, 2026
Who owns Elevance Health?
- Officers and directors (as a group), shares
- 0.4%
Share classes
Holders of 5% or more
From the company's proxy statement (DEF 14A), later Schedule 13G filings and the share counts on its latest annual or quarterly report. Each holder row shows the date of its own filing.
Insider trades · Form 4 data as of Nov 6, 2026
What did Elevance Health's insiders report trading?
Elevance Health's insiders made 34 Form 4A filing an insider must make within two business days of buying or selling the company's shares. Learn more filings in the 12 months to Nov 6, 2026.
They reported 4 purchases (6,725 shares) and 19 sales (17,157 shares) in the open market or privately (codes P and S).
None of the sales were on forms with the Rule 10b5-1 plan box checked.
The same filings report 52 other share transactions (A: 28, F: 22, M: 2).
They also report 10 transactions in options, stock units or other derivatives.
Insiders are a company's officers, directors and owners of more than 10% of a class of its shares. Most changes in their holdings must be reported to the SEC on a Form 4 within two business days. Source: SEC Form 4 filings on EDGAR.
- P
- a purchase in the open market or privately
- S
- a sale in the open market or privately
- A
- a grant, award or other acquisition from the company under Rule 16b-3
- F
- shares withheld or handed over to pay an exercise price or tax when an award is received, exercised or vests
- M
- exercise or conversion of an option or other derivative, exempt under Rule 16b-3
Code meanings: General Instruction 8 of Form 4 (SEC).
The latest 25 of 75 transactions
Shares: A = acquired, D = disposed of. A price the filing gives only in a footnote shows as “See filing”. The 10b5-1 box is checked when at least one trade on the form was made under a Rule 10b5-1 plan. A Form 4/A replaces the form it amends. See all of Elevance Health's Form 4 filings on EDGAR.
Learn: How to read a proxy statement (DEF 14A): Nvidia's 2026 proxy · Form 4 insider filings: who files, the codes and the footnotes · Rule 10b5-1 trading plans: how insiders pre-schedule their trades
Sources (5)
- Form 10-Q, Q3 FY2026 (quarter ended Sep 30, 2026)
- 2026 proxy statement (DEF 14A, annual meeting May 13, 2026)
- Form 10-K, fiscal year 2025 (ended Dec 31, 2025)
- Schedule 13G by Vanguard Capital Management (7.13%, event date Mar 31, 2026)
- Schedule 13G/A by The Vanguard Group (0 shares after internal realignment)
20What it does with profit
20What it does with profit
What does Elevance Health do with its profit?
Dividend per share
$6.84FY2025
Dividend paid for each share, by financial year.
$ per share
See the numbers
Buyback · Dec 31, 2021
FY2021: paid $1.9 billion for its own shares.
$1.9B
Buyback · Dec 31, 2022
FY2022: paid $2.3 billion for its own shares.
$2.3B
Buyback · Dec 31, 2023
FY2023: paid $2.7 billion for its own shares.
$2.7B
Buyback · Dec 31, 2024
FY2024: paid $2.9 billion for its own shares.
$2.9B
Buyback · Dec 31, 2025
FY2025: paid $2.6 billion for 7.4 million of its own shares.
$2.6B
21Governance signals
21Governance signals
What do Elevance Health's governance filings show?
- Auditor
- Ernst & Young LLP, since 1944
- Auditor changes
- None in the period covered
- Audit qualifications
- None reported
- Related-party dealings
- The 2026 proxy describes a written policy: transactions over $120,000 a year with directors, executive officers, 5% holders or their families must be approved or ratified by the board's Governance Committee. The proxy reports no related-person transaction involving Compensation and Talent Committee members in 2025.
- Credit rating
- S&P Global Ratings, Fitch Ratings, Moody's and AM Best (as stated in Elevance's Q3 FY2026 10-Q) A- / BBB+ / Baa2 / bbb+ (Outlooks not stated in the filing), Sep 30, 2026
A credit rating describes the company's ability to repay debt. It is not a rating of the share.
Flags to know about
regulatory
CMS notice on Medicare Advantage data, closed without sanctions
On Feb 27, 2026, CMS notified Elevance that it intended to impose sanctions over Medicare Advantage risk-adjustment data submissions, including a suspension of enrollment. Elevance accrued $935 million in Q1 FY2026 and paid CMS $342 million on May 27, 2026. On Jul 13, 2026, CMS wrote that the required steps were completed, sanctions would not be imposed and the matter was closed; $593 million stayed accrued at Sep 30, 2026.
regulatory
Department of Justice False Claims Act case
In March 2020 the DOJ sued in United States v. Anthem, Inc., alleging that the company falsely certified the accuracy of Medicare Advantage diagnosis data. The company says the suit is without merit. Fact discovery is due to finish by Nov 20, 2026 and expert discovery by Aug 2, 2027.
other
Shareholder lawsuits over 2024 guidance
A securities class action filed in May 2025 (Miller v. Elevance Health) alleges false and misleading statements about 2024 earnings guidance. In September 2026 the court let parts of the claims proceed. Three related derivative suits are pending. The company says the cases are without merit.
other
Blue Cross Blue Shield antitrust cases
Suits since 2012 allege that the Blue association and its plans divided markets. The plans settled with subscribers (approved September 2022) and providers (approved August 2025), and Elevance made its provider payment in September 2025. Cases by parties that opted out remain, and one California case is set for trial in March 2027.
other
S&P rating lowered
S&P's rating was A in the Q3 FY2025 10-Q filed Oct 21, 2025 and A- in the FY2025 10-K filed Feb 6, 2026. The filings do not give the date of the change.
shares as collateral
Elevance stock as loan collateral
The insider trading policy bars directors and executive officers from hedging Elevance stock, using margin accounts or using the stock as collateral for loans. The 2026 proxy's ownership table discloses no such arrangements.
disclosure
What Elevance does not report
It gives no revenue figure for any single state Medicaid customer, no return on equity and no outlooks or action dates for its credit ratings.
22What the market paid
22What the market paid · price as of Nov 5, 2026
What did the market pay for Elevance Health on Nov 5, 2026?
Price as of Nov 5, 2026 (shown for education; prices change daily).
Price as of Nov 5, 2026: $432.00, the close shown in Nasdaq's historical price table for Elevance Health; the shares list on the NYSE, and this price is from Nasdaq's site, not NYSE's. Times 216.1 million shares (Oct 15, 2026), that is a market value of about $93.3 billion (Cityfort calculation from the Nov 5, 2026 closing price and the Q3 FY2026 10-Q cover). P/E is price ÷ earnings per share: 18.4 on diluted EPS of $23.45 for the four quarters to Sep 30, 2026 (Cityfort calculation from the Q4 FY2025 to Q3 FY2026 earnings releases). That EPS includes the $935 million CMS accrual in Q1 FY2026. Price to book is 2.09 on book value of $206.75 a share at Sep 30, 2026 (Cityfort calculation from the Q3 FY2026 10-Q). The $1.72 quarterly dividend, $6.88 a year, is 1.59% of this price.
- Share price
- $432.00
- Market value (market cap)
- $93.3B
- P/E
- 18.4×
- P/B
- 2.1×
More price-based ratios · as of Nov 5, 2026
Each ratio divides a number from the company's filings by the market value or share price on Nov 5, 2026. Prices change daily, so these ratios do too.
Price to sales (P/S)
0.5×
$93.3B market value ÷ $201.8B revenue (four quarters to Sep 30, 2026) = 0.5×
Cityfort calculation from the Nov 5, 2026 closing price and the Q4 FY2025 to Q3 FY2026 earnings releases. Source: Nasdaq historical price table for ELV (NYSE-listed), close Nov 5, 2026; Form 10-Q, Q3 FY2026 (quarter ended Sep 30, 2026); Q3 FY2026 earnings release (8-K Ex. 99.1, Oct 21, 2026) and 3 more
How price ratios workDividend yield
1.58%
$6.84 dividends per share (FY2025) ÷ $432.00 share price = 1.58%
Cityfort calculation from the FY2025 10-K and the Nov 5, 2026 closing price. Source: Nasdaq historical price table for ELV (NYSE-listed), close Nov 5, 2026; Form 10-Q, Q3 FY2026 (quarter ended Sep 30, 2026); Q3 FY2026 earnings release (8-K Ex. 99.1, Oct 21, 2026) and 4 more
What dividend yield means
Shares used for the market value: 216.06 million ($432.00 × 216.06 million shares ≈ $93.3B). Source: Form 10-Q, Q3 FY2026 (quarter ended Sep 30, 2026); 2026 proxy statement (DEF 14A, annual meeting May 13, 2026); Form 10-K, fiscal year 2025 (ended Dec 31, 2025)
Source: Nasdaq historical price table for ELV (NYSE-listed), close Nov 5, 2026; Form 10-Q, Q3 FY2026 (quarter ended Sep 30, 2026); Q3 FY2026 earnings release (8-K Ex. 99.1, Oct 21, 2026) and 3 more
Sources (8)
- Nasdaq historical price table for ELV (NYSE-listed), close Nov 5, 2026
- Form 10-Q, Q3 FY2026 (quarter ended Sep 30, 2026)
- Q3 FY2026 earnings release (8-K Ex. 99.1, Oct 21, 2026)
- Q2 FY2026 earnings release (8-K Ex. 99.1, Jul 15, 2026)
- Q1 FY2026 earnings release (8-K Ex. 99.1, Apr 22, 2026)
- Q4 FY2025 earnings release (8-K Ex. 99.1, Jan 28, 2026)
- Form 10-K, fiscal year 2025 (ended Dec 31, 2025)
- 2026 proxy statement (DEF 14A, annual meeting May 13, 2026)
23How it got here
23How it got here
How did Elevance Health get here?
2001
Milestone
Incorporated as Anthem in Indiana
The company was incorporated in Indiana on Jul 17, 2001; SEC records list it as Anthem Inc from December 2001.
2004
Milestone
Named WellPoint
SEC records list the company as WellPoint from Nov 30, 2004 until November 2014; the name Anthem, Inc. appears from Dec 2, 2014.
2012
Business-model change
Amerigroup bought
The company bought Amerigroup Corporation, a Medicaid health plan business, in 2012, as the 10-K's executive biographies state.
2020
Crisis
DOJ False Claims Act suit
The Department of Justice sued in March 2020, alleging inaccurate Medicare Advantage diagnosis data. The case is still in discovery.
2022
Milestone
Renamed Elevance Health
SEC records list the name Anthem, Inc. until Jun 24, 2022, then Elevance Health, Inc. The NYSE ticker is ELV.
2023
Business-model change
Carelon segments reported
From January 2023 Elevance reports four segments: Health Benefits, CarelonRx, Carelon Services and Corporate & Other.
2025
Crisis
2025 guidance cut
On Jul 17, 2025 Elevance cut its 2025 adjusted EPS guide from $34.15 to $34.85 to about $30.00. The benefit expense ratio reached 90.0% for the year.
2026
Crisis
CMS notice, then closure
CMS said on Feb 27, 2026 that it intended to impose sanctions over Medicare Advantage data. On Jul 13, 2026 it said sanctions would not be imposed and closed the matter.
Sources (6)
- Form 10-K, fiscal year 2025 (ended Dec 31, 2025)
- EDGAR company submissions for Elevance Health (CIK 0001156039)
- Form 10-Q, Q3 FY2026 (quarter ended Sep 30, 2026)
- Form 10-K, fiscal year 2023 (ended Dec 31, 2023)
- Q2 FY2025 earnings release (8-K Ex. 99.1, Jul 17, 2025)
- Form 8-K (Item 8.01), CMS notice of intended Medicare Advantage sanctions
24Sources and changes
Where every number on this page comes from
Sources (23 documents)
- S1Form 10-K, fiscal year 2025 (ended Dec 31, 2025) · Elevance Health, Inc. (SEC EDGAR) · Tier 1: company or exchange filing · Feb 6, 2026
- S3Form 10-K, fiscal year 2023 (ended Dec 31, 2023) · Elevance Health, Inc. (SEC EDGAR) · Tier 1: company or exchange filing · Feb 21, 2024
- S4Form 10-K, fiscal year 2022 (ended Dec 31, 2022) · Elevance Health, Inc. (SEC EDGAR) · Tier 1: company or exchange filing · Feb 15, 2023
- S5Form 10-Q, Q3 FY2026 (quarter ended Sep 30, 2026) · Elevance Health, Inc. (SEC EDGAR) · Tier 1: company or exchange filing · Oct 21, 2026
- S6Q3 FY2026 earnings release (8-K Ex. 99.1, Oct 21, 2026) · Elevance Health, Inc. (SEC EDGAR) · Tier 1: company or exchange filing · Oct 21, 2026
- S7Q2 FY2026 earnings release (8-K Ex. 99.1, Jul 15, 2026) · Elevance Health, Inc. (SEC EDGAR) · Tier 1: company or exchange filing · Jul 15, 2026
- S8Q1 FY2026 earnings release (8-K Ex. 99.1, Apr 22, 2026) · Elevance Health, Inc. (SEC EDGAR) · Tier 1: company or exchange filing · Apr 22, 2026
- S9Q4 FY2025 earnings release (8-K Ex. 99.1, Jan 28, 2026) · Elevance Health, Inc. (SEC EDGAR) · Tier 1: company or exchange filing · Jan 28, 2026
- S10Q3 FY2025 earnings release (8-K Ex. 99.1, Oct 21, 2025) · Elevance Health, Inc. (SEC EDGAR) · Tier 1: company or exchange filing · Oct 21, 2025
- S11Q2 FY2025 earnings release (8-K Ex. 99.1, Jul 17, 2025) · Elevance Health, Inc. (SEC EDGAR) · Tier 1: company or exchange filing · Jul 17, 2025
- S12Q1 FY2025 earnings release (8-K Ex. 99.1, Apr 22, 2025) · Elevance Health, Inc. (SEC EDGAR) · Tier 1: company or exchange filing · Apr 22, 2025
- S13Q4 FY2024 earnings release (8-K Ex. 99.1, Jan 23, 2025) · Elevance Health, Inc. (SEC EDGAR) · Tier 1: company or exchange filing · Jan 23, 2025
- S14Q4 FY2022 earnings release (8-K Ex. 99.1, Jan 25, 2023) · Elevance Health, Inc. (SEC EDGAR) · Tier 1: company or exchange filing · Jan 25, 2023
- S152026 proxy statement (DEF 14A, annual meeting May 13, 2026) · Elevance Health, Inc. (SEC EDGAR) · Tier 1: company or exchange filing · Mar 27, 2026
- S16Form 8-K (Item 8.01), CMS notice of intended Medicare Advantage sanctions · Elevance Health, Inc. (SEC EDGAR) · Tier 1: company or exchange filing · Mar 2, 2026
- S17Form 8-K (Items 5.02, 7.01), Carelon president transition; 2026 guidance reaffirmed · Elevance Health, Inc. (SEC EDGAR) · Tier 1: company or exchange filing · Feb 26, 2026
- S20Form 8-K (Item 7.01), 2026 guidance reaffirmed (Sep 10, 2026) · Elevance Health, Inc. (SEC EDGAR) · Tier 1: company or exchange filing · Sep 10, 2026
- S21Form 8-K (Items 2.02, 7.01), preliminary Q1 2025 results and 2025 guidance (Apr 17, 2025) · Elevance Health, Inc. (SEC EDGAR) · Tier 1: company or exchange filing · Apr 17, 2025
- S23Schedule 13G/A by The Vanguard Group (0 shares after internal realignment) · The Vanguard Group (SEC EDGAR) · Tier 1: company or exchange filing · Mar 26, 2026
- S24Schedule 13G by Vanguard Capital Management (7.13%, event date Mar 31, 2026) · Vanguard Capital Management (SEC EDGAR) · Tier 1: company or exchange filing · Apr 29, 2026
- S25Form 10-Q, Q3 FY2025 (quarter ended Sep 30, 2025) · Elevance Health, Inc. (SEC EDGAR) · Tier 1: company or exchange filing · Oct 21, 2025
- S26Nasdaq historical price table for ELV (NYSE-listed), close Nov 5, 2026 · Nasdaq, Inc. · Tier 1: company or exchange filing · Nov 6, 2026
- S27EDGAR company submissions for Elevance Health (CIK 0001156039) · SEC EDGAR · Tier 1: company or exchange filing · Nov 7, 2026
Changes to this page (v1 · Nov 6, 2026)
- v1 · Nov 6, 2026First version, through Q3 FY2026 (quarter ended Sep 30, 2026). (first version)
Numbers come only from tier 1 and tier 2 sources. Read how we research.
Disclaimer
For learning only. Cityfort is not a registered investment adviser or broker-dealer and does not recommend buying or selling any security. Prices shown are dated and may be out of date.
Investing in securities involves risk, including loss of capital. Before making any investment decision, do your own research and consider consulting a registered investment adviser or other qualified professional.
Cityfort, its owners and contributors may or may not hold securities of companies covered. Cityfort is not paid by any company it covers. Content is not an offer or solicitation to buy or sell any security, including in any initial public offering.
Read the positions policyRead the full disclaimerHide the full disclaimer
Cityfort publishes general educational content that explains how listed companies work. Cityfort is not registered with the US Securities and Exchange Commission or any state securities regulator as an investment adviser, and is not a broker-dealer or a member of FINRA. Cityfort does not provide investment, tax or legal advice, recommendations, ratings, price targets or any opinion on whether to buy, sell or hold any security. Nothing on the site is tailored to any person's circumstances.
All information is taken from publicly available sources, mainly company filings with the SEC, which are listed on each page with dates. We work to keep it accurate and correct errors publicly, but we do not guarantee that it is complete, accurate or up to date. Any market price or price-based ratio shown is dated, may be out of date by the time you read it, and is included only to explain concepts.
Statements by company management, including forward-looking statements and guidance, are reported as the company's statements, with their date and source; they are not our forecasts. Adjusted (non-GAAP) figures are the company's own measures and are shown next to the official (GAAP) figures.