Health Care · NASDAQ: GEHC
GE HealthCare: how the business works
GE HealthCare makes medical scanners, imaging drugs and patient monitors for hospitals, with $20.6 billion of revenue in FY2025.
By Hardik Bhandare · Checked against filings: . Editorial policy. Corrections
Follow GE HealthCare
Email me when GE HealthCare's page is updated after earnings.
We'll send a confirmation email first. See our privacy policy.
GE HealthCare Technologies Inc. · Chicago, Illinois
Updated for Q3 FY2026 · checked
- Revenue, FY2025
- $20.6B
- Net income attributable to GE HealthCare, FY2025
- $2.08B
- Backlog, Sep 30, 2026
- $23.7B
- Employees (company statement, Oct 2026)
- About 54,000
- Separate listed company since
- Jan 2023
The short version
GE HealthCare in 5 points
1 · What it sells
GE HealthCare sells CT, MRI, X-ray and ultrasound scanners, imaging drugs, patient monitors and service on installed machines, with revenue of $20.6 billion in FY2025.
2 · Who pays it
In FY2025, hospitals and clinics buying equipment and drugs paid 66.2% of GE HealthCare's revenue, and owners of installed machines paid 33.8% for service contracts and repairs.
3 · What it keeps from $100
Of every $100 that came in during FY2025, GE HealthCare kept $9.9 as profit for shareholders, a figure that includes $445 million of pension and other non-operating income, while EBITDAOperating profit before wear-and-tear charges (depreciation and amortization). As a margin: per $100 of sales. was $16.2 per $100 of revenue.
4 · Where the operating profit comes from
In FY2025, Advanced Visualization Solutions earned $1.18 billion of segment EBIT, Imaging $891 million, Pharmaceutical Diagnostics $872 million and Patient Care Solutions $209 million.
5 · The one thing to watch
Net debt rose from $5.5 billion at Dec 31, 2025 to $7.1 billion at Sep 30, 2026 after the $2.3 billion Intelerad purchase (Cityfort calculation from the FY2025 10-K and the Q3 FY2026 10-Q), and the company said on Oct 28, 2026 it expects the $945 million SOFIE deal to close in the first half of 2027.
Sources: From GE HealthCare's FY2025 10-K, the Q3 FY2026 10-Q and the Q3 FY2026 earnings release · checked
01Where the money goes · FY2025
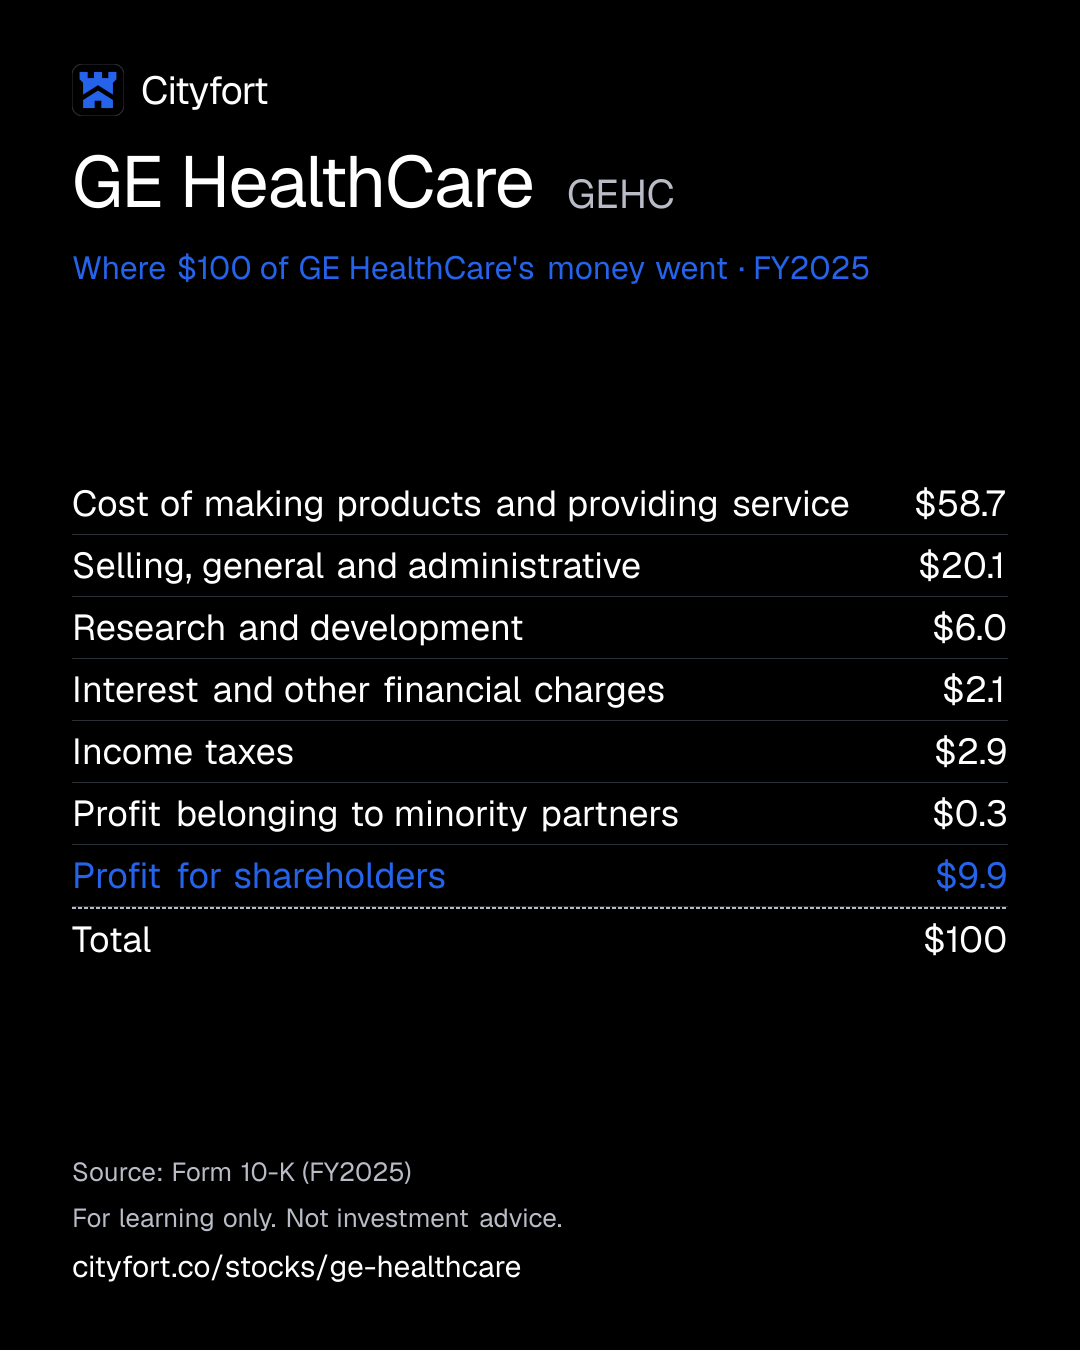
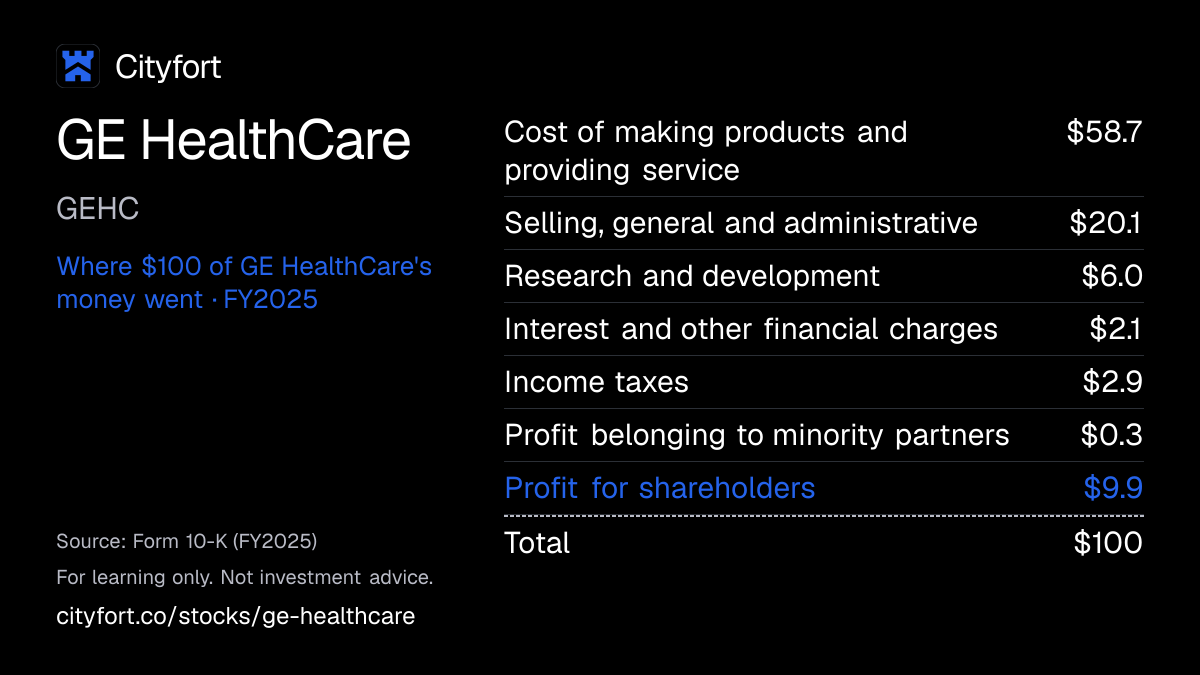
Where does $100 of GE HealthCare's money go?
GE HealthCare · FY2025
Receipt for every $100
| Cost of making products and providing service | $58.7 |
|---|---|
| Selling, general and administrative | $20.1 |
| Research and development | $6.0 |
| Interest and other financial charges | $2.1 |
| Income taxes | $2.9 |
| Profit belonging to minority partners | $0.3 |
| Profit for shareholders | $9.9 |
| Total | $100 |
Each line = amount ÷ total money in × 100. Lines may not add to exactly $100 because of rounding.
How this is worked out
Cityfort calculation from the FY2025 10-K: each line divided by total money in (revenue plus $445 million of other income).
Save this receipt as an image
Embed this receipt or the key numbers
Paste this code into a blog or website to show the card you choose, with a link back to this page.
Each week: the next company due to report earnings, explained in 5 points.
No tips. Unsubscribe anytime.
We'll send a confirmation email. See our privacy policy.
02The business in one line
What does GE HealthCare do?
Hospitals pay GE HealthCare for scanners, imaging drugs and service contracts; most of the money goes on making and servicing them, and $9.9 of every $100 was left as profit in FY2025.
- Hospitals and clinics paid $13.7 billion for machines, drugs and software in FY2025, and $7.0 billion for service on machines already installed.
- Making the products and delivering service cost $12.4 billion; sales, administration and research took another $5.5 billion.
03Who pays it
Who pays GE HealthCare?
Hospitals and clinics buying equipment and drugs
66.2%
of revenue
Public, private, academic and government hospitals and health systems, and researchers, in more than 160 countries. Product sales were $13.7 billion in FY2025.
Owners of installed machines paying for service
33.8%
of revenue
Service contracts and repairs brought in $7.0 billion in FY2025, up 5.6% from FY2024.
Who funds the hospitals
Share of revenue not disclosed
Hospitals are paid by government programs such as Medicare and Medicaid and by private health plans; the 10-K says these payers have become more cost-conscious.
- Hospitals and clinics buying equipment and drugs66.2%
- Owners of installed machines paying for service33.8%
How spread out the customers are
No single customer was more than 10% of revenue in FY2023, FY2024 or FY2025, or more than 10% of money owed to the company.
Sources (1)
04How it makes money
How does GE HealthCare make money?
GE HealthCare sells a scanner once, then keeps earning from service contracts and imaging drugs used with its machines.
Services were $7.0 billion, or 33.8% of FY2025 revenue, and $10.7 billion of contracted service work was still to be delivered at Dec 31, 2025. The imaging-drug segment kept $30.1 of segment profit per $100 of FY2025 sales, against $9.6 for scanners.
Services share of revenue (Cityfort calculation from the FY2025 10-K)
32.9%33.8%
FY2023 to FY2025
- A hospital buys a scanner or monitor
- It signs a service contract for upkeep and repairs
- Doctors inject contrast agents or tracers before many scans
- Software stores and reads the images
- Service, drug and consumable sales keep coming in
- Cash pays for research on the next machines
↺ Step 6 feeds back into step 1.
Sources (1)
05Business segments · FY2025
Which businesses make up GE HealthCare?
Imaging
44.8%CT, MRI, X-ray, mammography and molecular imaging scanners. Segment EBIT (the company's own segment profit measure) was $891 million, or $9.6 per $100 of sales. From Q2 FY2026 it reports as Radiology inside Advanced Imaging Solutions (AIS).
Revenue $9.2B ($9,245M) · Operating profit $891M
Advanced Visualization Solutions (AVS)
26%Ultrasound and systems that guide procedures. Segment EBIT was $1.18 billion, or $22.0 per $100 of sales. Merged with Imaging into AIS from Q2 FY2026; AIS sold $3.87 billion in Q3 FY2026, up 6.1%.
Revenue $5.4B ($5,354M) · Operating profit $1.2B ($1,175M)
Patient Care Solutions (PCS)
15%Patient monitors, ECG, anesthesia and newborn care. Segment EBIT fell to $209 million from $347 million in FY2024. Q3 FY2026 sales were $793 million, up 8.5% from a year earlier.
Revenue $3.1B ($3,086M) · Operating profit $209M
Pharmaceutical Diagnostics (PDx)
14.1%Contrast agents and radioactive tracers for scans. Segment EBIT was $872 million, or $30.1 per $100 of sales. Q3 FY2026 sales were $846 million, up 13.0%.
Revenue $2.9B ($2,900M) · Operating profit $872M
Other
0.2%HealthCare Financial Services, a small financing business.
Revenue $40M · Operating profit $7M
How the mix changed
- Imaging
- Advanced Visualization Solutions (AVS)
- Patient Care Solutions (PCS)
- Pharmaceutical Diagnostics (PDx)
- Other
Revenue by segment, FY2023 to FY2025.
US$
See the numbers
06The numbers · Consolidated · US$
How has GE HealthCare done?
Revenue
$20.6BFY2025
Revenue rose from $19.6 billion in FY2023 to $20.6 billion in FY2025, and Q3 FY2026 revenue was $5.5 billion, up 7.2% from $5.1 billion a year earlier.
US$
See the numbers
Net income
$2.1BFY2025
Net income rose from $1.4 billion for common stockholders in FY2023 to $2.1 billion in FY2025, and was $615 million in Q3 FY2026 against $446 million a year earlier.
US$
See the numbers
Net income for every $100 of revenue
$10.1FY2025
EBITDA per $100 of revenue was $15.6 in FY2023, $16.2 in FY2025 and $17.6 in Q3 FY2026. EBITDA is operating income plus depreciation and amortization (Cityfort calculation from the FY2024 and FY2025 10-Ks and, by quarter, from the Q3 FY2024 to Q3 FY2026 earnings releases).
Net margin: $ of net income per $100 of revenue
See the numbers
Free cash flow
$1.5BFY2025
Free cash flow fell from $1.71 billion in FY2023 to $1.51 billion in FY2025. It is cash from operations minus spending on property, equipment and software, the definition GE HealthCare also uses.
US$ · cash from operations minus spending on plants and equipment
See the numbers
See all yearly numbers
EBITDA here = operating income plus depreciation and amortization (from the cash flow statement). Fiscal years are the company's own: Fiscal year ends Dec 31 (the calendar year). Net income is the share belonging to the company's owners.
Learn: Fiscal years that don't end in December: Nvidia's FY2027 explained · Stock-based compensation and dilution: pay that becomes shares
Sources (21)
- Form 10-K for FY2023
- Form 10-K for FY2025
- Form 10-K for FY2024
- Q4 and FY2024 earnings release (8-K Ex. 99.1)
- Q3 FY2024 earnings release (8-K Ex. 99.1)
- Form 10-Q for Q1 FY2024
- Q1 FY2025 earnings release (8-K Ex. 99.1)
- Form 10-Q for Q2 FY2024
- Q2 FY2025 earnings release (8-K Ex. 99.1)
- Form 10-Q for Q3 FY2024
- Form 10-Q for Q1 FY2025
- Form 10-Q for Q2 FY2025
- Form 10-Q for Q3 FY2025
- Q3 FY2025 earnings release (8-K Ex. 99.1)
- Q4 and FY2025 earnings release (8-K Ex. 99.1)
- Form 10-Q for Q1 FY2026
- Q1 FY2026 earnings release (8-K Ex. 99.1)
- Form 10-Q for Q2 FY2026
- Q2 FY2026 earnings release (8-K Ex. 99.1)
- Form 10-Q for Q3 FY2026
- Q3 FY2026 earnings release (8-K Ex. 99.1)
07Who runs it
Who runs GE HealthCare, and did they deliver?
Peter J. Arduini
President and CEO, director
George Newcomb
Interim CFO · since 2026
Controller since Feb 2016 and Chief Accounting Officer. Named interim CFO on Jul 23, 2026; Jay Saccaro stayed with the company through Aug 14, 2026. A search for a permanent CFO is under way.
H. Lawrence Culp Jr.
Independent Chairman
Also Chairman and CEO of GE Aerospace.
Kevin M. O'Neill
President and CEO, Pharmaceutical Diagnostics
Neal Sandy
President and CEO, Patient Care Solutions · since 2026
From Nov 16, 2026, replacing Jeannette Bankes, who left for a CEO role at a public company.
Taha Kass-Hout
Chief Science and Technology Officer
What they said, and what happened
2 too early to tell · 1 delivered
Said on Feb 4, 2026
Management said on Feb 4, 2026 that it expected FY2026 adjusted EPS of $4.95 to $5.15.
Too early to tellWhat happened
The company lowered the range to $4.80 to $5.00 on Apr 29, 2026 and raised it to $4.95 to $5.05 on Oct 28, 2026. FY2026 results are not yet reported.
Said on Feb 4, 2026
Management said on Feb 4, 2026 that it expected about $1.7 billion of free cash flowCash from operations minus spending on buildings and equipment. Learn more in FY2026.
Too early to tellWhat happened
Lowered to about $1.6 billion on Apr 29, 2026 and stated as $1.6 billion or more on Oct 28, 2026.
Said on Feb 4, 2026
Management said on Feb 4, 2026 that it expected the planned $2.3 billion Intelerad purchase to close in the first half of 2026.
DeliveredWhat happened
The purchase closed on Mar 18, 2026 for about $2.29 billion in cash, net of cash acquired.
Sources (7)
08What could go wrong
What could go wrong for GE HealthCare?
- Execution
Patient Care Solutions profit
PCS segment EBIT fell from $383 million in FY2023 to $209 million in FY2025, and the segment lost $26 million in Q2 FY2026 before earning $68 million in Q3.
Watch PCS sales and segment EBIT in the FY2026 results, the first under new PCS chief Neal Sandy.
- Pricing
Tariffs and cost inflation
The company said tariffs cut FY2025 operating income by about $245 million. In July 2026 it cited about $250 million of inflation from memory chips, oil, freight and other components.
Watch Tariff costs, tariff refunds and cost inflation reported with the FY2026 results.
- Demand
China sales
China region revenue fell 15% in FY2024 and 4.6% in FY2025. The 10-K says China uses volume-based buying to hold down healthcare costs.
Watch China region revenue in the region table of each 10-Q.
- Debt
Debt after acquisitions
Net debt rose from $5.5 billion at Dec 31, 2025 to $7.1 billion at Sep 30, 2026 (Cityfort calculation from the FY2025 10-K and the Q3 FY2026 10-Q), after the $2.3 billion Intelerad purchase. The company said on Oct 28, 2026 that the $945 million SOFIE deal is expected to close in the first half of 2027.
Watch Total borrowings and cash in the FY2026 10-K.
- Raw-material prices
Raw materials and single suppliers
The company relies on helium, iodine and rare earth minerals, and on several single- or sole-source suppliers with no alternative yet identified. Management said a PDx supplier issue hurt Q1 FY2026 profit and has since been resolved.
Watch Supply problems named in the earnings releases.
- Legal
Lawsuit and a possible IRS tax assessment
A lawsuit alleges GE HealthCare and other companies funded an Iraqi terrorist group through Iraqi health-ministry contracts. According to the Q3 FY2026 10-Q, GE informed the company that the IRS may assert a material amount of additional taxes and penalties for 2016 to 2020. Any such amount is to be allocated between GE and GE HealthCare under their Tax Matters Agreement.
Watch The legal and indemnity notes in the FY2026 10-K.
- Execution
Leadership changes
Controller George Newcomb was named interim CFO on Jul 23, 2026; Jay Saccaro stayed with the company through Aug 14, 2026, and a permanent CFO is being sought. Patient Care Solutions got a new chief on Nov 16, 2026.
Watch An 8-K naming a permanent CFO.
Sources (8)
09Supporters vs. critics
What do supporters and critics point to?
What supporters point to
- Services were $7.0 billion, or 33.8% of FY2025 revenue, and $10.7 billion of contracted service work was still to be delivered at Dec 31, 2025 (Cityfort calculation of the share from the FY2025 10-K).
- Backlog, ordered work not yet delivered, was $23.7 billion at Sep 30, 2026. Orders were 1.15 times revenue in Q2 FY2026 and 1.03 times in Q3 FY2026.
- Pharmaceutical Diagnostics sales rose 13.0% to $846 million in Q3 FY2026, and the segment kept $30.1 of segment EBIT per $100 of FY2025 sales (Cityfort calculation from the FY2025 10-K).
- Revenue was $5,513 million in Q3 FY2026, against $5,143 million in Q3 FY2025.
- No single customer was more than 10% of revenue in FY2023, FY2024 or FY2025.
What critics point to
- Patient Care Solutions segment EBIT fell from $383 million in FY2023 to $209 million in FY2025, and the segment lost $26 million in Q2 FY2026.
- Net debt rose from $5.5 billion at Dec 31, 2025 to $7.1 billion at Sep 30, 2026 after the Intelerad purchase (Cityfort calculation from the FY2025 10-K and the Q3 FY2026 10-Q).
- China region revenue fell from $2.79 billion in FY2023 to $2.25 billion in FY2025.
- The company said tariffs cut FY2025 operating income by about $245 million. On Apr 29, 2026 it lowered its FY2026 adjusted EPS range, citing higher memory-chip, oil and freight costs.
- The company's free cash flow (non-GAAP; operating cash flow minus capital spending) fell from $1,715 million in FY2023 to $1,505 million in FY2025, per the FY2024 and FY2025 10-Ks.
10What to watch next
What should you watch next at GE HealthCare?
Next event
Q4 FY2026 results (expected, based on the Feb 4, 2026 date for Q4 FY2025)
Feb 4, 2027
Expected, based on last year's date
FY2026 results against the company's ranges
Management said on Oct 28, 2026 that it expects FY2026 adjusted EPS of $4.95 to $5.05 and free cash flow of $1.6 billion or more. The Q4 FY2026 release will show the reported figures.
Patient Care Solutions under a new chief
Neal Sandy has led PCS since Nov 16, 2026. Segment EBIT was a $26 million loss in Q2 FY2026 and $68 million in Q3.
A permanent CFO
Controller George Newcomb was named interim CFO on Jul 23, 2026; Jay Saccaro stayed with the company through Aug 14, 2026. An 8-K would name a permanent CFO.
SOFIE deal and debt
The company said on Oct 28, 2026 that it expects the $945 million SOFIE purchase to close in the first half of 2027. Net debt was $7.1 billion at Sep 30, 2026 (Cityfort calculation from the Q3 FY2026 10-Q).
11Key dates
What are the key dates for GE HealthCare?
| Event | Date | Source |
|---|---|---|
| Fiscal 2026 ends | Form 10-K for FY2025 | |
| SOFIE Biosciences acquisition expected to closeFirst half of 2027, subject to regulatory approvals, the company said in its Q3 FY2026 earnings release (Oct 28, 2026). | Not yet stated | Q3 FY2026 earnings release (8-K Ex. 99.1); Form 10-Q for Q3 FY2026 |
Learn: Fiscal years that don't end in December: Nvidia's FY2027 explained
12Key facts
Key facts about GE HealthCare
- What does GE HealthCare do?
- GE HealthCare Technologies makes CT, MRI, X-ray and ultrasound scanners, the contrast agents and tracers injected before scans, and patient monitors. It has been a separate company, listed on Nasdaq, since its spin-off from General Electric on Jan 3, 2023.
- How does GE HealthCare make money?
- GE HealthCare earned $13.7 billion from selling products and $7.0 billion from service contracts and repairs in FY2025, out of $20.6 billion of revenue.
- Who are GE HealthCare's customers?
- GE HealthCare sells to public, private, academic and government hospitals, health systems and researchers in more than 160 countries. No single customer was more than 10% of its revenue in FY2023, FY2024 or FY2025.
- How big is GE HealthCare?
- GE HealthCare had revenue of $20,625 million in FY2025, up from $19,672 million in FY2024. Net income attributable to GE HealthCare was $2,084 million in FY2025, against $1,993 million in FY2024.
- Where does GE HealthCare sell?
- In FY2025, the US and Canada brought in 46.2% of GE HealthCare's revenue, Europe, the Middle East and Africa 26.3%, the China region 10.9% and the rest of the world 16.6%.
- Which GE HealthCare business keeps the most profit per sale?
- GE HealthCare's imaging-drug segment, Pharmaceutical Diagnostics, kept $30.1 of segment EBIT per $100 of FY2025 sales, against $9.6 for its Imaging scanner segment (Cityfort calculation from the FY2025 10-K).
- Who owns GE HealthCare?
- GE HealthCare has one class of stock and no controlling holder. Its 2026 proxy statementThe yearly filing about shareholder votes, the board and executive pay. Learn more lists The Vanguard Group at 11.5%, BlackRock at 7.9%, Dodge & Cox at 6.8% and Capital Research Global Investors at 5.5%, based on 13G filings from Nov 2024 to Feb 2026. Directors and executive officers held 0.36% (Cityfort calculation from the 2026 proxy statement and the FY2025 10-K).
Terms on this page
- Backlog
- Capital expenditures (capex)
- Debt-to-equity
- Earnings per share (EPS)
- EBITDA
- Free cash flow
- Net debt
- Net margin
- Remaining performance obligations (RPO)
- Revenue vs net income
Each explains the term in plain English, with the same number from other companies on Cityfort.
Go deeper
More detail from the same filings. Open any section.
13What it sells
13What it sells
What does GE HealthCare sell?
Imaging scanners
CT, MRI, X-ray, mammography and molecular imaging (PET and SPECT) machines. This Imaging segment sold $9.2 billion in FY2025.
Ultrasound and procedure guidance
Ultrasound machines for general and pregnancy care, and imaging systems that guide surgeons and heart doctors during procedures. Sales were $5.4 billion in FY2025.
Imaging drugs
Contrast agents and radioactive tracers injected so organs show up clearly on a scan; they also work with other makers' scanners. Sales were $2.9 billion in FY2025.
Patient care equipment
Bedside monitors, heart tests (ECG), anesthesia machines and newborn care equipment, plus their consumables and service. Sales were $3.1 billion in FY2025.
Service
Upkeep and repair contracts on machines already installed. Sales of services were $7.0 billion of the $20.6 billion FY2025 revenue.
Think of it like this
Like a carmaker that also runs the service garage: the machine is sold once, and the upkeep contract keeps paying for years.
What it does
- Does: Makes CT, MRI, X-ray, ultrasound and PET scanners
- Does: Sells contrast agents and tracers used during scans
- Does: Services the machines it has sold, under contracts
- Does: Sells imaging software, including Intelerad's cloud tools since Mar 2026
What it does not do
- Does not: It is not part of General Electric: it has been a separate listed company since Jan 3, 2023
- Does not: It does not run hospitals or scan centers; they are its customers
- Does not: It does not depend on one big buyer: no customer was more than 10% of revenue in FY2023 to FY2025
Sources (1)
14How the money flows
14How the money flows · FY2025
How does money flow through GE HealthCare?
Money in
- Revenue (products and services)$20.6B
- Pension and other non-operating income$445M
The company
GE HealthCare
$21.1B came in
Money out
- Cost of making products and providing service$12.4B
- Selling, general and administrative$4.2B
- Research and development$1.3B
- Interest and other financial charges$440M
- Income taxes$614M
- Profit belonging to minority partners$70M
- Net income attributable to GE HealthCare$2.1B
- Hospitals and clinics paid $20.6 billion for machines, drugs, software and service in FY2025.
- Making the products and delivering the service cost $12.4 billion.
- Sales teams, administration and research took another $5.5 billion.
- Pension and other income added $445 million; interest and income taxes took $1.05 billion.
- About $2.1 billion was left for GE HealthCare's shareholders, after $70 million for minority partners.
Sources (1)
15What it needs to run
15What it needs to run
What does GE HealthCare need to run?
Engineers and scientists
About 11,100 engineers and scientists work on research; research and development cost $1.26 billion in FY2025.
Sales and service staff
About 9,700 sales professionals and 8,900 field service engineers sell the machines and keep them running.
Raw materials
Helium, iodine and rare earth minerals; the 10-K says their supply and prices have been volatile.
Single-source suppliers
The 10-K says it has multiple single- or sole-source suppliers with no alternatives yet identified.
Plants and offices
It owns or leases over 300 facilities, with major centers near Milwaukee, Paris, Bangalore and Shanghai.
Sources (1)
16Where it sells
16Where it sells · FY2025
Where does GE HealthCare sell?
- US and Canada (USCAN)46.2%
- Europe, Middle East and Africa26.3%
- China region10.9%
- Rest of world16.6%
Sources (1)
17Competitors and what protects it
17Competitors and what protects it
Who does GE HealthCare compete with?
Siemens Healthineers
Named in the FY2025 10-K as a primary global competitor. The 10-K says competition centers on cost-effectiveness, price, service, product performance and technology.
Philips Healthcare
Named in the FY2025 10-K as a primary global competitor.
United Imaging
Named in the FY2025 10-K as a primary global competitor.
Canon
Named in the FY2025 10-K as a primary global competitor.
Bayer
Named in the FY2025 10-K, with Bracco, Guerbet and Curium, as a main competitor of the Pharmaceutical Diagnostics segment.
What protects the business
Each strength is scored 1 (weak) to 5 (strong) for the business, with the reason. It is not a rating of the share.
- Installed base and service4 of 5
Services were $7.0 billion, or 33.8% of FY2025 revenue, delivered by about 8,900 field service engineers.
- Global reach4 of 5
Customers in more than 160 countries; USCAN (US and Canada) was $9.5 billion of the $20.6 billion FY2025 revenue.
- Imaging drugs3 of 5
The drugs also work with other makers' scanners, and the segment kept $30.1 of segment profit per $100 of FY2025 sales.
- Research scale3 of 5
About 11,100 engineers and scientists; research and development cost $1.26 billion in FY2025.
Weak spot
Patient Care Solutions
PCS segment EBIT fell from $383 million in FY2023 to $209 million in FY2025, and the segment lost $26 million in Q2 FY2026.
Sources (2)
18Where growth could come from
18Where growth could come from
Where could GE HealthCare's growth come from?
Management said on Oct 28, 2026 that it expects FY2026 organic revenue growth of 4.0%, an adjusted EBIT margin of 15.5% to 15.7% and adjusted EPS of $4.95 to $5.05. On Apr 29, 2026 it had lowered the EPS range to $4.80 to $5.00, from $4.95 to $5.15 given on Feb 4, citing higher memory-chip, oil and freight costs.
Intelerad imaging software
New$2.3 billion deal, closed Mar 18, 2026
GE HealthCare bought Intelerad, an imaging-software company; the company said the deal advances its cloud-enabled enterprise imaging. Its goodwill sits in the AIS segment.
Status: New, recently announced.
Imaging drugs (PDx)
Working+13.8% organic, Q3 FY2026
PDx sales were $846 million in Q3 FY2026, against $749 million a year earlier. Sales rose 15.6% in FY2025, a figure that includes buying the rest of Nihon Medi-Physics.
Status: Working, on track against what the company said.
Orders and backlog
WorkingBacklog $23.7 billion, Sep 30, 2026
Backlog is ordered work not yet delivered. Orders were 1.15 times revenue (book-to-bill) in Q2 FY2026 and 1.03 times in Q3 FY2026.
Status: Working, on track against what the company said.
Patient Care Solutions
Mixed+8.8% organic, Q3 FY2026
PCS sales fell 13.5% on an organic basis in Q2 FY2026, then rose 8.8% in Q3. Management said on Jul 29, 2026 that it was focused on returning PCS to growth and profitability and was reviewing strategic options for the business.
Status: Mixed, partly on track.
SOFIE radiopharmaceuticals
New$945 million, agreed Oct 5, 2026
SOFIE makes PET tracers for other companies under contract. GE HealthCare said in its Q3 FY2026 earnings release (Oct 28, 2026) that it expects the deal to close in the first half of 2027, subject to regulatory approvals.
Status: New, recently announced.
China
MixedChina region -4.6%, FY2025
China region revenue fell from $2.79 billion in FY2023 to $2.25 billion in FY2025. It was $586 million in Q3 FY2026, up 7.1%.
Status: Mixed, partly on track.
Status compares progress with what the company itself said it would do: Working = on track against what the company said; Mixed = partly on track; Behind = behind the company's own plan; New = recently announced; Early = too early to judge.
19The company's own measures (non-GAAP)
19The company's own measures · FY2025 and Q3 FY2026
What do GE HealthCare's own measures show?
Official (GAAP): Operating income, FY2025
$2.8B
Company's own measure: Adjusted EBIT, FY2025
$3.2B
GE HealthCare leaves out amortization of acquisition intangibles ($156 million), restructuring ($120 million), spin-off and separation costs ($38 million) and other items.
Official (GAAP): Diluted EPS, FY2025
$4.55
Company's own measure: Adjusted EPS, FY2025
$4.59
The same kinds of items are left out, after tax.
Official (GAAP): Diluted EPS, Q3 FY2026
$1.36
Company's own measure: Adjusted EPS, Q3 FY2026
$1.34
In Q3 FY2026 the adjusted figure was below GAAP EPS.
Official (GAAP): Reported revenue growth, FY2025
4.8%
Company's own measure: Organic revenue growth, FY2025
3.5%
The company's own growth measure; PDx's reported growth of 15.6% included the Nihon Medi-Physics purchase, against organic growth of 8.8%.
Official (GAAP): Cash from operations, FY2025
$2.0B
Company's own measure: Free cash flow, FY2025
$1.5B
Cash from operations minus $482 million spent on property, equipment and internal-use software.
Official (GAAP): Remaining performance obligations, Sep 30, 2026
$16.1B
Company's own measure: Backlog, Sep 30, 2026
$23.7B
Backlog is the company's measure of orders not yet delivered. Remaining performance obligationsSigned contracts with customers that have not been billed yet., the GAAP figure for contracted work still to be done, were $16.11 billion at Sep 30, 2026 ($5.35 billion for products, $10.76 billion for services), as stated in the Q3 FY2026 10-Q. The two are never added.
These are the company's own measures, defined by the company. They are not comparable across companies, and they are not added together. Each sits beside the nearest official (GAAP) figure.
Learn: Non-GAAP measures: what a company's "adjusted" numbers leave out
20Financial strength and debt
20Financial strength · Sep 30, 2026
How much debt does GE HealthCare have?
- Total debt$10.0B
- Cash and investments$2.9B
- Net debt (debt minus cash)$7.1B
- Net worth (shareholders' money)$11.6B
- Debt to equity
- 0.86×
- $ of debt for every $1 of shareholders' money
- Net debt is total borrowings of $9.97 billion minus $2.85 billion of cash, cash equivalents and restricted cash (Cityfort calculation from the Q3 FY2026 10-Q). It was $5.5 billion at Dec 31, 2025 (Cityfort calculation from the FY2025 10-K), before the $2.3 billion Intelerad purchase in March 2026.
- Goodwill and other intangible assets were $17.0 billion, or 44.2% of total assets of $38.4 billion at Sep 30, 2026 (Cityfort calculation from the Q3 FY2026 10-Q).
- The Q3 FY2026 earnings release states $3.5 billion of access to revolving credit lines at Sep 30, 2026.
- Long-term pension and other employee benefit obligations (non-current compensation and benefits) were $5.1 billion at Sep 30, 2026.
21Who owns it
21Who owns it · ownership as of Mar 9, 2026
Who owns GE HealthCare?
- Officers and directors (as a group), shares
- 0.4%
Share classes
Holders of 5% or more
From the company's proxy statement (DEF 14A), later Schedule 13G filings and the share counts on its latest annual or quarterly report. Each holder row shows the date of its own filing.
Learn: How to read a proxy statement (DEF 14A): Nvidia's 2026 proxy · Form 4 insider filings: who files, the codes and the footnotes
22What it does with profit
22What it does with profit
What does GE HealthCare do with its profit?
Dividend per share
$0.14FY2025
Dividend paid for each share, by financial year.
$ per share
See the numbers
No buybacks or fund raises in the period covered.
Sources (1)
23Governance signals
23Governance signals
What do GE HealthCare's governance filings show?
- Auditor
- Deloitte & Touche LLP, since 2022
- Auditor changes
- None in the period covered
- Audit qualifications
- None reported
- Related-party dealings
- The FY2025 10-K says GE (now GE Aerospace) continues to be considered a related party due to board member affiliation; GE HealthCare's chairman, H. Lawrence Culp Jr., is GE Aerospace's chairman and CEO. According to the Q3 FY2026 10-Q, GE informed the company that the IRS may assert a material amount of additional taxes and penalties on GE's 2016 to 2020 consolidated US returns. Those returns include GE HealthCare, and any such amount is to be allocated between the two under their Tax Matters Agreement.
- Credit rating
- Moody's, S&P Global Ratings and Fitch Ratings, as stated in GE HealthCare's Q3 FY2025 10-Q Baa2 (Moody's) / BBB (S&P) / BBB (Fitch), unchanged since the spin-off (outlook Stable (all three)), Oct 22, 2025
A credit rating describes the company's ability to repay debt. It is not a rating of the share.
Flags to know about
disclosure · Oct 28, 2026
Credit ratings last stated in Oct 2025
The FY2025 10-K and the Q3 FY2026 10-Q do not state the ratings; the ratings shown are from the Q3 FY2025 10-Q, as of Oct 22, 2025.
other · Oct 28, 2026
Anti-Terrorism Act lawsuit over Iraq contracts
Since 2017, US service members, civilians and their families have sued drug and device makers, including GE HealthCare, in federal court in Washington, DC. They allege the companies funded an Iraqi terrorist group through sales to Iraq's Ministry of Health. The court dismissed the case in 2020; an appeal court reversed that, and a similar complaint was filed in Sep 2026.
24How it got here
24How it got here
How did GE HealthCare get here?
2023
Business-model change
Spun off from General Electric
GE HealthCare became a separate listed company on Jan 3, 2023; regular-way trading began on Jan 4, 2023.
2024
Milestone
Procedure guidance moved to ultrasound
From Jul 1, 2024 Image Guided Therapies moved from Imaging to the ultrasound segment, renamed Advanced Visualization Solutions.
2024
Milestone
Two software purchases
GE HealthCare bought MIM Software and Intelligent Ultrasound Group in 2024.
2025
Milestone
Full ownership of Nihon Medi-Physics
It bought the remaining 50% of Nihon Medi-Physics. PDx's reported growth of 15.6% in FY2025 includes the purchase.
2025
Crisis
Tariffs raise costs
The company said tariffs cut FY2025 operating income by about $245 million.
2026
Milestone
Intelerad bought
The $2.3 billion purchase of the imaging-software company closed on Mar 18, 2026.
2026
Business-model change
Four segments become three
From Q2 FY2026, Imaging and AVS report together as Advanced Imaging Solutions, beside PDx and PCS, with past periods recast.
2026
Milestone
SOFIE deal agreed
On Oct 5, 2026 it agreed to buy PET tracer maker SOFIE Biosciences for $945 million in cash. The Q3 FY2026 10-Q (Oct 28, 2026) says the deal is expected to close in the first half of 2027.
25Sources and changes
Where every number on this page comes from
Sources (23 documents)
- S1Form 10-K for FY2025 · SEC EDGAR · Tier 1: company or exchange filing · Feb 4, 2026
- S2Form 10-K for FY2024 · SEC EDGAR · Tier 1: company or exchange filing · Feb 13, 2025
- S3Form 10-Q for Q3 FY2026 · SEC EDGAR · Tier 1: company or exchange filing · Oct 28, 2026
- S4Form 10-Q for Q2 FY2026 · SEC EDGAR · Tier 1: company or exchange filing · Jul 29, 2026
- S5Form 10-Q for Q1 FY2026 · SEC EDGAR · Tier 1: company or exchange filing · Apr 29, 2026
- S6Form 10-Q for Q3 FY2025 · SEC EDGAR · Tier 1: company or exchange filing · Oct 29, 2025
- S7Form 10-Q for Q2 FY2025 · SEC EDGAR · Tier 1: company or exchange filing · Jul 30, 2025
- S8Form 10-Q for Q1 FY2025 · SEC EDGAR · Tier 1: company or exchange filing · Apr 30, 2025
- S9Q3 FY2026 earnings release (8-K Ex. 99.1) · SEC EDGAR · Tier 1: company or exchange filing · Oct 28, 2026
- S10Q2 FY2026 earnings release (8-K Ex. 99.1) · SEC EDGAR · Tier 1: company or exchange filing · Jul 29, 2026
- S118-K of Jul 23, 2026: CFO transition and preliminary Q2 FY2026 revenue (Ex. 99) · SEC EDGAR · Tier 1: company or exchange filing · Jul 23, 2026
- S12Q1 FY2026 earnings release (8-K Ex. 99.1) · SEC EDGAR · Tier 1: company or exchange filing · Apr 29, 2026
- S13Q4 and FY2025 earnings release (8-K Ex. 99.1) · SEC EDGAR · Tier 1: company or exchange filing · Feb 4, 2026
- S14Q3 FY2025 earnings release (8-K Ex. 99.1) · SEC EDGAR · Tier 1: company or exchange filing · Oct 29, 2025
- S15Q2 FY2025 earnings release (8-K Ex. 99.1) · SEC EDGAR · Tier 1: company or exchange filing · Jul 30, 2025
- S16Q1 FY2025 earnings release (8-K Ex. 99.1) · SEC EDGAR · Tier 1: company or exchange filing · Apr 30, 2025
- S17Q4 and FY2024 earnings release (8-K Ex. 99.1) · SEC EDGAR · Tier 1: company or exchange filing · Feb 13, 2025
- S18Q3 FY2024 earnings release (8-K Ex. 99.1) · SEC EDGAR · Tier 1: company or exchange filing · Oct 30, 2024
- S192026 proxy statement (DEF 14A) · SEC EDGAR · Tier 1: company or exchange filing · Mar 19, 2026
- S23Form 10-Q for Q3 FY2024 · SEC EDGAR · Tier 1: company or exchange filing · Oct 30, 2024
- S24Form 10-Q for Q2 FY2024 · SEC EDGAR · Tier 1: company or exchange filing · Jul 31, 2024
- S25Form 10-Q for Q1 FY2024 · SEC EDGAR · Tier 1: company or exchange filing · Apr 30, 2024
- S26Form 10-K for FY2023 · SEC EDGAR · Tier 1: company or exchange filing · Feb 6, 2024
Changes to this page (v1 · Nov 20, 2026)
- v1 · Nov 20, 2026First version. (first version)
Numbers come only from tier 1 and tier 2 sources. Read how we research.
Disclaimer
For learning only. Cityfort is not a registered investment adviser or broker-dealer and does not recommend buying or selling any security. Prices shown are dated and may be out of date.
Investing in securities involves risk, including loss of capital. Before making any investment decision, do your own research and consider consulting a registered investment adviser or other qualified professional.
Cityfort, its owners and contributors may or may not hold securities of companies covered. Cityfort is not paid by any company it covers. Content is not an offer or solicitation to buy or sell any security, including in any initial public offering.
Read the positions policyRead the full disclaimerHide the full disclaimer
Cityfort publishes general educational content that explains how listed companies work. Cityfort is not registered with the US Securities and Exchange Commission or any state securities regulator as an investment adviser, and is not a broker-dealer or a member of FINRA. Cityfort does not provide investment, tax or legal advice, recommendations, ratings, price targets or any opinion on whether to buy, sell or hold any security. Nothing on the site is tailored to any person's circumstances.
All information is taken from publicly available sources, mainly company filings with the SEC, which are listed on each page with dates. We work to keep it accurate and correct errors publicly, but we do not guarantee that it is complete, accurate or up to date. Any market price or price-based ratio shown is dated, may be out of date by the time you read it, and is included only to explain concepts.
Statements by company management, including forward-looking statements and guidance, are reported as the company's statements, with their date and source; they are not our forecasts. Adjusted (non-GAAP) figures are the company's own measures and are shown next to the official (GAAP) figures.