Health Care · NYSE: HCA
HCA Healthcare: how the business works
HCA Healthcare runs 189 hospitals in 19 US states and England, with revenue of $75.6 billion in FY2025.
By Hardik Bhandare · Checked against filings: . Editorial policy. Corrections
Follow HCA Healthcare
Email me when HCA Healthcare's page is updated after earnings.
We'll send a confirmation email first. See our privacy policy.
HCA Healthcare, Inc. · Nashville, Tennessee · Founded 1968
Updated for Q3 FY2026 · checked
- Revenue, FY2025
- $75.6B
- Net income, FY2025
- $6.78B
- Hospitals, Sep 30, 2026
- 189
- Employees, FY2025 10-K
- About 320,000
- Operations began
- 1968
The short version
HCA Healthcare in 5 points
1 · What it sells
HCA Healthcare runs 189 hospitals and about 2,600 outpatient sites in 19 US states and England, and its hospitals admitted 2.3 million patients in FY2025.
2 · Who pays it
In Q3 FY2026, managed care and other insurers paid 48.3% of HCA's revenue, managed Medicare 17.8%, Medicare 14.7%, Medicaid 8.9%, managed Medicaid 4.8%, insurers in England 2.5% and other payers 3%.
3 · What it keeps from $100
Of every $100 that came in during FY2025, HCA kept $8.96 as net income, which includes non-operating gains such as $115 million of affiliates' earnings and facility-sale gains; its EBITDAOperating profit before wear-and-tear charges (depreciation and amortization). As a margin: per $100 of sales. (operating profit before interest, tax and wear and tear on assets) was $20.6 per $100 of revenue.
4 · Where the operating profit comes from
HCA reports no operating income line; by its own segment measure, the American Group earned $6.3 billion of Adjusted EBITDA in FY2025, the Atlantic Group $5.6 billion and the National Group $5.1 billion.
5 · The one thing to watch
HCA estimated that more uninsured patients cut Q3 FY2026 pre-tax income by about $400 million, and same-facility revenue per equivalent admission rose 0.6% in Q3 FY2026, after 6.4% in Q2.
Sources: From HCA Healthcare's FY2025 10-K, the Q3 FY2026 10-Q and the Q2 and Q3 FY2026 earnings releases · checked
01Where the money goes · FY2025
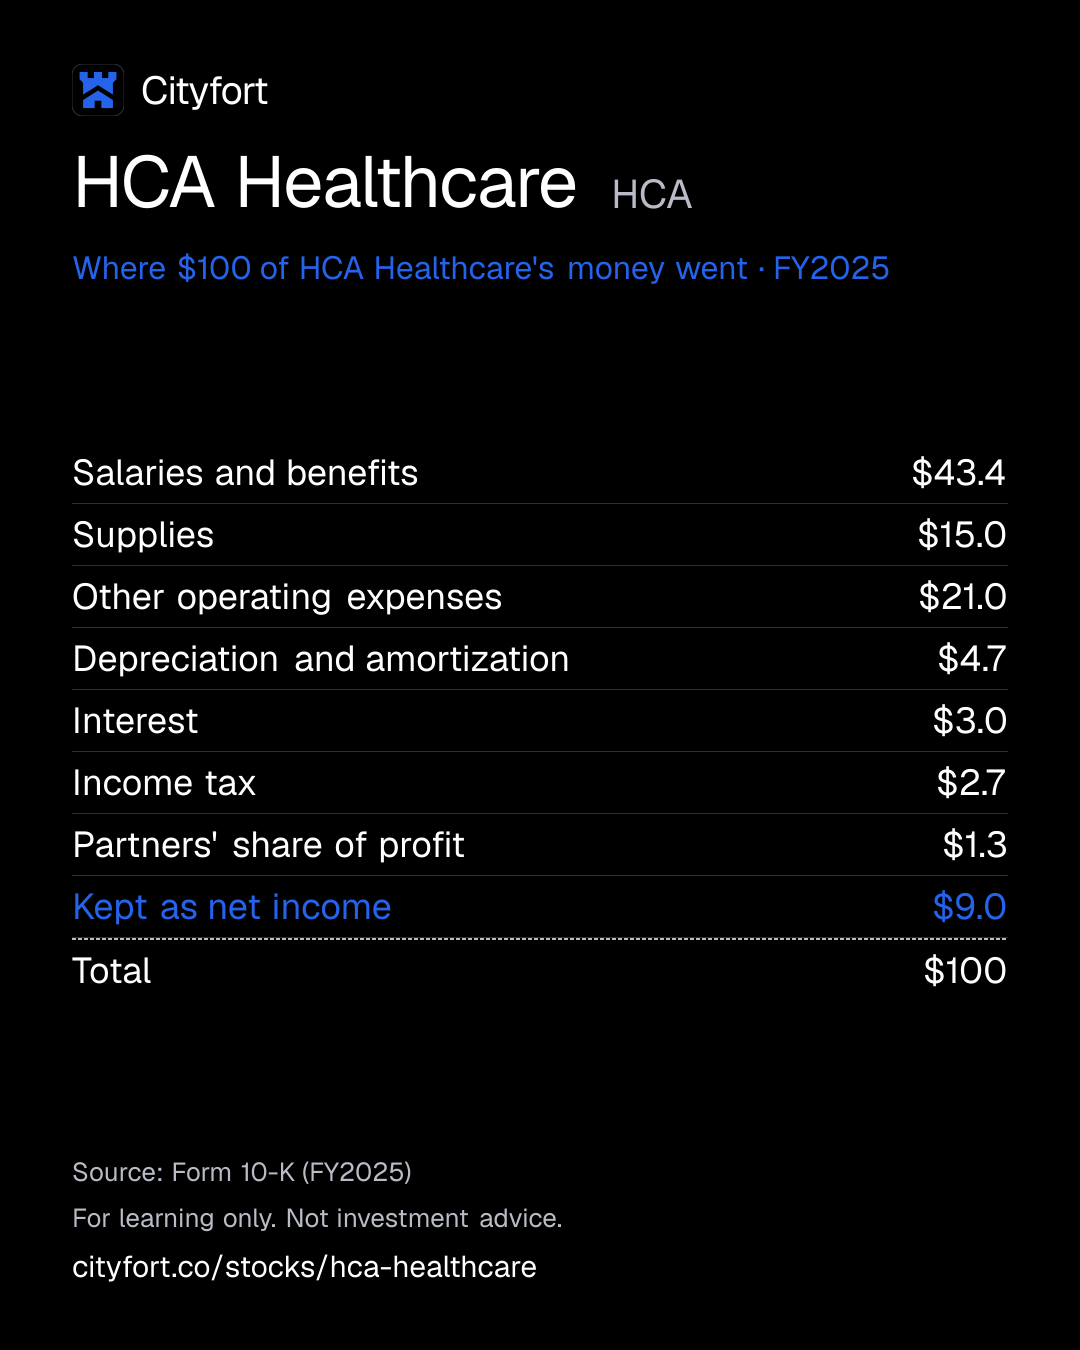
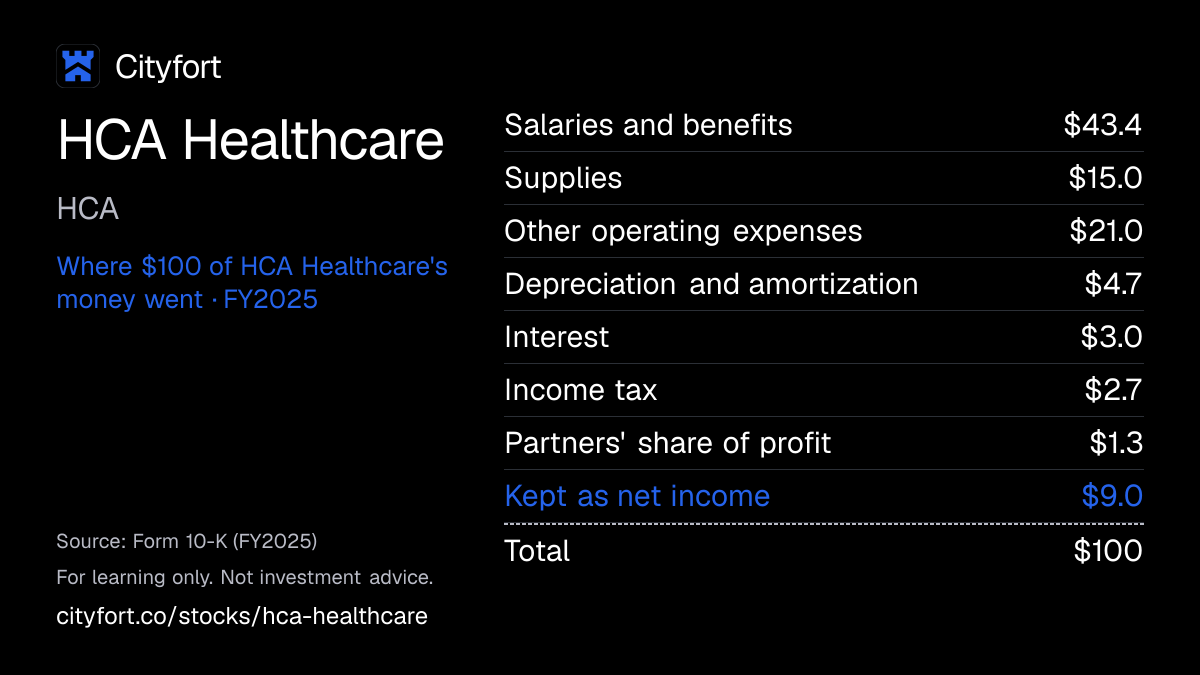
Where does $100 of HCA Healthcare's money go?
HCA Healthcare · FY2025
Receipt for every $100
| Salaries and benefits | $43.4 |
|---|---|
| Supplies | $15.0 |
| Other operating expenses | $21.0 |
| Depreciation and amortization | $4.7 |
| Interest | $3.0 |
| Income tax | $2.7 |
| Partners' share of profit | $1.3 |
| Kept as net income | $9.0 |
| Total | $100 |
Each line = amount ÷ total money in × 100. Lines may not add to exactly $100 because of rounding.
How this is worked out
Cityfort calculation from FY2025 10-K. Of every $100 that came in during FY2025 (revenue plus $115 million of affiliates' earnings and gains on facility sales): each line = line ÷ $75.7 billion × 100.
Save this receipt as an image
Embed this receipt or the key numbers
Paste this code into a blog or website to show the card you choose, with a link back to this page.
Each week: the next company due to report earnings, explained in 5 points.
No tips. Unsubscribe anytime.
We'll send a confirmation email. See our privacy policy.
02The business in one line
What does HCA Healthcare do?
Insurers and government programs pay HCA Healthcare to treat patients. In FY2025 staff pay took $43.40 of every $100, and $8.96 was left as net income.
- Private insurers paid 48.3% of Q3 FY2026 revenue; Medicare, Medicaid and the private plans that run them paid most of the rest.
- Total debt was $50.5 billion at Sep 30, 2026, and interest took $2.97 of every $100 that came in during FY2025.
03Who pays it
Who pays HCA Healthcare?
Managed care and insurers
48.3%
of revenue
Private health plans, including plans bought on the health insurance exchanges.
Managed Medicare
17.8%
of revenue
Private insurers running Medicare plans for people aged 65 and over.
Medicare
14.7%
of revenue
The federal program for people aged 65 and over, paying set rates per stay.
Medicaid
8.9%
of revenue
State programs for low-income patients, including supplemental payments.
Managed Medicaid
4.8%
of revenue
Private insurers running Medicaid plans for states.
International insurers
2.5%
of revenue
Managed care and insurers paying for care in England.
Other
3%
of revenue
All other payers.
- Managed care and insurers48.3%
- Managed Medicare17.8%
- Medicare14.7%
- Medicaid8.9%
- Managed Medicaid4.8%
- International insurers2.5%
- Other3%
How spread out the customers are
Shares are of Q3 FY2026 revenue. The FY2025 10-K says HCA has no significant revenue concentration with any single payer, though government programs are large.
04How it makes money
How does HCA Healthcare make money?
HCA earns a payment for each patient it treats, so profit depends on patient numbers, payment rates and staff costs.
Each admission or visit brings a payment set by Medicare or Medicaid, or agreed with an insurer. Staff pay took $43.40 of every $100 that came in during FY2025. Cash left after costs pays for new beds and outpatient sites.
Net income kept per $100 of revenue
$11.8$9.0
FY2021 to FY2025
- Patients arrive through emergency rooms, doctors and clinics
- HCA treats them and bills the insurer or government program
- The payer pays a set or agreed rate
- Staff, supplies and debt costs are paid
- Leftover cash funds new capacity, dividends and buybacks
↺ Step 5 feeds back into step 1.
05Business segments · FY2025
Which businesses make up HCA Healthcare?
American Group
35%66 hospitals in Colorado, central Kansas, Louisiana and Texas. Segment Adjusted EBITDA $6.3 billion.
Revenue $26.4B ($26,445M)
Atlantic Group
32.7%63 hospitals in Florida, Georgia, northern Kansas, Missouri and South Carolina. Segment Adjusted EBITDA $5.6 billion.
Revenue $24.7B ($24,709M)
National Group
28.1%53 hospitals in 10 states, from Alaska and California to Virginia. Segment Adjusted EBITDA $5.1 billion.
Revenue $21.3B ($21,278M)
Corporate and other
4.2%Includes the 8 hospitals in England and head-office costs.
Revenue $3.2B ($3,168M)
How the mix changed
- American Group
- Atlantic Group
- National Group
- Corporate and other
Revenue by segment, FY2023 to FY2025.
US$
See the numbers
Sources (1)
06The numbers · Consolidated · US$
How has HCA Healthcare done?
Revenue
$75.6BFY2025
Revenue rose every year, from $58.8 billion in FY2021 to $75.6 billion in FY2025.
US$
See the numbers
Net income
$6.8BFY2025
Net income attributable to HCA fell from $7.0 billion in FY2021 to $5.2 billion in FY2023, then rose to $6.8 billion in FY2025.
US$
See the numbers
Net income for every $100 of revenue
$9.0FY2025
EBITDA was $20.6 per $100 of revenue in FY2025, against $22.1 in FY2022, a year that included a $1.3 billion gain on facility sales.
Net margin: $ of net income per $100 of revenue
See the numbers
Free cash flow
$7.7BFY2025
Free cash flow fell to $4.1 billion in FY2022, then rose each year to $7.7 billion in FY2025.
US$ · cash from operations minus spending on plants and equipment
See the numbers
See all yearly numbers
EBITDA here = operating income plus depreciation and amortization (from the cash flow statement). Fiscal years are the company's own: Fiscal year ends Dec 31. Net income is the share belonging to the company's owners.
Learn: Fiscal years that don't end in December: Nvidia's FY2027 explained · Stock-based compensation and dilution: pay that becomes shares
Sources (22)
- Form 10-K for FY2021
- Form 10-K for FY2022
- Form 10-K for FY2024
- Form 10-K for FY2023
- Form 10-K for FY2025
- Form 10-Q for Q1 FY2024
- Q1 FY2025 earnings release (8-K Ex. 99.1)
- Form 10-Q for Q2 FY2024
- Q2 FY2025 earnings release (8-K Ex. 99.1)
- Form 10-Q for Q3 FY2024
- Q3 FY2025 earnings release (8-K Ex. 99.1)
- Q4 FY2024 earnings release (8-K Ex. 99.1)
- Form 10-Q for Q1 FY2025
- Q1 FY2026 earnings release (8-K Ex. 99.1)
- Form 10-Q for Q2 FY2025
- Form 10-Q for Q3 FY2025
- Q4 FY2025 earnings release (8-K Ex. 99.1)
- Form 10-Q for Q1 FY2026
- Form 10-Q for Q2 FY2026
- Q2 FY2026 earnings release (8-K Ex. 99.1)
- Form 10-Q for Q3 FY2026
- Q3 FY2026 earnings release (8-K Ex. 99.1)
07Who runs it
Who runs HCA Healthcare, and did they deliver?
Samuel N. Hazen
Chief Executive Officer · since 2019
CEO since Jan 2019 and a director since 2018; CFO of HCA’s Western Group from 1995 to 2001, after earlier hospital finance roles. Owned 2,164,071 shares at Feb 23, 2026.
Michael A. Marks
Executive Vice President and Chief Financial Officer
Jon M. Foster
Executive Vice President and Chief Operating Officer
Michael S. Cuffe, M.D.
Executive Vice President and Chief Clinical Officer · since 2022
Thomas F. Frist III
Chairman of the Board
Son of HCA founder Dr. Thomas F. Frist, Jr.; the chair is separate from the CEO.
What they said, and what happened
1 delivered · 2 too early to tell
Said on Jan 24, 2025
2025 guidance: revenue of $72.80 billion to $75.80 billion and diluted EPS of $24.05 to $25.85.
DeliveredWhat happened
FY2025 revenue was $75.6 billion and diluted EPS $28.33, above the EPS range. The company updated its guidance on Jul 25 and Oct 24, 2025.
Said on Jan 27, 2026
2026 guidance: revenue of $76.5 billion to $80.0 billion and diluted EPS of $29.10 to $31.50.
Too early to tellWhat happened
Revised on Jul 14, 2026: the revenue range was narrowed to $77.0 billion to $79.5 billion (same midpoint) and the EPS range lowered to $28.70 to $30.50. On Oct 27, 2026 management said it expects results in the upper half of those ranges.
Said on Jan 27, 2026
2026 capital spending, excluding acquisitions, of $5.0 billion to $5.5 billion.
Too early to tellWhat happened
Kept unchanged in the revised guidance of Jul 14, 2026.
Sources (8)
08What could go wrong
What could go wrong for HCA Healthcare?
- Concentration
Half of revenue comes from Florida and Texas
The two states produced 51% of FY2025 revenue and 59% of admissions. Local economies, storms or state rules there weigh on results.
Watch Florida and Texas share of revenue in the next 10-K.
- Regulation
More patients without insurance
Enhanced premium tax credits for exchange plans expired at the end of 2025. The company estimated the shift to uninsured patients cut Q3 FY2026 pre-tax income by about $400 million.
Watch Uninsured admissions and payer mix in each quarterly release.
- Regulation
Reliance on state supplemental payments
Q2 FY2026 included $1.372 billion of Florida directed-payment revenue, about $980 million of it for earlier periods. The 10-Q lists changes to these programs as a risk.
Watch Medicaid supplemental payment amounts reported in each quarterly earnings release.
- Debt
Large and rising debt
Total debt rose from $43.0 billion at Dec 31, 2024 to $50.5 billion at Sep 30, 2026. Interest cost $2.2 billion in FY2025.
Watch Total debt and interest expense each quarter.
- Execution
Staff costs and unions
Salaries and benefits were $32.9 billion in FY2025, 43% of revenue. Workers at 35 hospitals were represented by unions, and the 10-K cites nursing and physician shortages.
Watch Salaries and benefits as a share of revenue.
- Competition
Competition from outpatient centers
The 10-K says freestanding surgery, emergency and imaging centers are increasing in its markets. It also says removing state certificate-of-need rules could lower barriers to entry and increase competition.
Watch Same-facility outpatient surgeries, down 3.7% in Q3 FY2026.
- Legal
Government investigations
The 10-K says some facilities have received government inquiries and may face investigations, including whistleblower suits under the False Claims Act.
Watch The contingencies note in each 10-Q and 10-K.
09Supporters vs. critics
What do supporters and critics point to?
What supporters point to
- Revenue rose every year, from $58.8 billion in FY2021 to $75.6 billion in FY2025.
- Free cash flow rose each year from $4.1 billion in FY2022 to $7.7 billion in FY2025.
- FY2025 diluted EPS was $28.33, above the $24.05 to $25.85 range management gave on Jan 24, 2025.
- Same-facility admissions rose 2.7% and emergency room visits 5.1% in Q3 FY2026 from a year earlier.
What critics point to
- Total debt rose from $43.0 billion at Dec 31, 2024 to $50.5 billion at Sep 30, 2026, and liabilities exceeded assets by $2.8 billion at Dec 31, 2025.
- Florida and Texas produced 51% of FY2025 revenue, so storms or state rule changes there reach a large part of the business.
- HCA estimated that more uninsured patients cut Q3 FY2026 pre-tax income by about $400 million.
- Q2 FY2026 revenue included $1.372 billion of Florida directed payments, about $980 million of it for earlier periods.
- Same-facility outpatient surgeries fell 3.7% in Q3 FY2026. On Jul 14, 2026 management lowered its 2026 EPS range to $28.70 to $30.50 and narrowed its revenue range to $77.0 billion to $79.5 billion.
10What to watch next
What should you watch next at HCA Healthcare?
Next event
Q4 FY2026 results
Date not announced yet.
Uninsured patients
HCA estimated that more uninsured patients cut Q3 FY2026 pre-tax income by about $400 million, after enhanced exchange tax credits expired at the end of 2025. The payer shares in each quarterly filing show how the mix moves.
Full-year 2026 against guidance
On Oct 27, 2026 management said it expects 2026 results in the upper half of its Jul 14, 2026 ranges: revenue of $77.0 billion to $79.5 billion and diluted EPS of $28.70 to $30.50.
Florida supplemental payments
Q2 FY2026 revenue included $1.372 billion of Florida directed payments, about $980 million for periods before 2026. The Q3 FY2026 10-Q lists changes to these state programs as a risk.
Debt and buybacks
Total debt was $50.5 billion at Sep 30, 2026. In Q3 FY2026 HCA paid $2,970 million for 7.23 million of its own shares, with $4,240 million of its authorization left.
11Key facts
Key facts about HCA Healthcare
- What does HCA Healthcare do?
- HCA Healthcare runs hospitals. At Sep 30, 2026 it operated 189 hospitals and about 2,600 outpatient sites, such as surgery centers, freestanding emergency rooms and clinics, in 19 US states and England. Its FY2025 10-K reports about 320,000 employees.
- How does HCA Healthcare make money?
- HCA Healthcare is paid for each patient it treats, at rates set by Medicare and Medicaid or agreed with insurers. Of every $100 that came in during FY2025, it spent $43.40 on salaries and benefits and kept $8.96 as net income.
- Who pays HCA Healthcare?
- In Q3 FY2026, managed care and other insurers paid 48.3% of HCA Healthcare's revenue, managed Medicare 17.8%, Medicare 14.7%, Medicaid 8.9%, managed Medicaid 4.8%, insurers in England 2.5% and other payers 3%.
- How big is HCA Healthcare?
- HCA Healthcare's FY2025 revenue was $75.6 billion and net income attributable to HCA was $6.8 billion, up from $70.6 billion and $5.8 billion in FY2024. In Q3 FY2026 revenue was $19,849 million and net income $1,579 million.
- Where does HCA Healthcare earn its revenue?
- HCA Healthcare's FY2025 revenue came from its American Group ($26,445 million), Atlantic Group ($24,709 million) and National Group ($21,278 million) of US hospitals, plus $3,168 million in corporate and other, which includes England. Florida and Texas produced 51% of its FY2025 revenue.
- Who owns HCA Healthcare?
- HCA Healthcare's 2026 proxy lists Frisco Holding II with 17.4% of the shares and Hercules Holding II with 15.5% at Feb 23, 2026; each is held by a private investor group that includes Frist family affiliates. Vanguard held 7.6% per a Feb 13, 2024 filing, and officers and directors as a group held 1.5%.
- How much debt does HCA Healthcare have?
- HCA Healthcare's total debt was $50.5 billion at Sep 30, 2026, up from $46.5 billion at Dec 31, 2025, against cash of $908 million. Its stockholders' deficit was $6.0 billion at Dec 31, 2025; counting partners' stakes in its hospitals, liabilities exceeded assets by $2.8 billion.
- Does HCA Healthcare pay a dividend?
- HCA Healthcare paid dividends of $2.88 per share in FY2025 and raised its quarterly dividend to $0.78 in Jan 2026. It also paid $10,067 million for its own shares in FY2025.
Terms on this page
- Capital expenditures (capex)
- Earnings per share (EPS)
- EBITDA
- Free cash flow
- Net debt
- Net margin
- Revenue vs net income
- Stock buyback
Each explains the term in plain English, with the same number from other companies on Cityfort.
Go deeper
More detail from the same filings. Open any section.
12What it sells
12What it sells
What does HCA Healthcare sell?
General hospitals
179 general acute care hospitals with 50,436 licensed beds at Dec 31, 2025. They admitted 2.3 million patients in FY2025.
Emergency rooms
Hospital and freestanding emergency rooms handled about 9.9 million visits in FY2025.
Surgery
545,405 surgeries on admitted patients and 1,022,812 outpatient surgeries in FY2025.
Outpatient sites
About 2,600 sites at Sep 30, 2026, including surgery centers, freestanding emergency rooms, urgent care centers and physician clinics.
Behavioral and rehabilitation hospitals
7 behavioral hospitals with 714 beds and 4 rehabilitation hospitals at Dec 31, 2025.
What it does
- Does: Owns and runs 189 hospitals in 19 states and England (Sep 30, 2026).
- Does: Bills insurers, Medicare and Medicaid for care given.
- Does: Runs surgery and endoscopy centers outside its hospitals.
What it does not do
- Does not: Does not sell health insurance; insurers and government programs are its payers.
- Does not: Does not get most of its revenue from patients paying cash.
- Does not: Does not operate outside the US except in England.
13How the money flows
13How the money flows · FY2025
How does money flow through HCA Healthcare?
Money in
- Revenue$75.6B
- Affiliates' earnings and gains on facility sales$115M
The company
HCA Healthcare
$75.7B came in
Money out
- Salaries and benefits$32.9B
- Supplies$11.4B
- Other operating expenses$15.9B
- Depreciation and amortization$3.5B
- Interest$2.2B
- Income tax and partners' share of profit$3.0B
- Net income attributable to HCA$6.8B
- Insurers, Medicare and Medicaid paid most of the $75.6 billion of FY2025 revenue.
- Staff pay and benefits took $32.9 billion, the largest cost.
- Supplies, other running costs and wear and tear on buildings took another $30.8 billion.
- Interest on debt took $2.2 billion; income tax took $2.1 billion.
- Partners who co-own some facilities took $998 million, leaving $6.8 billion for HCA.
Sources (1)
14What it needs to run
14What it needs to run
What does HCA Healthcare need to run?
People
About 320,000 employees, including about 90,000 part-time and as-needed staff. Employees at 35 US hospitals were represented by unions.
Hospital buildings and equipment
Property and equipment worth $31.1 billion after depreciation at Dec 31, 2025. It spent $4.9 billion on new property and equipment in FY2025.
Medical supplies
Supplies cost $11.4 billion in FY2025, about $15 of every $100 of revenue.
Licenses and approvals
Some states require a certificate of need, a state approval, before a hospital can expand or add services.
Sources (1)
15Where it sells
15Where it sells · FY2025
Where does HCA Healthcare sell?
- Texas27.7%
- Florida23.6%
- Other 17 states and England48.7%
Sources (1)
16Where growth could come from
16Where growth could come from
Where could HCA Healthcare's growth come from?
Management said on Oct 27, 2026 that it expects full-year 2026 results in the upper half of the ranges it issued on Jul 14, 2026: revenue of $77.0 billion to $79.5 billion and diluted EPS of $28.70 to $30.50.
More patients
WorkingSame-facility admissions +2.7%, Q3 FY2026
Admissions at hospitals open in both years rose 2.7% and emergency room visits 5.1% from Q3 FY2025.
Status: Working, on track against what the company said.
Revenue per patient
Mixed+0.6% in Q3 FY2026, after +6.4% in Q2
Same-facility revenue per equivalent admission (a per-patient measure that counts outpatient visits as well as hospital stays) rose 0.6% in Q3 FY2026, after 6.4% in Q2. The company estimated that more uninsured patients cut Q3 pre-tax income by about $400 million.
Status: Mixed, partly on track.
Medicaid supplemental payments
Working$1.372 billion added to Q2 FY2026 revenue
Q2 FY2026 included Florida directed-payment revenue for Oct 2024 to Jun 2026; about $980 million related to periods before 2026.
Status: Working, on track against what the company said.
Outpatient surgery
BehindSame-facility outpatient surgeries -3.7%, Q3 FY2026
Same-facility outpatient surgeries fell from a year earlier in each of the first three quarters of 2026.
Status: Behind, behind the company's own plan.
Status compares progress with what the company itself said it would do: Working = on track against what the company said; Mixed = partly on track; Behind = behind the company's own plan; New = recently announced; Early = too early to judge.
17The company's own measures (non-GAAP)
17The company's own measures · FY2025
What do HCA Healthcare's own measures show?
Official (GAAP): Net income attributable to HCA (GAAP), FY2025
$6.8B
Company's own measure: Adjusted EBITDA, FY2025
$15.6B
Leaves out depreciation and amortization, interest, income tax, gains or losses on facility sales, debt retirement losses and partners' share of profit.
Official (GAAP): Net income attributable to HCA (GAAP), Q3 FY2026
$1.6B
Company's own measure: Adjusted EBITDA, Q3 FY2026
$3.9B
Same definition; Q3 FY2026 included a $13 million gain on facility sales, which it leaves out.
Official (GAAP): Diluted EPS (GAAP), Q3 FY2026
$7.27
Company's own measure: Diluted EPS as adjusted, Q3 FY2026
$7.22
Leaves out gains or losses on facility sales, net of tax.
These are the company's own measures, defined by the company. They are not comparable across companies, and they are not added together. Each sits beside the nearest official (GAAP) figure.
Learn: Non-GAAP measures: what a company's "adjusted" numbers leave out
18Financial strength and debt
18Financial strength · Dec 31, 2025
How much debt does HCA Healthcare have?
- Total debt$46.5B
- Cash and investments$1.0B
- Net debt (debt minus cash)$45.5B
- Net worth (shareholders' money)−$6.0B
- Net debt is total debt less cash: a Cityfort calculation from FY2025 10-K. It counts borrowings only, not lease obligations.
- HCA had a stockholders' deficit of $6.0 billion at Dec 31, 2025. Counting partners' stakes in its hospitals (noncontrolling interests), liabilities exceeded assets by $2.8 billion, so debt-to-equity is not shown.
- At Sep 30, 2026 total debt was $50.5 billion and cash $908 million, net debt of $49.6 billion (Cityfort calculation from Q3 FY2026 earnings release).
- Notes due as late as 2095 made up $43.7 billion of debt at Dec 31, 2025, at rates averaging 5.1%.
19Who owns it
19Who owns it · ownership as of Feb 23, 2026
Who owns HCA Healthcare?
- Officers and directors (as a group), shares
- 1.5%
Share classes
Holders of 5% or more
From the company's proxy statement (DEF 14A), later Schedule 13G filings and the share counts on its latest annual or quarterly report. Each holder row shows the date of its own filing.
Learn: How to read a proxy statement (DEF 14A): Nvidia's 2026 proxy · Form 4 insider filings: who files, the codes and the footnotes
20What it does with profit
20What it does with profit
What does HCA Healthcare do with its profit?
Dividend per share
$2.88FY2025
Dividend paid for each share, by financial year.
$ per share
See the numbers
Buyback · Dec 31, 2024
FY2024: paid $6,042 million for its own shares.
$6.0B
Buyback · Dec 31, 2025
FY2025: paid $10,067 million for its own shares.
$10.1B
Buyback · Sep 30, 2026
Q3 FY2026: bought 7.23 million shares for $2,970 million; $4,240 million of its authorization was left.
$3.0B
21Governance signals
21Governance signals
What do HCA Healthcare's governance filings show?
- Auditor
- Ernst & Young LLP, since 1994
- Auditor changes
- None in the period covered
- Audit qualifications
- None reported
- Related-party dealings
- On Feb 6, 2026 HCA swapped 36.63 million shares delivered by Frisco, held by a private investor group that includes Frist family affiliates, for 36.56 million new shares; the proxy calls it part of a tax-free reorganization of Frisco. Relatives of the CEO and the Chief Clinical Officer are employees.
- Credit rating
- Not checked for this page
Flags to know about
other
Founding family influence
The Frist Group owned about 32% of shares at Feb 23, 2026 and can nominate two directors until its stake falls below 3%.
disclosure
No credit rating in the filings
The 10-K, 10-Qs and 8-Ks on file name no rating agency or rating for HCA's debt.
22How it got here
22How it got here
How did HCA Healthcare get here?
1968
Milestone
Operations begin
Through its predecessors, HCA began operating hospitals in 1968; it is based in Nashville, Tennessee.
2006
Business-model change
Bought by a private investor group
On Nov 17, 2006 HCA Inc. was acquired by investors including affiliates of founder Dr. Thomas F. Frist, Jr.
2011
Milestone
Back on the stock market
HCA Healthcare returned to public trading through an initial public offering in 2011; its shares trade on the NYSE.
2019
Milestone
Samuel Hazen becomes CEO
Hazen, President and COO from Nov 2016, became CEO in Jan 2019.
2024
Crisis
Hurricanes Helene and Milton
Hurricanes Helene and Milton hit in 2024; the company cited their ongoing effects in its Q1 FY2025 earnings release (Apr 25, 2025).
2025
Crisis
Exchange tax credits expire
Enhanced premium tax credits for exchange insurance expired at the end of 2025. HCA said patients who lost exchange coverage raised uninsured volume and estimated this shift lowered Q3 FY2026 pre-tax income by about $400 million.
2026
Milestone
Frist family share exchange
On Feb 6, 2026 HCA swapped 36.6 million shares with Frisco, held by a private investor group that includes Frist family affiliates; outstanding shares fell by 72,047.
2026
Milestone
Florida directed payments booked
Q2 FY2026 revenue included $1.372 billion from a Florida directed payment program covering Oct 2024 to Jun 2026.
23Sources and changes
Where every number on this page comes from
Sources (23 documents)
- S1Form 10-Q for Q3 FY2026 · SEC EDGAR · Tier 1: company or exchange filing · Oct 29, 2026
- S2Form 10-Q for Q2 FY2026 · SEC EDGAR · Tier 1: company or exchange filing · Jul 28, 2026
- S3Form 10-Q for Q1 FY2026 · SEC EDGAR · Tier 1: company or exchange filing · Apr 29, 2026
- S4Form 10-K for FY2025 · SEC EDGAR · Tier 1: company or exchange filing · Feb 10, 2026
- S5Form 10-Q for Q3 FY2025 · SEC EDGAR · Tier 1: company or exchange filing · Oct 30, 2025
- S6Form 10-Q for Q2 FY2025 · SEC EDGAR · Tier 1: company or exchange filing · Aug 4, 2025
- S7Form 10-Q for Q1 FY2025 · SEC EDGAR · Tier 1: company or exchange filing · May 1, 2025
- S8Form 10-K for FY2024 · SEC EDGAR · Tier 1: company or exchange filing · Feb 14, 2025
- S9Form 10-Q for Q3 FY2024 · SEC EDGAR · Tier 1: company or exchange filing · Oct 31, 2024
- S10Form 10-Q for Q2 FY2024 · SEC EDGAR · Tier 1: company or exchange filing · Jul 29, 2024
- S11Form 10-Q for Q1 FY2024 · SEC EDGAR · Tier 1: company or exchange filing · May 2, 2024
- S12Form 10-K for FY2023 · SEC EDGAR · Tier 1: company or exchange filing · Feb 16, 2024
- S13Form 10-K for FY2022 · SEC EDGAR · Tier 1: company or exchange filing · Feb 17, 2023
- S14Form 10-K for FY2021 · SEC EDGAR · Tier 1: company or exchange filing · Feb 18, 2022
- S152026 proxy statement (DEF 14A) · HCA Healthcare, Inc. / SEC EDGAR · Tier 1: company or exchange filing · Mar 13, 2026
- S16Q3 FY2026 earnings release (8-K Ex. 99.1) · HCA Healthcare, Inc. / SEC EDGAR · Tier 1: company or exchange filing · Oct 27, 2026
- S17Q2 FY2026 earnings release (8-K Ex. 99.1) · HCA Healthcare, Inc. / SEC EDGAR · Tier 1: company or exchange filing · Jul 24, 2026
- S18Q1 FY2026 earnings release (8-K Ex. 99.1) · HCA Healthcare, Inc. / SEC EDGAR · Tier 1: company or exchange filing · Apr 24, 2026
- S19Q4 FY2025 earnings release (8-K Ex. 99.1) · HCA Healthcare, Inc. / SEC EDGAR · Tier 1: company or exchange filing · Jan 27, 2026
- S20Q3 FY2025 earnings release (8-K Ex. 99.1) · HCA Healthcare, Inc. / SEC EDGAR · Tier 1: company or exchange filing · Oct 24, 2025
- S21Q2 FY2025 earnings release (8-K Ex. 99.1) · HCA Healthcare, Inc. / SEC EDGAR · Tier 1: company or exchange filing · Jul 25, 2025
- S22Q1 FY2025 earnings release (8-K Ex. 99.1) · HCA Healthcare, Inc. / SEC EDGAR · Tier 1: company or exchange filing · Apr 25, 2025
- S23Q4 FY2024 earnings release (8-K Ex. 99.1) · HCA Healthcare, Inc. / SEC EDGAR · Tier 1: company or exchange filing · Jan 24, 2025
Changes to this page (v1 · Nov 20, 2026)
- v1 · Nov 20, 2026First version. (first version)
Numbers come only from tier 1 and tier 2 sources. Read how we research.
Disclaimer
For learning only. Cityfort is not a registered investment adviser or broker-dealer and does not recommend buying or selling any security. Prices shown are dated and may be out of date.
Investing in securities involves risk, including loss of capital. Before making any investment decision, do your own research and consider consulting a registered investment adviser or other qualified professional.
Cityfort, its owners and contributors may or may not hold securities of companies covered. Cityfort is not paid by any company it covers. Content is not an offer or solicitation to buy or sell any security, including in any initial public offering.
Read the positions policyRead the full disclaimerHide the full disclaimer
Cityfort publishes general educational content that explains how listed companies work. Cityfort is not registered with the US Securities and Exchange Commission or any state securities regulator as an investment adviser, and is not a broker-dealer or a member of FINRA. Cityfort does not provide investment, tax or legal advice, recommendations, ratings, price targets or any opinion on whether to buy, sell or hold any security. Nothing on the site is tailored to any person's circumstances.
All information is taken from publicly available sources, mainly company filings with the SEC, which are listed on each page with dates. We work to keep it accurate and correct errors publicly, but we do not guarantee that it is complete, accurate or up to date. Any market price or price-based ratio shown is dated, may be out of date by the time you read it, and is included only to explain concepts.
Statements by company management, including forward-looking statements and guidance, are reported as the company's statements, with their date and source; they are not our forecasts. Adjusted (non-GAAP) figures are the company's own measures and are shown next to the official (GAAP) figures.