Health Care · NYSE: DHR
Danaher: how the business works
Danaher makes the equipment, supplies and tests that drugmakers, research labs and hospitals use, with $24.6 billion of sales in FY2025.
By Hardik Bhandare · Checked against filings: . Editorial policy. Corrections
Follow Danaher
Email me when Danaher's page is updated after earnings.
We'll send a confirmation email first. See our privacy policy.
Danaher Corporation · Washington, D.C.
Updated for Q3 FY2026 · checked
- Sales, FY2025
- $24.6B
- Net income, FY2025
- $3.61B
- Recurring sales, FY2025
- $81.9 of every $100
- Employees, Dec 31, 2025
- About 60,000
- Directors and officers' stake, Mar 1, 2026
- 10.8%
The short version
Danaher in 5 points
1 · What it sells
Danaher sells equipment, consumables and tests to drugmakers, research labs and hospitals, with sales of $24,568 million in FY2025.
2 · Who pays it
Danaher discloses no split by customer; by region, North America paid 42.2% of FY2025 sales, high-growth markets 28.6%, Western Europe 24.2% and other developed markets 5.1%.
3 · What it keeps from $100
Of every $100 that came in during FY2025, Danaher kept $14.6 as net income from continuing operations, after $562 million of impairments; making and delivering products took $40.8.
4 · Where the operating profit comes from
In FY2025, Diagnostics earned $2,650 million of segment operating profit, Biotechnology $1,864 million and Life Sciences $520 million, after $446 million of Life Sciences impairments.
5 · The one thing to watch
Borrowings rose from $18,418 million at Dec 31, 2025 to $26,482 million at Sep 25, 2026, after the $9.8 billion Masimo purchase.
Sources: From Danaher's FY2025 10-K, the Q3 FY2026 10-Q and its Q3 FY2026 earnings release · checked
01Where the money goes · FY2025
Where does $100 of Danaher's money go?
Danaher · FY2025
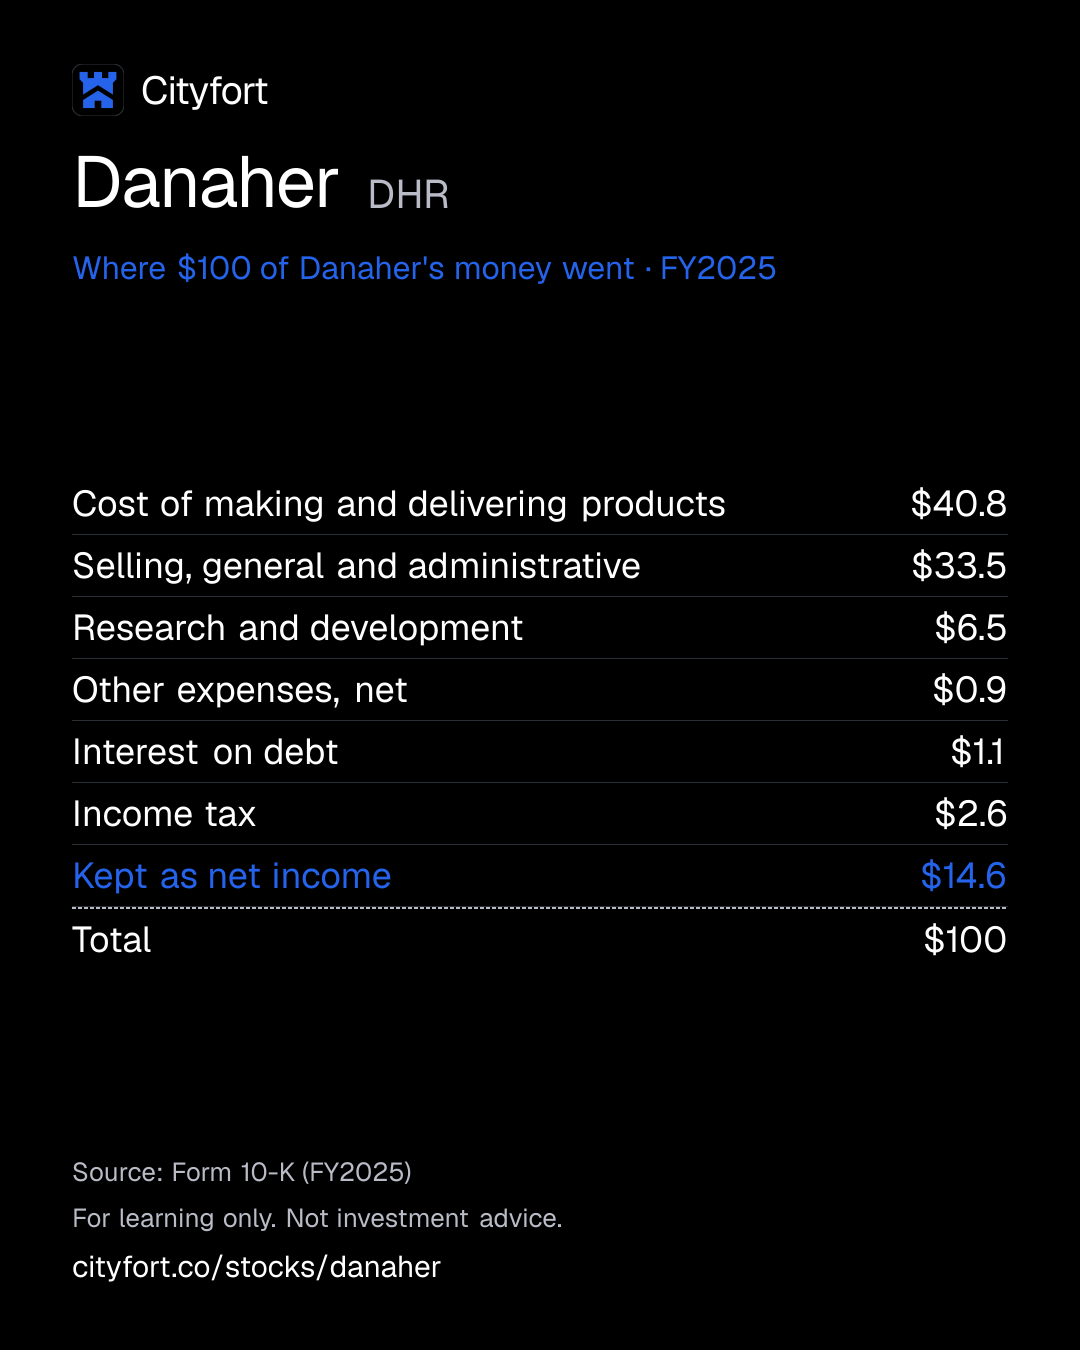
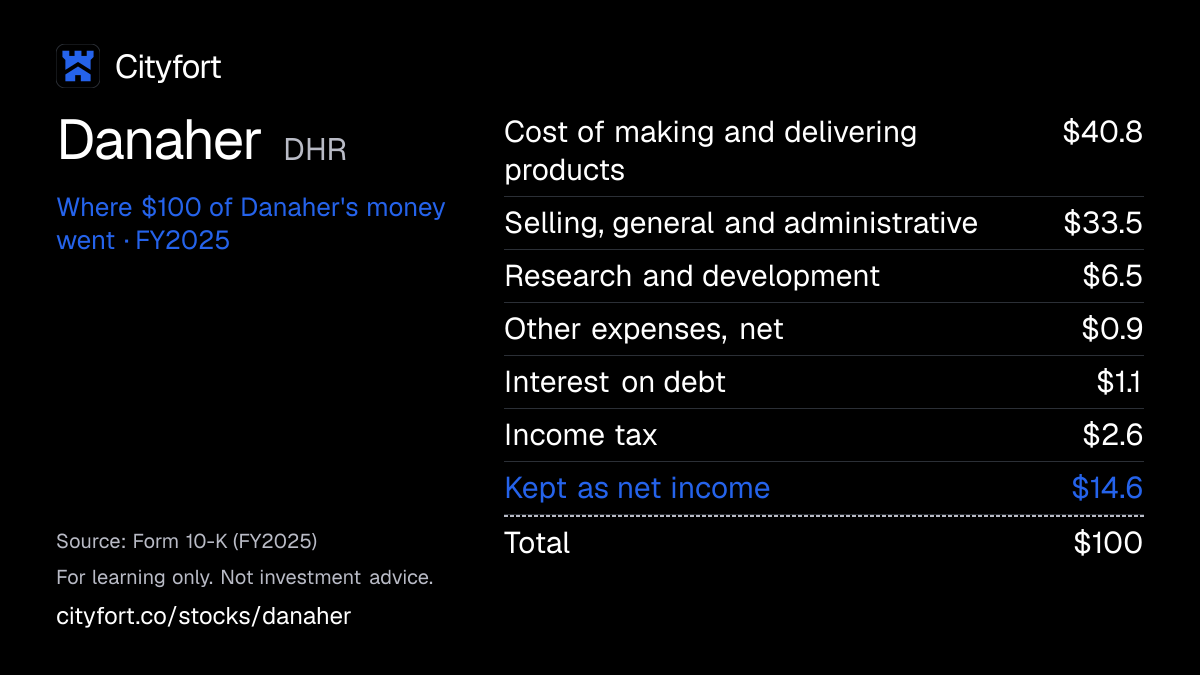
Receipt for every $100
| Cost of making and delivering products | $40.8 |
|---|---|
| Selling, general and administrative | $33.5 |
| Research and development | $6.5 |
| Other expenses, net | $0.9 |
| Interest on debt | $1.1 |
| Income tax | $2.6 |
| Kept as net income | $14.6 |
| Total | $100 |
Each line = amount ÷ total money in × 100. Lines may not add to exactly $100 because of rounding.
How this is worked out
Cityfort calculation from the FY2025 10-K. Of every $100 that came in during FY2025 (sales of $24,568 million plus $30 million of interest income): each line = line ÷ $24,598 million × 100. Net income here is from continuing operations; the $14 million from Veralto is left out.
Save this receipt as an image
Embed this receipt or the key numbers
Paste this code into a blog or website to show the card you choose, with a link back to this page.
Each week: the next company due to report earnings, explained in 5 points.
No tips. Unsubscribe anytime.
We'll send a confirmation email. See our privacy policy.
02The business in one line
What does Danaher do?
Drugmakers, research labs and hospitals pay Danaher for equipment and, above all, for the consumables and service that keep it running. Making and delivering the products takes $40.8 of every $100 that comes in, and $14.6 is kept as net income.
- In FY2025, $20,127 million of Danaher's $24,568 million of sales came from recurring purchases: consumables, service and equipment leases.
- Selling, general and administrative costs took $33.5 of every $100 in FY2025 and research $6.5, leaving $3,600 million of net income from continuing operations.
03Who pays it
Who pays Danaher?
Danaher does not disclose how much each type of customer pays.
Drugmakers and contract manufacturers
Buy bioprocessing equipment and consumables to develop and make biological medicines.
Research labs and universities
Buy microscopes, mass spectrometers and other instruments, and the consumables they use.
Hospitals, reference labs and doctors' offices
Buy diagnostic analyzers and tests and, since Jun 2026, Masimo patient monitors.
Where its revenue came from · FY2025
- North America (US and Canada)42.2%
- Western Europe24.2%
- Other developed markets5.1%
- High-growth markets (Asia outside Japan, Australia and New Zealand; Eastern Europe, Middle East, Africa, Latin America)28.6%
How spread out the customers are
Danaher does not disclose revenue by customer. Its 10-K says credit risk from customers is limited because they are diverse.
04How it makes money
How does Danaher make money?
About $82 of every $100 of Danaher's FY2025 sales came from recurring purchases: consumables, service and equipment leases.
Recurring sales were $20,127 million of $24,568 million in FY2025, or $81.9 of every $100, up from $78.2 in FY2023. The other $4,441 million was equipment and other one-off sales. Gross profit was $59.1 per $100 of sales, before selling, research and other costs.
Recurring sales per $100 of sales
$78.2$81.9
FY2023 to FY2025
- Danaher buys companies that make lab, bioprocessing and diagnostic products
- Its operating companies sell equipment to labs, drugmakers and hospitals
- Customers keep buying consumables and service
- DBS applies the same improvement tools across the operating companies
- Cash from operations pays for acquisitions, buybacks and dividends
↺ Step 5 feeds back into step 1.
Sources (1)
05Business segments · FY2025
Which businesses make up Danaher?
Biotechnology
29.7%Tools and consumables to make biological medicines (Cytiva, Pall).
Revenue $7.3B ($7,293M) · Operating profit $1.9B ($1,864M)
Life Sciences
29.9%Research instruments and DNA and protein consumables; $446 million of impairments in FY2025.
Revenue $7.3B ($7,334M) · Operating profit $520M
Diagnostics
40.5%Lab analyzers and tests for hospitals and labs; includes Masimo from Jun 10, 2026.
Revenue $9.9B ($9,941M) · Operating profit $2.7B ($2,650M)
How the mix changed
- Biotechnology
- Life Sciences
- Diagnostics
Revenue by segment, FY2023 to FY2025.
US$
See the numbers
06The numbers · Consolidated · US$
How has Danaher done?
Revenue
$24.6BFY2025
Revenue was between $23.9 billion and $24.6 billion in each year from FY2023 to FY2025; FY2021 and FY2022 are restated without Veralto, which left in Sep 2023.
US$
See the numbers
Net income
$3.6BFY2025
Net income fell from $7,209 million in FY2022 to $3,614 million in FY2025; FY2023 includes $543 million from Veralto before it left.
US$
See the numbers
Net income for every $100 of revenue
$14.7FY2025
Net income per $100 of revenue fell from $27.1 in FY2022 to $14.7 in FY2025.
Net margin: $ of net income per $100 of revenue
See the numbers
Free cash flow
$5.3BFY2025
Free cash flow (operating cash flow minus capital spending) was $5,260 million in FY2025, about 1.5 times that year's net income.
US$ · cash from operations minus spending on plants and equipment
See the numbers
See all yearly numbers
EBITDA here = operating income plus depreciation and amortization (from the cash flow statement). Fiscal years are the company's own: Fiscal year ends Dec 31 (the calendar year); quarters end on a Friday near the end of March, June and September. Net income is the share belonging to the company's owners.
Learn: Fiscal years that don't end in December: Nvidia's FY2027 explained · Stock-based compensation and dilution: pay that becomes shares
Sources (16)
- Form 10-K for FY2023
- Form 10-K for FY2021
- FY2024 Form 10-K
- Form 10-K for FY2022
- FY2025 Form 10-K
- Form 10-Q for Q1 FY2024
- Form 10-Q for Q2 FY2024
- Form 10-Q for Q3 FY2024
- Q3 FY2025 Form 10-Q
- Q4 FY2024 earnings release (8-K Ex. 99.1)
- Q4 FY2025 earnings release (8-K Ex. 99.1)
- Form 10-Q for Q1 FY2025
- Q1 FY2026 Form 10-Q
- Form 10-Q for Q2 FY2025
- Q2 FY2026 Form 10-Q
- Q3 FY2026 Form 10-Q (quarter ended Sep 25, 2026)
07Who runs it
Who runs Danaher, and did they deliver?
Julie Sawyer Montgomery
President and CEO · since 2026
Took over from Rainer Blair on Oct 1, 2026; an executive vice president since Jul 2024.
Steven M. Rales
Chairman of the Board · since 1984
Co-founder; CEO from 1984 to 1990. Brother of Mitchell Rales.
Mitchell P. Rales
Chairman of the Executive Committee · since 1984
Co-founder; President from 1984 to 1990.
Matthew Gugino
Chief Financial Officer · since 2026
Named Chief Financial Officer in the Aug 3, 2026 8-K; signed the Q1 and Q2 FY2026 10-Qs. The FY2025 10-K listed Matthew McGrew as CFO.
Rainer M. Blair
Senior Advisor (CEO Sep 2020 to Sep 2026) · since 2020
Left the board; Senior Advisor to Dec 31, 2026, then a consultant to Mar 31, 2027.
What they said, and what happened
1 delivered · 3 too early to tell
Said on Feb 17, 2026
Danaher announced an agreement to buy Masimo, a maker of pulse oximetry and patient monitoring systems.
DeliveredWhat happened
Completed on Jun 10, 2026 for about $9.8 billion in cash, net of Masimo's cash; Masimo is now part of Diagnostics.
Said on Jan 28, 2026
Danaher said it expected FY2026 core revenue growth of 3% to 6%.
Too early to tellWhat happened
On Oct 21, 2026 it said it expects full-year core growth of about 2.5%.
Said on Jan 28, 2026
Danaher said it expected FY2026 adjusted diluted EPS of $8.35 to $8.50.
Too early to tellWhat happened
It raised the range in April, July and October; on Oct 21, 2026 it was $8.57 to $8.62.
Said on Jul 21, 2026
CEO Rainer Blair said Danaher expected to exit 2026 at a mid-single-digit core revenue growth rate.
Too early to tellWhat happened
On Oct 21, 2026 Danaher said it expects Q4 core growth of about 3.0%, or 4.0% to 5.0% without respiratory testing.
Sources (11)
- 8-K filed Aug 3, 2026 (CEO succession, Item 5.02)
- FY2025 Form 10-K
- 2026 proxy statement (DEF 14A)
- Q1 FY2026 Form 10-Q
- Q2 FY2026 Form 10-Q
- 8-K filed Feb 17, 2026 (Masimo merger agreement, Item 8.01)
- Q3 FY2026 Form 10-Q (quarter ended Sep 25, 2026)
- Q4 FY2025 earnings release (8-K Ex. 99.1)
- Q3 FY2026 earnings release (8-K Ex. 99.1)
- Q1 FY2026 earnings release (8-K Ex. 99.1)
- Q2 FY2026 earnings release (8-K Ex. 99.1)
08What could go wrong
What could go wrong for Danaher?
- Demand
Weaker respiratory testing
Diagnostics core sales grew 0.5% in Q3 FY2026; respiratory testing took 6.5 points off. In Apr 2026 Blair cited a lighter-than-typical respiratory season at Cepheid.
Watch The respiratory testing line in each quarterly growth table.
- Debt
More debt after two 2026 deals
Borrowings, excluding lease liabilities, rose from $18,418 million at Dec 31, 2025 to $26,482 million at Sep 25, 2026. The 10-K lists debt and credit ratings as a risk factor.
Watch Net debt in the FY2026 10-K.
- Demand
Falling sales in China
Sales to China fell from $3,143 million in FY2023 to $2,631 million in FY2025, or 10.7% of FY2025 sales. The 10-K says China core revenue fell by a mid-single-digit percentage in 2025.
Watch China sales in the FY2026 10-K.
- Other
Write-downs of acquired businesses
Goodwill from past deals was $47,315 million at Sep 25, 2026, about half of total assets of $93,281 million. Danaher booked $562 million of impairments in FY2025, $446 million of them in Life Sciences.
Watch Impairment charges in each 10-Q.
- Legal
Shareholder lawsuits over bioprocessing statements
A 2023 class action alleges Danaher made misleading statements about bioprocessing revenue between Jan 2022 and Oct 2023. Danaher says it recorded a settlement liability and an offsetting insurance receivable; the court granted final approval at a Sep 2026 hearing and said a written order would follow. New derivative suits on the same allegations were filed from Mar 2026.
Watch The court's written order and the derivative cases.
- Regulation
Tariffs and trade rules
Danaher said new tariffs cost it less than $300 million more in 2025, largely offset. Tariff refunds to customers reduced Q3 FY2026 sales growth by 1.0 point.
Watch Tariff costs in the FY2026 10-K.
- Execution
Absorbing Masimo and StatLab
Danaher paid about $9.8 billion for Masimo in Jun 2026 and about $1.4 billion for StatLab in Sep 2026. Diagnostics operating profit was $614 million in Q3 FY2026, against $665 million a year earlier, on 17.0% higher sales.
Watch Diagnostics operating profit per $100 of sales.
09Supporters vs. critics
What do supporters and critics point to?
What supporters point to
- Recurring sales of consumables, service and leases were $81.9 of every $100 of Danaher's FY2025 sales, up from $78.2 in FY2023.
- Danaher reported FY2025 free cash flow (non-GAAP) of $5,293 million, against net income of $3,614 million.
- Biotechnology core sales grew 5.0% in Q3 FY2026, and CEO Rainer Blair said in Jul 2026 that bioprocessing orders grew by a mid-teens percentage in Q2 FY2026.
- Q3 FY2026 net income was $1,235 million, up from $908 million a year earlier; it includes a $263 million tax benefit.
- Danaher raised its FY2026 adjusted EPS range three times; on Oct 21, 2026 it said it expects $8.57 to $8.62, against $8.35 to $8.50 in Jan 2026.
What critics point to
- Net income fell from $7,209 million in FY2022 to $3,614 million in FY2025.
- Borrowings rose from $18,418 million at Dec 31, 2025 to $26,482 million at Sep 25, 2026, and goodwill from past deals was $47,315 million.
- Sales to China fell from $3,143 million in FY2023 to $2,631 million in FY2025.
- Diagnostics operating profit was $614 million in Q3 FY2026, against $665 million a year earlier, on 17.0% higher sales; respiratory testing took 6.5 points off its core growth.
- A 2023 class action alleges Danaher made misleading statements about bioprocessing revenue; a settlement received final approval in Sep 2026, and derivative suits on the same allegations were filed from Mar 2026.
10What to watch next
What should you watch next at Danaher?
Next event
Q4 FY2026 results
Date not announced yet.
Respiratory testing
Danaher said on Oct 21, 2026 that it expects respiratory testing to take about 1.5 points off Q4 FY2026 core growth. In Q3 FY2026 it took 6.5 points off Diagnostics core growth.
Diagnostics profit after Masimo and StatLab
Diagnostics operating profit was $614 million in Q3 FY2026, against $665 million a year earlier. StatLab, bought for about $1.4 billion, joins the segment from Q4 FY2026.
Debt after the 2026 deals
Borrowings were $26,482 million on Sep 25, 2026, against $18,418 million at Dec 31, 2025. The FY2026 10-K will show the year-end figure.
A new CEO
Julie Sawyer Montgomery became CEO on Oct 1, 2026, so Q4 FY2026 is her first full quarter in the role. Rainer Blair stays as Senior Advisor to Dec 31, 2026.
11Key facts
Key facts about Danaher
- What does Danaher do?
- Danaher Corporation makes equipment, consumables and tests used by drugmakers, research labs and hospitals, through more than 15 operating companies such as Cytiva, Pall, Beckman Coulter and Cepheid. It had sales of $24,568 million in FY2025.
- How does Danaher make money?
- Danaher makes most of its money from repeat purchases: recurring sales of consumables, service and equipment leases were $20,127 million of its $24,568 million of FY2025 sales.
- Who are Danaher's customers?
- Danaher sells to drugmakers and contract manufacturers, research labs and universities, and hospitals and testing labs. Its FY2025 10-K names no customer and gives no revenue share for any customer.
- Where does Danaher sell?
- In FY2025, North America (the US and Canada) made up 42.2% of Danaher's sales, high-growth markets 28.6%, Western Europe 24.2% and other developed markets 5.1%.
- Which Danaher segment is the largest?
- Diagnostics was Danaher's largest segment in FY2025, with $9,941 million of sales (40.5%) and $2,650 million of operating profit. Biotechnology had $7,293 million of sales and Life Sciences $7,334 million.
- How big is Danaher?
- Danaher had FY2025 sales of $24,568 million and net income of $3,614 million, and about 60,000 employees at Dec 31, 2025. Its Q3 FY2026 sales were $6,554 million.
- Who owns Danaher?
- Danaher's 2026 proxy shows its directors and executive officers holding 10.8% of the shares as of Mar 1, 2026, most of them owned by co-founders Steven and Mitchell Rales. The Vanguard Group reported 8.6%.
- How much debt does Danaher have?
- Danaher's borrowings, excluding lease liabilities, were $26,482 million on Sep 25, 2026, up from $18,418 million at Dec 31, 2025, after it bought Masimo for about $9.8 billion in Jun 2026.
- Who runs Danaher?
- Julie Sawyer Montgomery has been Danaher's President and CEO since Oct 1, 2026, when she succeeded Rainer Blair. Co-founder Steven Rales is Chairman of the Board.
Terms on this page
- Capital expenditures (capex)
- Debt-to-equity
- Earnings per share (EPS)
- EBITDA
- Free cash flow
- Net debt
- Net margin
- Revenue vs net income
- Stock buyback
Each explains the term in plain English, with the same number from other companies on Cityfort.
Go deeper
More detail from the same filings. Open any section.
12What it sells
12What it sells
What does Danaher sell?
Biotechnology (Cytiva, Pall)
Equipment, consumables and services drugmakers use to develop and make biological medicines, such as antibodies, insulin, vaccines and cell and gene therapies.
Life Sciences
Lab instruments such as microscopes, mass spectrometers and flow cytometers, plus DNA and protein products from IDT and Abcam.
Diagnostics
Analyzers and tests for hospital and clinical labs from Beckman Coulter, Cepheid, Radiometer and Leica Biosystems; Masimo pulse oximeters and patient monitors since Jun 2026.
What it does
- Does: Sells equipment and the consumables and service used with it
- Does: Sells to drugmakers, research labs, hospitals and testing labs
- Does: Runs facilities in about 50 countries
What it does not do
- Does not: Does not make medicines itself; drugmakers use its tools to make theirs
- Does not: No longer owns Veralto, which it separated on Sep 30, 2023
- Does not: Does not name any customer large enough to disclose
13How the money flows
13How the money flows · FY2025
How does money flow through Danaher?
Money in
- Sales$24.6B
- Interest income$30M
The company
Danaher
$24.6B came in
Money out
- Cost of making and delivering products$10.0B
- Selling, general and administrative$8.2B
- Research and development$1.6B
- Other expenses, net$222M
- Interest on debt$265M
- Income tax$633M
- Net income from continuing operations$3.6B
- In FY2025 customers paid Danaher $24,568 million, and it earned $30 million of interest on its cash.
- Making and delivering the products cost $10,045 million, leaving $14,523 million of gross profit.
- Selling, running the company and research took $9,833 million.
- Other expenses, interest and income tax took $1,120 million, leaving $3,600 million of net income.
- Another $14 million from discontinued operations (Veralto) made total net income $3,614 million.
Sources (1)
14What it needs to run
14What it needs to run
What does Danaher need to run?
Danaher Business System (DBS)
The company's own set of improvement tools, organized as Growth, Lean, Leadership and DBS Fundamentals, used across its operating companies.
About 60,000 employees
At Dec 31, 2025: about 22,000 in North America, 20,000 in Western Europe and 15,000 in high-growth markets.
Facilities in about 50 countries
About 194 significant sites for research, manufacturing, sales and distribution, 77 of them in the US.
Acquisitions
All three segments were built by buying companies; goodwill from past deals was $47,315 million at Sep 25, 2026.
15Where it sells
15Where it sells · FY2025
Where does Danaher sell?
- North America (US and Canada)42.2%
- Western Europe24.2%
- Other developed markets5.1%
- High-growth markets (Asia outside Japan, Australia and New Zealand; Eastern Europe, Middle East, Africa, Latin America)28.6%
Sources (1)
16Where growth could come from
16Where growth could come from
Where could Danaher's growth come from?
In its Q3 FY2026 earnings release (Oct 21, 2026), Danaher said it expects FY2026 adjusted diluted EPS of $8.57 to $8.62 (raised from $8.45 to $8.60) and core revenue growth of about 3.0% in Q4 FY2026.
Bioprocessing
WorkingBiotechnology core sales +5.0%, Q3 FY2026
CEO Rainer Blair said in Jul 2026 that bioprocessing orders grew by a mid-teens percentage in Q2 FY2026.
Status: Working, on track against what the company said.
Masimo
NewDiagnostics sales +17.0%, Q3 FY2026
Bought on Jun 10, 2026; Masimo had about $1.5 billion of 2025 revenue. Acquisitions added 16.5 points to Diagnostics sales growth in Q3 FY2026.
Status: New, recently announced.
Life Sciences recovery
MixedLife Sciences core sales +4.5%, Q3 FY2026
Blair called Q2 FY2026 the segment's strongest quarter in several years. In FY2025 it made $520 million of operating profit on $7,334 million of sales.
Status: Mixed, partly on track.
Respiratory testing
MixedDiagnostics core sales +0.5%, Q3 FY2026
Without respiratory testing, Diagnostics core sales grew 7.0%. Danaher said on Oct 21, 2026 that it expects respiratory testing to take about 1.5 points off Q4 FY2026 core growth.
Status: Mixed, partly on track.
StatLab
NewAbout $1.4 billion, bought Sep 28, 2026
Leica Biosystems bought StatLab, a maker of histology lab products with about $250 million of 2025 revenue. It joins Diagnostics from Q4 FY2026.
Status: New, recently announced.
Status compares progress with what the company itself said it would do: Working = on track against what the company said; Mixed = partly on track; Behind = behind the company's own plan; New = recently announced; Early = too early to judge.
17The company's own measures (non-GAAP)
17The company's own measures · FY2025 and Q3 FY2026
What do Danaher's own measures show?
Official (GAAP): Diluted EPS from continuing operations, Q3 FY2026
$1.71
Company's own measure: Adjusted diluted EPS, Q3 FY2026
$2.11
Amortization of acquired intangible assets added $0.73 a share, acquisition items $0.12 and impairments $0.07; the tax effect of these adjustments took $0.17 off, and net discrete tax benefits of $263 million, mainly released reserves for uncertain tax positions after audit settlements, took $0.37 off.
Official (GAAP): Total sales growth, Q3 FY2026
8.5%
Company's own measure: Core sales growth, Q3 FY2026
3.0%
Leaves out acquisitions and divestitures (6.5 points) and currency, and adds back tariff refunds to customers (1.0 point). Without respiratory testing, core growth was 5.5%.
Official (GAAP): Operating cash flow, FY2025
$6.4B
Company's own measure: Free cash flow (Danaher's definition), FY2025
$5.3B
Danaher subtracts capital spending and adds back money from selling property ($33 million). The free cash flowCash from operations minus spending on buildings and equipment. Learn more in "The numbers" subtracts capital spending only: $5,260 million.
Official (GAAP): Operating cash flow, Q3 FY2026
$1.9B
Company's own measure: Free cash flow (Danaher's definition), Q3 FY2026
$1.6B
Capital spending in the quarter was $255 million.
These are the company's own measures, defined by the company. They are not comparable across companies, and they are not added together. Each sits beside the nearest official (GAAP) figure.
Learn: Non-GAAP measures: what a company's "adjusted" numbers leave out
18Financial strength and debt
18Financial strength · Sep 25, 2026
How much debt does Danaher have?
- Total debt$26.5B
- Cash and investments$5.7B
- Net debt (debt minus cash)$20.8B
- Net worth (shareholders' money)$53.6B
- Debt to equity
- 0.49×
- $ of debt for every $1 of shareholders' money
- Total debt is borrowings, excluding lease liabilities, from Note 11 of the Q3 FY2026 10-Q.
- Net debt is a Cityfort calculation from the Q3 FY2026 10-Q: $26,482 million of borrowings minus $5,682 million of cash.
- Borrowings rose from $18,418 million at Dec 31, 2025, after the $9.8 billion Masimo purchase in Jun 2026.
- Danaher has a $5.0 billion unsecured revolving credit facility that expires on Aug 11, 2028 (FY2025 10-K).
19Who owns it
19Who owns it · ownership as of Mar 1, 2026
Who owns Danaher?
- Officers and directors (as a group), shares
- 10.8%
Share classes
Holders of 5% or more
From the company's proxy statement (DEF 14A), later Schedule 13G filings and the share counts on its latest annual or quarterly report. Each holder row shows the date of its own filing.
Learn: How to read a proxy statement (DEF 14A): Nvidia's 2026 proxy · Form 4 insider filings: who files, the codes and the footnotes
20What it does with profit
20What it does with profit
What does Danaher do with its profit?
Buyback · Dec 31, 2024
Bought about 20.0 million shares for about $5.2 billion during FY2024, including $173 million from the Danaher pension plan.
$5.2B
Buyback · Dec 31, 2025
Bought 14.5 million shares for about $3.1 billion during FY2025.
$3.1B
Buyback · Sep 25, 2026
Bought about 5.0 million shares for $903 million in the first nine months of FY2026, none in Q3.
$903M
21Governance signals
21Governance signals
What do Danaher's governance filings show?
- Auditor
- Ernst & Young LLP, since 2002
- Auditor changes
- None in the period covered
- Audit qualifications
- None reported
- Related-party dealings
- The 2026 proxy describes aircraft agreements with companies controlled by Steven and Mitchell Rales: a Danaher subsidiary manages their planes for no fee, and the two sides swap use of aircraft. Danaher also paid about $558,000 for a Washington Commanders suite; Mitchell Rales owns more than 10% of the team.
- Credit rating
- No public credit rating found in a search of rating agency sites on Nov 19, 2026
Flags to know about
shares as collateral
Founders' shares used as collateral for credit lines
A 2013 board policy bars directors and officers from using Danaher shares as loan collateral. The exemption covers shares Steven and Mitchell Rales had used for decades to back lines of credit. At Dec 31, 2025 the debt allowed could not exceed 25% of those shares' market valueShare price × number of shares: what all the shares were worth at one dated price. Learn more; the Audit Committee reviews them each quarter.
other
New CEO in 2026
Julie Sawyer Montgomery replaced Rainer Blair as President and CEO on Oct 1, 2026. Blair left the board and stays as Senior Advisor to Dec 31, 2026.
other
Special share awards to the founders
On Jul 31, 2026 a committee of disinterested directors granted Steven and Mitchell Rales each options on 1,000,000 shares and 500,000 restricted stock units. Danaher said in its Aug 3, 2026 8-K that it expects to leave this cost out of adjusted EPS.
disclosure
No customer split
Danaher's 10-K gives no revenue share for any customer, and no earnings-call transcripts are held for this page.
22How it got here
22How it got here
How did Danaher get here?
1984
Milestone
The Rales brothers take charge
Co-founder Steven Rales became Chairman and CEO; his brother Mitchell became President and Chairman of the Executive Committee.
2005
Business-model change
Into life sciences
Bought Leica Microsystems, the start of what is now the Life Sciences segment.
2011
Milestone
Beckman Coulter
Bought Beckman Coulter, now part of both Life Sciences and Diagnostics.
2015
Business-model change
Pall starts Biotechnology
Bought Pall, the start of the Biotechnology segment.
2016
Milestone
Cepheid
Bought Cepheid, now its molecular diagnostics business.
2020
Milestone
Cytiva
Bought Cytiva, which expanded Biotechnology.
2023
Business-model change
Veralto leaves, Abcam joins
Separated Veralto on Sep 30, 2023, and bought protein products maker Abcam in Dec 2023.
2026
Milestone
Masimo bought
Bought Masimo on Jun 10, 2026 for about $9.8 billion in cash; it joined Diagnostics.
2026
Milestone
New CEO
Julie Sawyer Montgomery succeeded Rainer Blair as CEO on Oct 1, 2026.
23Sources and changes
Where every number on this page comes from
Sources (22 documents)
- S1FY2025 Form 10-K · SEC EDGAR · Tier 1: company or exchange filing · Feb 24, 2026
- S2FY2024 Form 10-K · SEC EDGAR · Tier 1: company or exchange filing · Feb 20, 2025
- S3Q3 FY2026 Form 10-Q (quarter ended Sep 25, 2026) · SEC EDGAR · Tier 1: company or exchange filing · Oct 21, 2026
- S4Q2 FY2026 Form 10-Q · SEC EDGAR · Tier 1: company or exchange filing · Jul 21, 2026
- S5Q1 FY2026 Form 10-Q · SEC EDGAR · Tier 1: company or exchange filing · Apr 21, 2026
- S6Q3 FY2025 Form 10-Q · SEC EDGAR · Tier 1: company or exchange filing · Oct 21, 2025
- S72026 proxy statement (DEF 14A) · SEC EDGAR · Tier 1: company or exchange filing · Mar 25, 2026
- S8Q3 FY2026 earnings release (8-K Ex. 99.1) · SEC EDGAR · Tier 1: company or exchange filing · Oct 21, 2026
- S9Q2 FY2026 earnings release (8-K Ex. 99.1) · SEC EDGAR · Tier 1: company or exchange filing · Jul 21, 2026
- S10Q1 FY2026 earnings release (8-K Ex. 99.1) · SEC EDGAR · Tier 1: company or exchange filing · Apr 21, 2026
- S11Q4 FY2025 earnings release (8-K Ex. 99.1) · SEC EDGAR · Tier 1: company or exchange filing · Jan 28, 2026
- S15Q4 FY2024 earnings release (8-K Ex. 99.1) · SEC EDGAR · Tier 1: company or exchange filing · Jan 29, 2025
- S168-K filed Feb 17, 2026 (Masimo merger agreement, Item 8.01) · SEC EDGAR · Tier 1: company or exchange filing · Feb 17, 2026
- S208-K filed Aug 3, 2026 (CEO succession, Item 5.02) · SEC EDGAR · Tier 1: company or exchange filing · Aug 3, 2026
- S22Form 10-Q for Q2 FY2025 · SEC EDGAR · Tier 1: company or exchange filing · Jul 22, 2025
- S23Form 10-Q for Q1 FY2025 · SEC EDGAR · Tier 1: company or exchange filing · Apr 22, 2025
- S24Form 10-Q for Q3 FY2024 · SEC EDGAR · Tier 1: company or exchange filing · Oct 22, 2024
- S25Form 10-Q for Q2 FY2024 · SEC EDGAR · Tier 1: company or exchange filing · Jul 23, 2024
- S26Form 10-Q for Q1 FY2024 · SEC EDGAR · Tier 1: company or exchange filing · Apr 23, 2024
- S27Form 10-K for FY2023 · SEC EDGAR · Tier 1: company or exchange filing · Feb 21, 2024
- S28Form 10-K for FY2022 · SEC EDGAR · Tier 1: company or exchange filing · Feb 22, 2023
- S29Form 10-K for FY2021 · SEC EDGAR · Tier 1: company or exchange filing · Feb 23, 2022
Changes to this page (v1 · Nov 19, 2026)
- v1 · Nov 19, 2026First version, with results to Q3 FY2026 (quarter ended Sep 25, 2026). (first version)
Numbers come only from tier 1 and tier 2 sources. Read how we research.
Disclaimer
For learning only. Cityfort is not a registered investment adviser or broker-dealer and does not recommend buying or selling any security. Prices shown are dated and may be out of date.
Investing in securities involves risk, including loss of capital. Before making any investment decision, do your own research and consider consulting a registered investment adviser or other qualified professional.
Cityfort, its owners and contributors may or may not hold securities of companies covered. Cityfort is not paid by any company it covers. Content is not an offer or solicitation to buy or sell any security, including in any initial public offering.
Read the positions policyRead the full disclaimerHide the full disclaimer
Cityfort publishes general educational content that explains how listed companies work. Cityfort is not registered with the US Securities and Exchange Commission or any state securities regulator as an investment adviser, and is not a broker-dealer or a member of FINRA. Cityfort does not provide investment, tax or legal advice, recommendations, ratings, price targets or any opinion on whether to buy, sell or hold any security. Nothing on the site is tailored to any person's circumstances.
All information is taken from publicly available sources, mainly company filings with the SEC, which are listed on each page with dates. We work to keep it accurate and correct errors publicly, but we do not guarantee that it is complete, accurate or up to date. Any market price or price-based ratio shown is dated, may be out of date by the time you read it, and is included only to explain concepts.
Statements by company management, including forward-looking statements and guidance, are reported as the company's statements, with their date and source; they are not our forecasts. Adjusted (non-GAAP) figures are the company's own measures and are shown next to the official (GAAP) figures.