Consumer Discretionary · NASDAQ: DKNG
DraftKings: how the business works
DraftKings runs sports-betting, online casino, fantasy sports and lottery apps in US states that allow them, and earned $6.05 billion of revenue in FY2025.
By Hardik Bhandare · Checked against filings: . Editorial policy. Corrections
Follow DraftKings
Email me when DraftKings's page is updated after earnings.
We'll send a confirmation email first. See our privacy policy.
DraftKings Inc. · Boston, Massachusetts · Founded 2011
Updated for Q3 FY2026 · checked
- Revenue, FY2025
- $6.05B
- Net income, FY2025
- $3.7M
- Net loss, Q3 FY2026
- −$468.7M
- Monthly unique payers, Q3 FY2026 (DraftKings' own measure)
- 4.1 million
- Votes held by CEO Jason Robins, Mar 19, 2026
- 88.3%
The short version
DraftKings in 5 points
1 · What it sells
DraftKings runs sports-betting, online casino, fantasy sports, lottery and prediction-market apps, mainly in the US, and earned $6,054.5 million of revenue in FY2025.
2 · Who pays it
In FY2025 sports bettors paid 63.2% of DraftKings' revenue, online casino players 29.8%, and fantasy, lottery and other customers 7.0%.
3 · What it keeps from $100
Of every $100 that came in during FY2025, state gaming taxes took $34.6 and DraftKings kept $0.1 as net income, with $43.7 million of other gains offsetting an operating loss of $15.8 million.
4 · Where the operating profit comes from
DraftKings reports one segment and no profit by product, but Sportsbook is its largest source of revenue, $3,827.1 million in FY2025, and its net revenue margin rose to 7.1% from 4.4% in FY2022.
5 · The one thing to watch
DraftKings lost $468.7 million in Q3 FY2026 as sales and marketing reached $605.7 million, and on Nov 5, 2026 it lowered its FY2026 Adjusted EBITDAOperating profit before wear-and-tear charges (depreciation and amortization). As a margin: per $100 of sales. range to $175–275 million, including a $650–700 million investment in Predictions.
Sources: From DraftKings' FY2025 and FY2024 10-Ks, Q3 FY2026 10-Q and Q3 FY2026 earnings release · checked
See the full receipt and the management scorecard below
01Where the money goes · FY2025
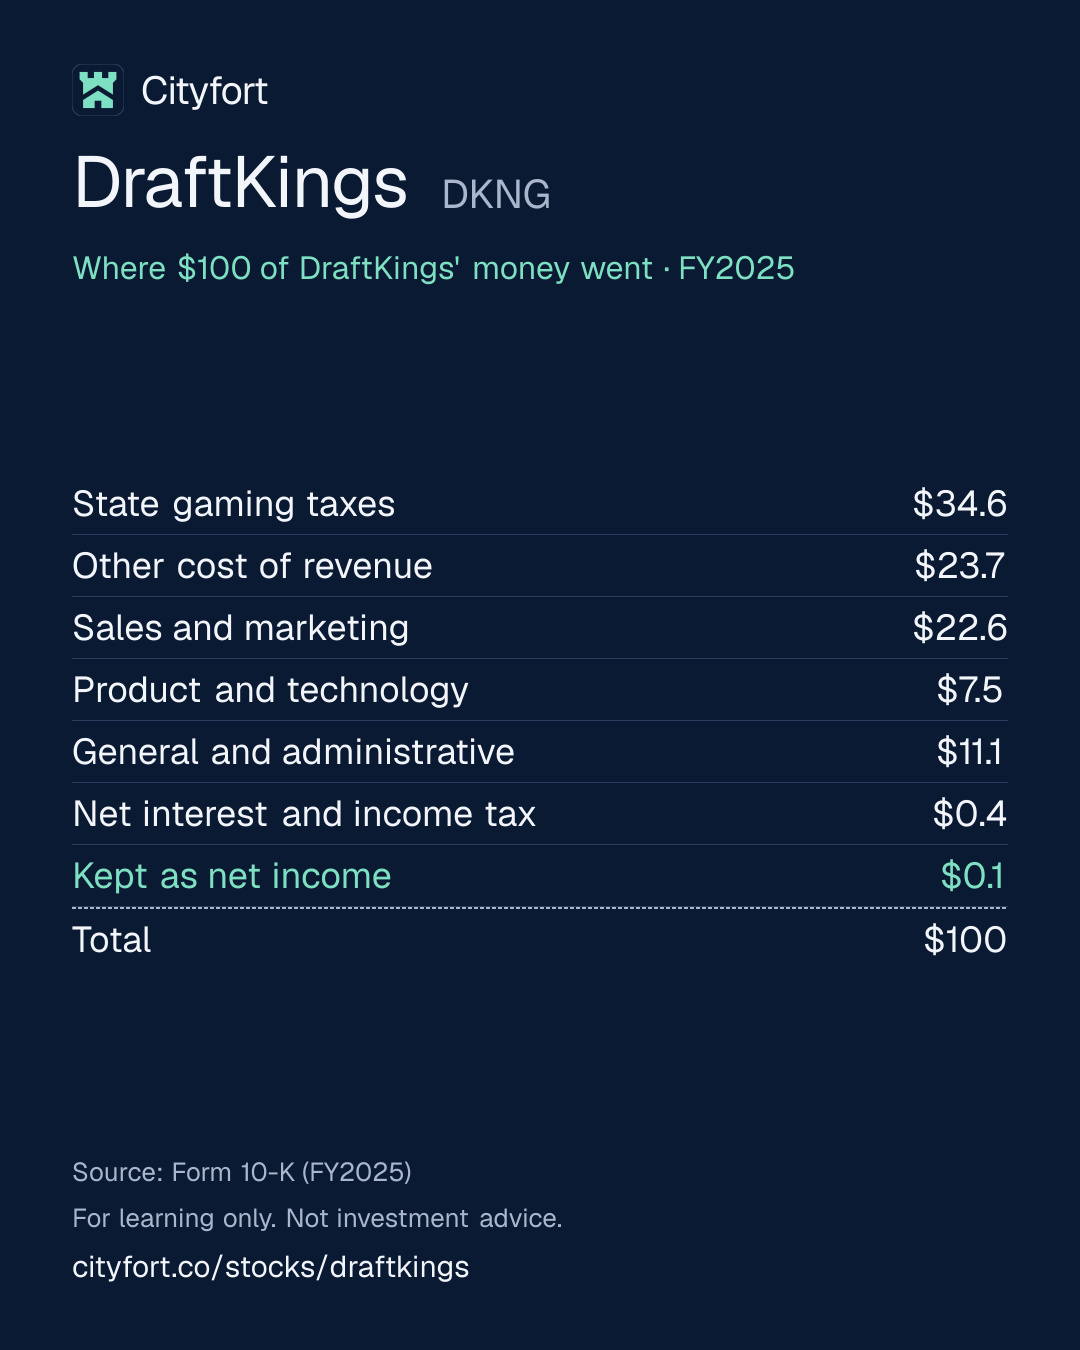
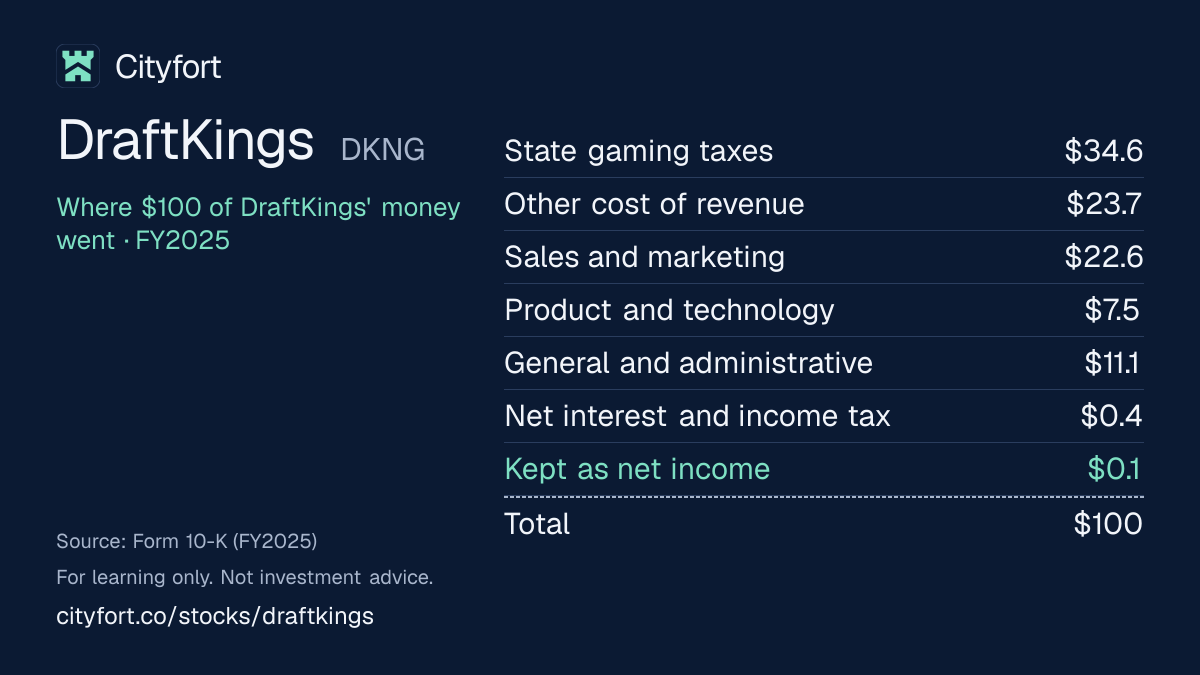
Where does $100 of DraftKings' money go?
DraftKings · FY2025
Receipt for every $100
| State gaming taxes | $34.6 |
|---|---|
| Other cost of revenue | $23.7 |
| Sales and marketing | $22.6 |
| Product and technology | $7.5 |
| General and administrative | $11.1 |
| Net interest and income tax | $0.4 |
| Kept as net income | $0.1 |
| Total | $100 |
Each line = amount ÷ total money in × 100. Lines may not add to exactly $100 because of rounding.
How this is worked out
Cityfort calculation from the FY2025 10-K. Of every $100 that came in during FY2025 (revenue $6,054.5 million + other gains $43.7 million = $6,098.2 million). Each line = line ÷ total money in × 100. Net income of $3.7 million included the $43.7 million of other gains; the operating loss was $15.8 million, or $0.26 per $100 of revenue. Stock-based pay of $339.3 million is spread across the cost lines.
Save this receipt as an image:
1080 × 1350 PNG for Instagram, LinkedIn1200 × 675 PNG for X
Embed this receipt
Paste this code into a blog or website to show the receipt, with a link back to this page:
Each week: one company explained in 5 points, picked by earnings date.
Free, no tips, unsubscribe anytime.
We'll send a confirmation email. See our privacy policy.
02The business in one line
What does DraftKings do?
Bettors and online casino players pay DraftKings what they lose after winnings and promotions; state gaming taxes and marketing take more than half of that, and FY2025 net income was $3.7 million on $6,054.5 million of revenue.
- Sports betting brought in 63.2% of DraftKings' FY2025 revenue and online casino games 29.8%; fantasy sports, lottery and other products brought in the other 7.0%.
- DraftKings lost money every year from FY2021 to FY2024 and had net income of $3.7 million in FY2025. It lost $468.7 million in Q3 FY2026 as marketing for its new Predictions product rose.
03Who pays it
Who pays DraftKings?
Sports bettors (Sportsbook)
63%
of revenue
Customers betting online and at retail sportsbooks. Sportsbook revenue was $3,827.1 million in FY2025, up from $2,902.9 million in FY2024.
Online casino players (iGaming)
30%
of revenue
Customers playing casino games for money in states that allow it. iGaming revenue was $1,804.6 million in FY2025, up from $1,507.8 million in FY2024.
Fantasy, lottery and other customers
7%
of revenue
Fantasy contest entries, lottery service fees and commissions, prediction markets and, from 2025, $25.6 million of interest earned on customer deposits. Other revenue was $422.8 million in FY2025.
- Sports bettors (Sportsbook)63%
- Online casino players (iGaming)30%
- Fantasy, lottery and other customers7%
How spread out the customers are
Shares are a Cityfort calculation from the FY2025 10-K (revenue by product ÷ $6,054.5 million). The 10-K names no customer with a large share of revenue. The 10-K calls the Apple App Store and Google Play Store the main distribution channels, and 97.4% came from the US in FY2025.
04Why it makes money
Why does DraftKings make money?
DraftKings keeps a share of what customers bet, but states tax that share and marketing costs come first, so profit depends on revenue growing faster than marketing
Revenue grew from $1,296.0 million in FY2021 to $6,054.5 million in FY2025, while sales and marketing grew from $981.5 million to $1,379.9 million. The operating loss shrank from $1,561.6 million to $15.8 million. Gaming taxes rose with revenue, to $2,110.6 million in FY2025.
Operating income per $100 of revenue
−$120.5−$0.3
FY2021 to FY2025
- Customers deposit money and bet or play on the app
- DraftKings keeps what they lose after winnings and promotions
- States take gaming taxes, about $35 of every $100 of revenue
- Marketing and promotions win and keep paying customers
- Each new state adds customers to the same app
- Revenue growing faster than marketing leaves more as operating profit
↺ Step 6 feeds back into step 1.
05Business segments · FY2025
Which businesses make up DraftKings?
Sportsbook
63%Sports betting, online and in person. DraftKings has one reportable segment; this is revenue by product, with no separate profit. From Q2 FY2026 releases group it with prediction markets as "Sports".
Revenue $3.8B
iGaming
30%Online casino games, live in 5 states on Nov 5, 2026.
Revenue $1.8B
Other
7%Fantasy sports, the Jackpocket lottery app, prediction markets and interest on customer deposits.
Revenue $423M
How the mix changed
- Sportsbook
- iGaming
- Other
Revenue by segment, FY2022 to FY2025.
US$
See the numbers
06The numbers · Consolidated · US$
How has DraftKings done?
Revenue
$6.1BFY2025
Revenue grew every year from $1,296.0 million in FY2021 to $6,054.5 million in FY2025; Q4 is usually the largest quarter, and Q3 FY2026 revenue of $1,329.1 million was up 16.2% from a year earlier.
US$
See the numbers
Net profit
$3.7MFY2025
DraftKings lost money every year from FY2021 to FY2024, had net income of $3.7 million in FY2025 (diluted EPS of −$0.01), and lost $468.7 million in Q3 FY2026.
US$
See the numbers
Profit kept per $100 of revenue
$0.1FY2025
The operating loss shrank from $120.49 to $0.26 per $100 of revenue between FY2021 and FY2025; stock-based pay was $339.3 million in FY2025, 5.6% of revenue and more than 90 times net income (Cityfort calculation from the FY2025 10-K).
$ of profit per $100 of revenue (net margin)
See the numbers
Free cash flow
$648MFY2025
Free cash flow turned positive in FY2024 and reached $647.5 million in FY2025; it does not deduct the $131.2 million DraftKings spent in FY2025 on software it built itself.
US$ · cash from operations minus spending on plants and equipment
See the numbers
See all yearly numbers
EBITDA here = operating income plus depreciation and amortization (from the cash flow statement). Fiscal years are the company's own (Fiscal year ends on Dec 31 (DraftKings' fiscal year is the calendar year)). Net profit is the share belonging to the company's owners.
Download DraftKings's yearly and quarterly numbers (CSV, with source ids)
Learn: Fiscal years that don't end in December: Nvidia's FY2027 explained · Stock-based compensation and dilution: pay that becomes shares
Sources (11)
- Form 10-K for fiscal year 2023
- Form 10-K for fiscal year 2025
- Q1 FY2025 earnings release (8-K Ex. 99.1)
- XBRL company facts (data.sec.gov) for DraftKings Inc.
- Q2 FY2025 earnings release (8-K Ex. 99.1)
- Q3 FY2025 earnings release (8-K Ex. 99.1)
- Q4 FY2024 earnings release (8-K Ex. 99.1)
- Q4 FY2025 earnings release (8-K Ex. 99.1)
- Q1 FY2026 earnings release (8-K Ex. 99.1)
- Q2 FY2026 earnings release (8-K Ex. 99.1)
- Q3 FY2026 earnings release (8-K Ex. 99.1, dated Nov 5, 2026)
07Who runs it
Who runs DraftKings, and did they deliver?
Jason D. Robins
Co-founder, chairman and chief executive officer
Held 88.3% of votes on Mar 19, 2026. His salary is $1; 2025 total pay was $22.62 million, mostly stock awards of $19.20 million.
Alan Ellingson
Chief financial officer
Also principal accounting officer from May 29, 2026.
Matthew Kalish
Co-founder and director; President, DraftKings North America until Mar 31, 2026
Held 1.3% of Class A shares on Mar 19, 2026.
Paul Liberman
Co-founder; president, operations; director
Trusts linked to him adopted a Rule 10b5-1 trading planAn insider's trading plan, set up in advance, that buys or sells shares on a schedule. Learn more in September 2026 covering up to 2,243,921 Class A shares.
R. Stanton Dodge
Chief legal officer
Resigned Nov 2, 2026, effective Feb 17, 2027, "to pursue an opportunity in public service".
What they said, and what happened
2 missed · 3 too early to tell
Said on Nov 7, 2024
FY2025 revenue of $6.2–6.6 billion.
MissedWhat happened
FY2025 revenue was $6,054.5 million, below the first range. DraftKings revised the range during 2025, last to $5.9–6.1 billion on Nov 6, 2025.
Said on Nov 7, 2024
FY2025 Adjusted EBITDA (the company's own measure) of $900 million to $1.0 billion.
MissedWhat happened
FY2025 Adjusted EBITDA was $620.0 million, after DraftKings lowered the range to $450–550 million on Nov 6, 2025. GAAP net income was $3.7 million.
Said on Feb 12, 2026
FY2026 revenue of $6.5–6.9 billion, assuming state tax rates stay the same.
Too early to tellWhat happened
Lowered to $6.35–6.55 billion on Nov 5, 2026. Revenue for the first nine months of 2026 was $4,418.4 million.
Said on Feb 12, 2026
FY2026 Adjusted EBITDA of $700–900 million.
Too early to tellWhat happened
Lowered to $175–275 million on Nov 5, 2026, including a $650–700 million investment in Predictions. It was −$34.4 million for the first nine months of 2026.
Said on Nov 5, 2026
FY2027 revenue of $7.35–7.75 billion and Adjusted EBITDA of $800 million to $1.0 billion.
Too early to tellWhat happened
FY2027 has not started.
Sources (8)
- 2026 proxy statement (DEF 14A)
- 8-K filed May 29, 2026 (Item 5.02: CFO becomes principal accounting officer)
- Form 10-Q for Q3 fiscal 2026 (quarter ended Sep 30, 2026)
- Q3 FY2024 earnings release (8-K Ex. 99.1)
- Form 10-K for fiscal year 2025
- Q3 FY2025 earnings release (8-K Ex. 99.1)
- Q4 FY2025 earnings release (8-K Ex. 99.1)
- Q3 FY2026 earnings release (8-K Ex. 99.1, dated Nov 5, 2026)
08What could go wrong
What could go wrong for DraftKings?
- Governance
One shareholder controls the votes
CEO Jason Robins holds every Class B share, with 10 votes each, and controlled 88.3% of votes on Mar 19, 2026. He decides board elections and other shareholder votes, and DraftKings uses Nasdaq's controlled-company exemptions.
Watch Any change to the Class B shares or to Robins' role.
- Execution
Spending on Predictions
Sales and marketing rose to $605.7 million in Q3 FY2026 from $360.4 million a year earlier, mainly for Predictions and a new Super App, and the net loss was $468.7 million. DraftKings said on Nov 5, 2026 that Predictions revenue for FY2026 will be immaterial because promotions offset it.
Watch FY2026 Adjusted EBITDA against the $175–275 million range DraftKings gave on Nov 5, 2026.
- Regulation
State gaming taxes
Gaming taxes were $2,110.6 million in FY2025, $34.86 of every $100 of revenue. The 10-K says tax increases in existing states may reduce profit, and Illinois passed a sports-betting tax increase in 2025; DraftKings added a 50-cent fee per bet there from Sep 1, 2025.
Watch New state tax laws, since DraftKings' FY2026 guidance assumed state tax rates would stay the same.
- Legal
Legal challenges to prediction markets
The Seminole Tribe of Florida sued on Oct 9, 2026, alleging that Predictions and Pick6 are prohibited gambling in Florida. Class actions also allege the product is illegal. In its Nov 5, 2026 earnings presentation, DraftKings modeled a scenario in which sports event contracts end on Jul 31, 2028.
Watch Court rulings and CFTC or state action on sports event contracts.
- Legal
Lawsuits over betting app design
Individual plaintiffs in Massachusetts, Illinois, New Jersey and Pennsylvania allege DraftKings' apps are designed to encourage compulsive betting and fail to warn users. DraftKings says it cannot estimate any loss.
Watch Rulings in these product-liability suits, filed since March 2026.
- Other
Game results move revenue
DraftKings keeps less when bettors win. Sportsbook net revenue margin ranged from 5.2% to 8.7% across 2025 quarters, and Q2 FY2026 revenue fell 4.6% partly on customer-friendly sport outcomes.
Watch Each quarter's net revenue margin (5.6% for Sports in Q3 FY2026).
- Debt
Debt and thin equity
DraftKings owed $2,236.0 million of debt principal on Sep 30, 2026, against stockholders' equity of $179.6 million. $958.0 million of principal falls due in 2028, mostly the convertible notes.
Watch The $945.0 million of convertible notes due Mar 15, 2028.
Sources (8)
- 2026 proxy statement (DEF 14A)
- Form 10-K for fiscal year 2025
- Form 10-Q for Q3 fiscal 2026 (quarter ended Sep 30, 2026)
- Q3 FY2026 earnings release (8-K Ex. 99.1, dated Nov 5, 2026)
- 8-K filed Jun 12, 2025 (Item 7.01, Ex. 99.1: Illinois 50-cent transaction fee)
- Q4 FY2025 earnings release (8-K Ex. 99.1)
- Q3 2026 earnings presentation
- Q2 FY2026 earnings release (8-K Ex. 99.1)
09Both sides
What do supporters and critics point to?
What supporters point to
- Revenue grew from $1,296.0 million in FY2021 to $6,054.5 million in FY2025.
- Free cash flow was $647.5 million in FY2025, after −$657.9 million in FY2022.
- Sportsbook net revenue margin rose from 4.4% in FY2022 to 7.1% in FY2025, by DraftKings' own measure.
- DraftKings said Sportsbook net revenue rose 36% in Q3 FY2026.
- DraftKings said on Nov 5, 2026 it expects FY2027 revenue of $7.35–7.75 billion.
What critics point to
- DraftKings lost $468.7 million in Q3 FY2026 and $515.3 million in the first nine months of 2026.
- DraftKings lowered its FY2026 Adjusted EBITDA range from $700–900 million to $175–275 million.
- Gaming taxes took $2,110.6 million in FY2025, more than a third of revenue.
- Stockholders' equity fell to $179.6 million on Sep 30, 2026, against $2,236.0 million of debt principal.
- CEO Jason Robins controlled 88.3% of votes through Class B shares that carry no economic rights.
10What to watch next
What should you watch next at DraftKings?
Next event
Q4 FY2026 results
Date not announced yet.
FY2026 results against the lowered range
Revenue against DraftKings' $6.35–6.55 billion range and Adjusted EBITDA against $175–275 million, both given on Nov 5, 2026.
Predictions spending and volume
Sales and marketing ($605.7 million in Q3 FY2026) and Predictions consumer volume ($10.1 billion annualized in October 2026, DraftKings' figure).
Court and state action on prediction markets
The Seminole Tribe suit filed Oct 9, 2026, the class actions, and any CFTC or state moves on sports event contracts.
The 2028 convertible notes
$945.0 million of principal falls due on Mar 15, 2028; cash and cash equivalents were $1,100.9 million on Sep 30, 2026.
11Key dates
What are the key dates for DraftKings?
Sources (4)
- Form 10-Q for Q3 fiscal 2026 (quarter ended Sep 30, 2026)
- 8-K filed Sep 25, 2026 (Item 4.01, change of auditor: BDO to Deloitte from FY2027)
- 8-K filed Aug 25, 2026 (Items 1.01/2.03: $700M Term Loan B-2 and $750M revolving facility; Ex. 99.1)
- 8-K filed Mar 4, 2025 (Items 1.01/2.03: $600M Term Loan B-1; Ex. 99.1)
12Key facts
Key facts about DraftKings
- What does DraftKings do?
- DraftKings Inc. runs phone apps and websites for sports betting (Sportsbook), online casino games (iGaming), daily fantasy sports, state lottery tickets bought for customers (Jackpocket) and prediction markets (DraftKings Predictions). On Nov 5, 2026 DraftKings' mobile sports betting was live in 27 US states, Washington, D.C. and Puerto Rico.
- How does DraftKings make money?
- DraftKings keeps what customers lose on bets and casino games after paying out winnings and giving promotions. In FY2025 DraftKings' Sportsbook brought in $3,827.1 million and iGaming $1,804.6 million of its $6,054.5 million revenue; the Sportsbook kept 7.1% of the $53.6 billion customers bet, by DraftKings' own measure.
- What is DraftKings' business model?
- DraftKings' business model is to keep a share of what customers wager, then pay state gaming taxes and marketing to win and keep customers. In FY2025 DraftKings paid $2,110.6 million of gaming taxes and spent $1,379.9 million on sales and marketing, on $6,054.5 million of revenue.
- Is DraftKings profitable?
- DraftKings had net income of $3.7 million in FY2025, after net losses in each year from FY2021 to FY2024, but an operating loss of $15.8 million. DraftKings lost $468.7 million in Q3 FY2026 and $515.3 million in the first nine months of 2026.
- What is DraftKings' revenue by segment?
- DraftKings reports one segment, so it gives no profit by product. By product, DraftKings' FY2025 revenue was $3,827.1 million from Sportsbook (63.2%), $1,804.6 million from iGaming (29.8%) and $422.8 million from other products (7.0%).
- How much does DraftKings make from online casino games?
- DraftKings' iGaming (online casino) revenue was $1,804.6 million in FY2025, 29.8% of total revenue, up from $821.8 million in FY2022. DraftKings' iGaming revenue was $460.9 million in Q3 FY2026.
- What is DraftKings Predictions?
- DraftKings Predictions is a prediction-market app, regulated by the CFTC, where customers trade contracts on the outcome of events; DraftKings launched it on Dec 19, 2025. DraftKings said more than 1.6 million customers used Predictions in 2026 up to its Nov 5, 2026 business update.
- Who are DraftKings' customers?
- DraftKings' customers are adults who bet on sports, play online casino games, enter fantasy contests or buy lottery tickets through its apps. DraftKings had an average of 4.0 million monthly unique payers in FY2025, and 97.4% of its FY2025 revenue came from the US.
- Who owns and controls DraftKings?
- DraftKings co-founder and CEO Jason Robins held all 393.0 million Class B shares, which carry 10 votes each but no economic rights, giving him 88.3% of the votes on Mar 19, 2026, per the 2026 proxy statementThe yearly filing about shareholder votes, the board and executive pay. Learn more. Canadian Imperial Bank of Commerce reported 7.3% of DraftKings' Class A shares at Jun 30, 2026.
- How big is DraftKings?
- DraftKings had revenue of $6,054.5 million and net income of $3.7 million in FY2025, and over 5,500 employees in 13 countries. DraftKings' revenue for the four quarters to Sep 30, 2026 was $6,407.6 million (Cityfort calculation from the Q4 FY2025 to Q3 FY2026 earnings releases).
Sources (9)
- Form 10-K for fiscal year 2025
- Q3 FY2026 earnings release (8-K Ex. 99.1, dated Nov 5, 2026)
- Form 10-K for fiscal year 2024
- Q3 2026 business update (shareholder letter)
- 2026 proxy statement (DEF 14A)
- Schedule 13G by Canadian Imperial Bank of Commerce on DraftKings Class A common stock (7.3% at Jun 30, 2026)
- Q2 FY2026 earnings release (8-K Ex. 99.1)
- Q1 FY2026 earnings release (8-K Ex. 99.1)
- Q4 FY2025 earnings release (8-K Ex. 99.1)
Terms on this page
- Average revenue per user (ARPU)
- Capital expenditures (capex)
- Debt-to-equity
- Earnings per share (EPS)
- EBITDA
- Free cash flow
- Market cap
- Net debt
- Net margin
- Revenue vs net income
Each explains the term in plain English, with the same number from other companies on Cityfort.
Go deeper
More detail from the same filings. Open any section.
13What it sells
13What it sells
What does DraftKings sell?
Sportsbook (sports betting)
Online and in-person bets on games and players. DraftKings earns the amount bet minus what it pays out. Mobile betting was live in 27 states, D.C. and Puerto Rico on Nov 5, 2026, covering about 53% of the US population.
iGaming (online casino)
Casino games played for money online, some built in-house and some licensed from suppliers such as International Gaming Technology, Light & Wonder and Evolution, which take a share of the revenue. Live in 5 states, about 11% of the US population, on Nov 5, 2026.
Daily fantasy sports and Pick6
Contests where customers pick players and win prizes based on their stats. DraftKings keeps entry fees minus prizes. Fantasy contests were offered in 44 states.
Jackpocket lottery
An app that buys state lottery tickets for customers. DraftKings earns service fees and state commissions. Acquired in May 2024.
DraftKings Predictions
A prediction-market app regulated by the CFTC, the US futures regulator, launched Dec 19, 2025. Customers trade contracts on event outcomes; DraftKings earns broker and exchange fees and market-making returns.
Think of it like this
Like a casino that lives on a phone: it keeps what players lose over time, but each state taxes its takings.
What it does
- Does: Takes sports bets and runs online casino games in states that license them
- Does: Runs fantasy sports contests and buys lottery tickets for customers
- Does: Runs a CFTC-regulated prediction market, launched in December 2025
- Does: Sells mainly through the Apple App Store, Google Play and its websites
What it does not do
- Does not: Does not operate in every state: online casino was live in 5 states on Nov 5, 2026
- Does not: Does not run the lotteries: Jackpocket buys state lottery tickets for its customers
- Does not: Does not report profit by product: it has one reportable segment
- Does not: Does not pay a dividend, and has never paid one
14How the money flows
14How the money flows · FY2025
How does money flow through DraftKings?
Money in
- Revenue (bets, casino games, fantasy, lottery and other)$6.1B
- Other gains $38.0M, warrant gain $4.7M and equity-method gain $1.0M$43.7M
The company
DraftKings
$6.1B came in
Money out
- State gaming taxes$2.1B
- Other cost of revenue (payment processing, data, platform and product costs)$1.4B
- Sales and marketing$1.4B
- Product and technology$460M
- General and administrative$674M
- Net interest expense $19.9M and income tax $4.3M$24.2M
- Net income$3.7M
- Revenue was $6,054.5 million in FY2025: what customers lost on bets and casino games after winnings and promotions, plus fantasy contest, lottery courier and prediction market fees and $25.6 million of interest on customer deposits. Other gains added $43.7 million.
- States took $2,110.6 million as gaming taxes, the largest single cost.
- Payment processing, data and other costs of serving bets took $1,446.3 million.
- Sales and marketing took $1,379.9 million, product and technology $459.9 million and administration $673.6 million.
- After $19.9 million of net interest and $4.3 million of tax, net income was $3.7 million.
Sources (1)
15What it needs to run
15What it needs to run
What does DraftKings need to run?
State licenses and market access
DraftKings must win and keep a license in each state where it operates. In some states it reaches customers through partner casinos, tribes or racetracks.
App stores
The FY2025 10-K calls the Apple App Store and Google Play Store DraftKings' main distribution channels; it also reaches customers through its websites and runs retail sportsbooks.
Marketing and media partners
Sales and marketing cost $1,379.9 million in FY2025. ESPN uses DraftKings as its official sportsbook and odds provider; NBC and Amazon are also media partners.
Customer money held for users
DraftKings owed users $935.0 million at Dec 31, 2025. The $469.4 million of cash reserved for users is kept apart from its own cash.
Staff
Over 5,500 employees in 13 countries, per the FY2025 10-K.
Sources (1)
16Where it sells
16Where it sells · FY2025
Where does DraftKings sell?
- United States97%
- Outside the US (no single country above 10%)3%
Sources (1)
17Where growth could come from
17Where growth could come from
Where could DraftKings' growth come from?
In its Q3 FY2026 earnings release (Nov 5, 2026) DraftKings said it expects FY2026 revenue of $6.35–6.55 billion and Adjusted EBITDA of $175–275 million, including a $650–700 million investment in Predictions. For FY2027 it gave ranges of $7.35–7.75 billion of revenue and $800 million to $1.0 billion of Adjusted EBITDA. On Feb 12, 2026 it had guided FY2026 revenue of $6.5–6.9 billion and Adjusted EBITDA of $700–900 million.
Sportsbook
WorkingNet revenue up 36%, Q3 FY2026
DraftKings said Sportsbook net revenue rose 36% from a year earlier and handle (the amount bet) 12%. Its net revenue margin was about 6.4%, by DraftKings' own measure.
Status: Working, on track against what the company said.
iGaming (online casino)
Mixed$460.9 million, Q3 FY2026
Up from $451.3 million a year earlier. Online casino is live in 5 states, about 11% of the US population.
Status: Mixed, partly on track.
DraftKings Predictions
New$10.1 billion annualized consumer volume, October 2026 (company figure)
Launched Dec 19, 2025. DraftKings said on Nov 5, 2026 that more than 1.6 million customers had used it in 2026, and that Predictions revenue for FY2026 will be immaterial because promotions offset it.
Status: New, recently announced.
New states
Working27 states plus D.C. and Puerto Rico for mobile betting
DraftKings' Sportsbook was live in Missouri by Dec 31, 2025 and in Arkansas by Sep 30, 2026. Its 10-K says future growth assumptions depend on states passing new laws.
Status: Working, on track against what the company said.
Monthly unique payers
Mixed4.1 million, Q3 FY2026
Up from 3.6 million in Q3 FY2025. Average revenue per payer was $109, against $106 a year earlier and $139 in Q4 FY2025.
Status: Mixed, partly on track.
Status compares progress with what the company itself said it would do: Working = on track against what the company said; Mixed = partly on track; Behind = behind the company's own plan; New = recently announced; Early = too early to judge.
Sources (7)
- Q3 FY2026 earnings release (8-K Ex. 99.1, dated Nov 5, 2026)
- Q4 FY2025 earnings release (8-K Ex. 99.1)
- Q3 2026 business update (shareholder letter)
- Q3 FY2025 earnings release (8-K Ex. 99.1)
- Q3 2026 earnings presentation
- Form 10-Q for Q3 fiscal 2026 (quarter ended Sep 30, 2026)
- Form 10-K for fiscal year 2025
18The company's own measures (non-GAAP)
18The company's own measures · FY2025 and Q3 FY2026
What do DraftKings' own measures show?
Official (GAAP): Net income, FY2025
$3.7M
Company's own measure: Adjusted EBITDA, FY2025
$620M
Net income before interest, tax, depreciation and amortization, and before stock-based payPay given as shares instead of cash, which spreads ownership more thinly. Learn more, transaction and litigation costs, "advocacy" spending on state legalization efforts, warrant remeasurement and other items. It was $181.3 million in FY2024 and −$151.0 million in FY2023.
Official (GAAP): Net loss, Q3 FY2026
−$469M
Company's own measure: Adjusted EBITDA, Q3 FY2026
−$317M
Same definition. For the first nine months of 2026 it was −$34.4 million against a net loss of $515.3 million; it left out $59.1 million of advocacy and related legal costs.
Official (GAAP): Diluted earnings per share, FY2025
−$0.01
Company's own measure: Adjusted earnings per share, FY2025
$0.66
Also leaves out amortization of acquired intangibles and applies a set non-GAAPThe company's own "adjusted" numbers, not the official (GAAP) ones. Always read them next to the official figure. Learn more tax rate (23% in 2025, 27% from Q3 2026).
Official (GAAP): Revenue, FY2025 (US$ million)
$6.1B
Company's own measure: Monthly unique payers (MUPs), FY2025 average
4 million payers
DraftKings' count of unique customers who paid to play in a month, averaged over the year: 1.5 million in FY2021. Without Jackpocket it was 3.5 million in FY2025. It was 4.1 million in Q3 FY2026.
Official (GAAP): Revenue, FY2025 (US$ million)
$6.1B
Company's own measure: Average revenue per monthly unique payer (ARPMUP), FY2025
125 US$ per payer per month
Average monthly revenue per paying customer, DraftKings' measure: $106 in FY2024 and $67 in FY2021. It was $109 in Q3 FY2026.
Official (GAAP): Sportsbook revenue, FY2025 (US$ million)
$3.8B
Company's own measure: Sportsbook handle, FY2025
53.6 US$ billion bet
The total amount customers bet with DraftKings' Sportsbook, up from $23.4 billion in FY2022. Bets are not revenue; revenue is what DraftKings keeps.
Official (GAAP): Sportsbook revenue, FY2025 (US$ million)
3,827.1%
Company's own measure: Sportsbook net revenue margin, FY2025
7.1%
Sportsbook revenue as a share of the amount bet, after promotions, DraftKings' measure: 4.4% in FY2022, 5.6% in FY2023 and 6.0% in FY2024. Across 2025 quarters it ranged from 5.2% to 8.7%, depending on game results.
Official (GAAP): Sports revenue (Sportsbook and prediction markets), Q3 FY2026 (US$ million)
$784M
Company's own measure: Predictions annualized consumer volume, October 2026
10.1 US$ billion a year
DraftKings' internal, unaudited figure: October 2026 trades by customers on DraftKings Predictions, multiplied to a full year. It was $1.3 billion for May 2026. It is not revenue.
These are the company's own measures, defined by the company. They are not comparable across companies, and they are not added together. Each sits beside the nearest official (GAAP) figure.
Learn: Non-GAAP measures: what a company's "adjusted" numbers leave out · Stock-based compensation and dilution: pay that becomes shares
Sources (10)
- Q4 FY2025 earnings release (8-K Ex. 99.1)
- Q4 FY2024 earnings release (8-K Ex. 99.1)
- Form 10-K for fiscal year 2025
- Q3 FY2026 earnings release (8-K Ex. 99.1, dated Nov 5, 2026)
- Form 10-K for fiscal year 2023
- Form 10-K for fiscal year 2024
- Q3 FY2025 earnings release (8-K Ex. 99.1)
- Q2 FY2025 earnings release (8-K Ex. 99.1)
- Q3 2026 business update (shareholder letter)
- 8-K filed Jun 9, 2026 (Item 7.01: May 2026 Predictions volumes)
19Financial strength and debt
19Financial strength · Sep 30, 2026
How much debt does DraftKings have?
- Total debt$2.2B
- Cash and investments$1.1B
- Net debt (debt minus cash)$1.1B
- Net worth (shareholders' money)$180M
- Debt to equity
- 12.21×
- $ of debt for every $1 of shareholders' money
- Net debt = debt at carrying amount $2,193.5 million − cash and cash equivalents $1,100.9 million = $1,092.6 million (Cityfort calculation from the Q3 FY2026 10-Q). On debt principal of $2,236.0 million it is $1,135.1 million.
- Debt on Sep 30, 2026: $945.0 million of 0% convertible notes due Mar 15, 2028; a $591.0 million Term Loan B-1 due Mar 4, 2032; a $700.0 million Term Loan B-2 due Aug 25, 2033. Nothing was drawn on a $750 million revolving credit facility.
- In August 2026 DraftKings repurchased $320.0 million of the 2028 convertible notes for $300.4 million, using part of the new Term Loan B-2.
- Cash reserved for users ($557.0 million) is customers' money and is not counted as DraftKings' cash. Operating lease liabilities of $89.7 million are not counted as debt.
- Equity fell in the first nine months of 2026 because of the $515.3 million net loss and $216.7 million of share repurchases. The accumulated deficit was $6,952.8 million.
20Who owns it
20Who owns it · ownership as of Mar 19, 2026
Who owns DraftKings?
- Officers and directors (as a group), shares
- 4.9%
- Officers and directors (as a group), votes
- 88.5%
Shares vs votes by class
DraftKings has more than one class of shares, and the classes carry different votes. The share of votes a class holds can differ a lot from its share of the shares.
- Class A common stock: share of all votes11.3%
- Class B common stock: share of all votes88.7%
Each class's part of all votes = its shares outstanding × votes per share ÷ the total for all classes.
Share classes
Holders of 5% or more
From the company's proxy statement (DEF 14A), later Schedule 13G filings and the share counts on its latest annual or quarterly report. Each holder row shows the date of its own filing.
Insider trades · Form 4 data as of Nov 6, 2026
What did DraftKings' insiders report trading?
DraftKings' insiders made 103 Form 4A filing an insider must make within two business days of buying or selling the company's shares. Learn more filings in the 12 months to Nov 6, 2026.
They reported 3 purchases (135,000 shares) and 17 sales (771,825 shares) in the open market or privately (codes P and S).
16 of the 17 sales were on forms with the Rule 10b5-1 plan box checked.
The same filings report 247 other share transactions (M: 131, F: 103, A: 6, G: 6, J: 1).
They also report 168 transactions in options, stock units or other derivatives.
Insiders are a company's officers, directors and owners of more than 10% of a class of its shares. Most changes in their holdings must be reported to the SEC on a Form 4 within two business days. Source: SEC Form 4 filings on EDGAR.
- P
- a purchase in the open market or privately
- S
- a sale in the open market or privately
- A
- a grant, award or other acquisition from the company under Rule 16b-3
- F
- shares withheld or handed over to pay an exercise price or tax when an award is received, exercised or vests
- M
- exercise or conversion of an option or other derivative, exempt under Rule 16b-3
- G
- a bona fide gift
- J
- another acquisition or disposition, described in a footnote
Code meanings: General Instruction 8 of Form 4 (SEC).
The latest 25 of 267 transactions
Shares: A = acquired, D = disposed of. A price the filing gives only in a footnote shows as “See filing”. The 10b5-1 box is checked when at least one trade on the form was made under a Rule 10b5-1 plan. A Form 4/A replaces the form it amends. See all of DraftKings' Form 4 filings on EDGAR.
Learn: Dual-class shares: when votes and ownership don't match · How to read a proxy statement (DEF 14A): Nvidia's 2026 proxy · Form 4 insider filings: who files, the codes and the footnotes · Rule 10b5-1 trading plans: how insiders pre-schedule their trades
Sources (7)
- Form 10-Q for Q3 fiscal 2026 (quarter ended Sep 30, 2026)
- 2026 proxy statement (DEF 14A)
- Schedule 13G by Canadian Imperial Bank of Commerce on DraftKings Class A common stock (7.3% at Jun 30, 2026)
- Schedule 13G by AQR Capital Management, LLC on DraftKings Class A common stock (5.98% at Jun 30, 2026)
- Schedule 13G by Kenneth Bryan Dart on DraftKings Class A common stock (5.8% at Aug 7, 2026)
- Schedule 13G/A by Vanguard Capital Management on DraftKings Class A common stock (4.92% at Sep 30, 2026)
- Schedule 13G/A by The Vanguard Group on DraftKings Class A common stock (0% at Mar 13, 2026)
21What it does with profit
21What it does with profit
What does DraftKings do with its profit?
Buyback · Dec 31, 2024
1.14 million Class A shares repurchased in FY2024 under a $1.0 billion program authorized Jul 30, 2024.
$48.1M
Buyback · Dec 31, 2025
15.97 million Class A shares repurchased in FY2025. The program was raised to $2.0 billion on Nov 6, 2025.
$572M
Buyback · Sep 30, 2026
5.5 million Class A shares in the first nine months of 2026, none in Q3 FY2026.
$154M
Money raised · Mar 4, 2025
$600 million Term Loan B-1 at SOFR + 1.75%, due Mar 4, 2032.
$600M
Money raised · Aug 25, 2026
$700 million Term Loan B-2 at SOFR + 2.00%, due Aug 25, 2033, upsized from $600 million; part went to repurchasing $320.0 million of 2028 convertible notes.
$700M
22Governance signals
22Governance signals
What do DraftKings' governance filings show?
- Auditor
- BDO USA, P.C.
- Auditor changes
- Sep 23, 2026: BDO USA, P.C. (after the FY2026 audit) → Deloitte & Touche LLP (from FY2027) (The audit committee chose Deloitte after an evaluation process. The 8-K says BDO's reports for FY2024 and FY2025 were not qualified, with no disagreements or reportable events.)
- Audit qualifications
- None reported
- Related-party dealings
- DraftKings leased an aircraft from an entity of CEO Jason Robins for about $0.6 million a year. On Aug 11, 2026 it agreed to buy the aircraft from that entity for about $25.5 million in cash, based on an independent appraisal and approved by the audit committee and the board.
- Credit rating
- No public credit rating found in a search of rating agency sites on Nov 7, 2026
Flags to know about
other · Mar 19, 2026
One person controls the votes
CEO Jason Robins holds all Class B shares, with 10 votes each, and controlled 88.3% of votes on Mar 19, 2026. DraftKings uses Nasdaq's controlled-company exemptions.
shares as collateral · Mar 26, 2026
Executives' shares held as collateral in forward sales
The 2026 proxy statement says 3,153,552 of Jason Robins' Class A shares, 4,201,574 of Matthew Kalish's and 500,000 of Stanton Dodge's are held as collateral by buyers under prepaid variable forward sale contracts.
related party · Aug 11, 2026
Aircraft bought from the CEO's entity
DraftKings agreed on Aug 11, 2026 to buy an aircraft it had leased from Jason Robins' entity for about $25.5 million.
auditor · Sep 25, 2026
Auditor to change after FY2026
BDO USA will leave after the FY2026 audit, and Deloitte & Touche will audit FY2027. The 8-K reports no disagreements.
regulatory
IRS audit over fantasy contest excise tax
The IRS is auditing prior tax years, mainly over excise tax on fantasy sports contests and reporting and withholding. DraftKings disputes the assessments and cannot estimate any loss.
disclosure · Aug 25, 2026
Credit rating level not stated
The August 2026 credit agreement amendment requires public ratings from S&P and Moody's, but DraftKings' filings do not state the rating levels.
Sources (5)
23What the market paid
23What the market paid · price as of Nov 5, 2026
What did the market pay for DraftKings on Nov 5, 2026?
Price as of Nov 5, 2026 (shown for education; prices change daily).
Price as of Nov 5, 2026: DraftKings Class A shares closed at $23.52 on Nasdaq, the date of the Q3 FY2026 earnings release. Market value = $23.52 × 498.3 million Class A shares (Nov 4, 2026) = about $11,720 million (Cityfort calculation from the Nov 5, 2026 Nasdaq closing price and the Q3 FY2026 10-Q). Class B shares have no economic rights, so they are left out. P/E (price ÷ earnings per share) is not shown because DraftKings had a net loss of $378.8 million over the four quarters to Sep 30, 2026 (Cityfort calculation from the Q4 FY2025 to Q3 FY2026 earnings releases).
- Share price
- $23.52
- Market value (market cap)
- $11.7B
More price-based ratios · as of Nov 5, 2026
Each ratio divides a number from the company's filings by the market value or share price on Nov 5, 2026. Prices change daily, so these ratios do too.
Price to sales (P/S)
1.8×
$11.7B market value ÷ $6.4B revenue (four quarters to Sep 30, 2026) = 1.8×
Cityfort calculation from the Nov 5, 2026 closing price and the Q4 FY2025 to Q3 FY2026 earnings releases. Source: DKNG historical daily prices, Oct 28 to Nov 5, 2026 (Nasdaq; close of Nov 5, 2026: $23.52); Form 10-Q for Q3 fiscal 2026 (quarter ended Sep 30, 2026); Q3 FY2026 earnings release (8-K Ex. 99.1, dated Nov 5, 2026) and 3 more
How price ratios workFree cash flow yield
5.5%
$648M free cash flow (FY2025) ÷ $11.7B market value = 5.5%
Cityfort calculation from the FY2025 10-K and the Nov 5, 2026 closing price. Source: DKNG historical daily prices, Oct 28 to Nov 5, 2026 (Nasdaq; close of Nov 5, 2026: $23.52); Form 10-Q for Q3 fiscal 2026 (quarter ended Sep 30, 2026); Q3 FY2026 earnings release (8-K Ex. 99.1, dated Nov 5, 2026) and 4 more
What free cash flow means
Source: DKNG historical daily prices, Oct 28 to Nov 5, 2026 (Nasdaq; close of Nov 5, 2026: $23.52); Form 10-Q for Q3 fiscal 2026 (quarter ended Sep 30, 2026); Q3 FY2026 earnings release (8-K Ex. 99.1, dated Nov 5, 2026) and 3 more
Sources (7)
- DKNG historical daily prices, Oct 28 to Nov 5, 2026 (Nasdaq; close of Nov 5, 2026: $23.52)
- Form 10-Q for Q3 fiscal 2026 (quarter ended Sep 30, 2026)
- Q3 FY2026 earnings release (8-K Ex. 99.1, dated Nov 5, 2026)
- Q2 FY2026 earnings release (8-K Ex. 99.1)
- Q1 FY2026 earnings release (8-K Ex. 99.1)
- Q4 FY2025 earnings release (8-K Ex. 99.1)
- Form 10-K for fiscal year 2025
24How it got here
24How it got here
How did DraftKings get here?
2011
Milestone
Fantasy sports start
DraftKings began with daily fantasy sports contests in 2011.
2018
Business-model change
Sports betting and online casino
DraftKings added Sportsbook and iGaming in 2018. They were 93% of FY2025 revenue.
2020
Milestone
Listed on Nasdaq
DraftKings went public on Apr 24, 2020 by combining with Diamond Eagle Acquisition Corp., a SPAC, and SBTech.
2022
Milestone
Golden Nugget Online Gaming bought
DraftKings bought Golden Nugget Online Gaming in an all-stock deal on May 5, 2022, adding online casino customers.
2024
Business-model change
Jackpocket lottery app bought
DraftKings bought Jackpocket on May 22, 2024, for total consideration of $773.1 million.
2025
Milestone
First net income on this page
FY2025 net income was $3.7 million, after losses each year from FY2021 to FY2024.
2025
Business-model change
Predictions launched
DraftKings bought Railbird, a CFTC-licensed exchange, on Oct 21, 2025 and launched DraftKings Predictions on Dec 19, 2025.
2026
Crisis
Loss and lower outlook
DraftKings lost $468.7 million in Q3 FY2026 and lowered its FY2026 Adjusted EBITDA range to $175–275 million on Nov 5, 2026.
25Sources and changes
Where every number on this page comes from
Sources (30 documents)
- S1Form 10-K for fiscal year 2025 · DraftKings Inc. (SEC EDGAR) · Tier 1: company or exchange filing · Feb 13, 2026
- S2Form 10-K for fiscal year 2024 · DraftKings Inc. (SEC EDGAR) · Tier 1: company or exchange filing · Feb 14, 2025
- S3Form 10-K for fiscal year 2023 · DraftKings Inc. (SEC EDGAR) · Tier 1: company or exchange filing · Feb 16, 2024
- S5Form 10-Q for Q3 fiscal 2026 (quarter ended Sep 30, 2026) · DraftKings Inc. (SEC EDGAR) · Tier 1: company or exchange filing · Nov 6, 2026
- S6Q3 FY2026 earnings release (8-K Ex. 99.1, dated Nov 5, 2026) · DraftKings Inc. (SEC EDGAR) · Tier 1: company or exchange filing · Nov 6, 2026
- S7Q2 FY2026 earnings release (8-K Ex. 99.1) · DraftKings Inc. (SEC EDGAR) · Tier 1: company or exchange filing · Aug 7, 2026
- S8Q1 FY2026 earnings release (8-K Ex. 99.1) · DraftKings Inc. (SEC EDGAR) · Tier 1: company or exchange filing · May 8, 2026
- S9Q4 FY2025 earnings release (8-K Ex. 99.1) · DraftKings Inc. (SEC EDGAR) · Tier 1: company or exchange filing · Feb 13, 2026
- S10Q3 FY2025 earnings release (8-K Ex. 99.1) · DraftKings Inc. (SEC EDGAR) · Tier 1: company or exchange filing · Nov 7, 2025
- S11Q2 FY2025 earnings release (8-K Ex. 99.1) · DraftKings Inc. (SEC EDGAR) · Tier 1: company or exchange filing · Aug 7, 2025
- S12Q1 FY2025 earnings release (8-K Ex. 99.1) · DraftKings Inc. (SEC EDGAR) · Tier 1: company or exchange filing · May 9, 2025
- S13Q4 FY2024 earnings release (8-K Ex. 99.1) · DraftKings Inc. (SEC EDGAR) · Tier 1: company or exchange filing · Feb 14, 2025
- S14Q3 FY2024 earnings release (8-K Ex. 99.1) · DraftKings Inc. (SEC EDGAR) · Tier 1: company or exchange filing · Nov 8, 2024
- S152026 proxy statement (DEF 14A) · DraftKings Inc. (SEC EDGAR) · Tier 1: company or exchange filing · Mar 26, 2026
- S16Q3 2026 business update (shareholder letter) · DraftKings Inc. (investor relations) · Tier 1: company or exchange filing · Nov 5, 2026
- S17Q3 2026 earnings presentation · DraftKings Inc. (investor relations) · Tier 1: company or exchange filing · Nov 5, 2026
- S188-K filed Sep 25, 2026 (Item 4.01, change of auditor: BDO to Deloitte from FY2027) · DraftKings Inc. (SEC EDGAR) · Tier 1: company or exchange filing · Sep 25, 2026
- S198-K filed Aug 25, 2026 (Items 1.01/2.03: $700M Term Loan B-2 and $750M revolving facility; Ex. 99.1) · DraftKings Inc. (SEC EDGAR) · Tier 1: company or exchange filing · Aug 25, 2026
- S208-K filed Mar 4, 2025 (Items 1.01/2.03: $600M Term Loan B-1; Ex. 99.1) · DraftKings Inc. (SEC EDGAR) · Tier 1: company or exchange filing · Mar 4, 2025
- S228-K filed Jun 9, 2026 (Item 7.01: May 2026 Predictions volumes) · DraftKings Inc. (SEC EDGAR) · Tier 1: company or exchange filing · Jun 9, 2026
- S238-K filed May 29, 2026 (Item 5.02: CFO becomes principal accounting officer) · DraftKings Inc. (SEC EDGAR) · Tier 1: company or exchange filing · May 29, 2026
- S258-K filed Jun 12, 2025 (Item 7.01, Ex. 99.1: Illinois 50-cent transaction fee) · DraftKings Inc. (SEC EDGAR) · Tier 1: company or exchange filing · Jun 12, 2025
- S26DKNG historical daily prices, Oct 28 to Nov 5, 2026 (Nasdaq; close of Nov 5, 2026: $23.52) · Nasdaq, Inc. · Tier 1: company or exchange filing · Nov 5, 2026
- S28Schedule 13G by Canadian Imperial Bank of Commerce on DraftKings Class A common stock (7.3% at Jun 30, 2026) · Canadian Imperial Bank of Commerce (SEC EDGAR) · Tier 1: company or exchange filing · Aug 13, 2026
- S29Schedule 13G by AQR Capital Management, LLC on DraftKings Class A common stock (5.98% at Jun 30, 2026) · AQR Capital Management, LLC (SEC EDGAR) · Tier 1: company or exchange filing · Aug 13, 2026
- S30Schedule 13G by Kenneth Bryan Dart on DraftKings Class A common stock (5.8% at Aug 7, 2026) · Kenneth Bryan Dart (SEC EDGAR) · Tier 1: company or exchange filing · Aug 14, 2026
- S31Schedule 13G/A by Vanguard Capital Management on DraftKings Class A common stock (4.92% at Sep 30, 2026) · Vanguard Capital Management (SEC EDGAR) · Tier 1: company or exchange filing · Oct 30, 2026
- S34Schedule 13G/A by The Vanguard Group on DraftKings Class A common stock (0% at Mar 13, 2026) · The Vanguard Group (SEC EDGAR) · Tier 1: company or exchange filing · Mar 26, 2026
- S35XBRL company facts (data.sec.gov) for DraftKings Inc. · U.S. SEC (EDGAR) · Tier 1: company or exchange filing · Nov 6, 2026
- S368-K filed Aug 25, 2026, Exhibit 10.1 (Second Amendment to Credit Agreement; Section 5.14 Ratings) · DraftKings Inc. (SEC EDGAR) · Tier 1: company or exchange filing · Aug 25, 2026
Changes to this page (v1 · Nov 6, 2026)
- v1 · Nov 6, 2026First version (US edition), from the FY2022 to FY2025 10-Ks, the Q3 FY2026 10-Q, earnings releases from Q3 FY2024 to Q3 FY2026, the 2026 proxy statement, the Q3 2026 presentation and shareholder letter, 8-Ks and Schedule 13G filings. (first version)
Numbers come only from tier 1 and tier 2 sources. Read how we research.
Disclaimer
For learning only. Cityfort is not a registered investment adviser or broker-dealer and does not recommend buying or selling any security. Prices shown are dated and may be out of date.
Investing in securities involves risk, including loss of capital. Before making any investment decision, do your own research and consider consulting a registered investment adviser or other qualified professional.
Cityfort, its owners and contributors may or may not hold securities of companies covered. Cityfort is not paid by any company it covers. Content is not an offer or solicitation to buy or sell any security, including in any initial public offering.
Read the positions policyRead the full disclaimerHide the full disclaimer
Cityfort publishes general educational content that explains how listed companies work. Cityfort is not registered with the US Securities and Exchange Commission or any state securities regulator as an investment adviser, and is not a broker-dealer or a member of FINRA. Cityfort does not provide investment, tax or legal advice, recommendations, ratings, price targets or any opinion on whether to buy, sell or hold any security. Nothing on the site is tailored to any person's circumstances.
All information is taken from publicly available sources, mainly company filings with the SEC, which are listed on each page with dates. We work to keep it accurate and correct errors publicly, but we do not guarantee that it is complete, accurate or up to date. Any market price or price-based ratio shown is dated, may be out of date by the time you read it, and is included only to explain concepts.
Statements by company management, including forward-looking statements and guidance, are reported as the company's statements, with their date and source; they are not our forecasts. Adjusted (non-GAAP) figures are the company's own measures and are shown next to the official (GAAP) figures.