Industrials · NYSE: UNP
Union Pacific: how the business works
Union Pacific runs a freight railroad across 23 western US states, hauling grain, chemicals, coal, cars and shipping containers, with revenue of $24.5 billion in FY2025.
By Hardik Bhandare · Checked against filings: . Editorial policy. Corrections
Follow Union Pacific
Email me when Union Pacific's page is updated after earnings.
We'll send a confirmation email first. See our privacy policy.
Union Pacific Corporation · Omaha, Nebraska · Founded 1969
Updated for Q3 FY2026 · checked
- Revenue, FY2025
- $24.5B
- Net income, FY2025
- $7.14B
- Route miles, Dec 31, 2025
- 32,889
- Operating ratio, FY2025
- 59.8%
- Average employees, 2025
- 29,287
The short version
Union Pacific in 5 points
1 · What it sells
Union Pacific hauls grain, chemicals, coal, cars and shipping containers by rail over 32,889 route miles in 23 western US states, with revenue of $24,510 million in FY2025.
2 · Who pays it
In FY2025, Industrial shippers paid 35.1% of Union Pacific's revenue, Bulk shippers 31.0%, Premium shippers of cars and containers 28.7% and other services 5.3%, and no customer is named as a large share.
3 · What it keeps from $100
Of every $100 that came in during FY2025, Union Pacific kept $28.39 as net income, which includes other income of $629 million such as $250 million of land sales, while operating income was $40.17 per $100 of revenue.
4 · Where the operating profit comes from
Union Pacific reports one segment and no profit by business group: the railroad's FY2025 operating income was $9,846 million, with operating expenses at 59.8% of revenue, its operating ratio.
5 · The one thing to watch
Union Pacific said on Oct 22, 2026 that it expects its Norfolk Southern merger, under Surface Transportation Board review, to close in the second half of 2027 and to pay about $20 billion in cash, against total debt of $30,324 million on Sep 30, 2026.
Sources: From Union Pacific's FY2025 10-K and Q3 FY2026 10-Q · checked
See the full receipt and the management scorecard below
01Where the money goes · FY2025
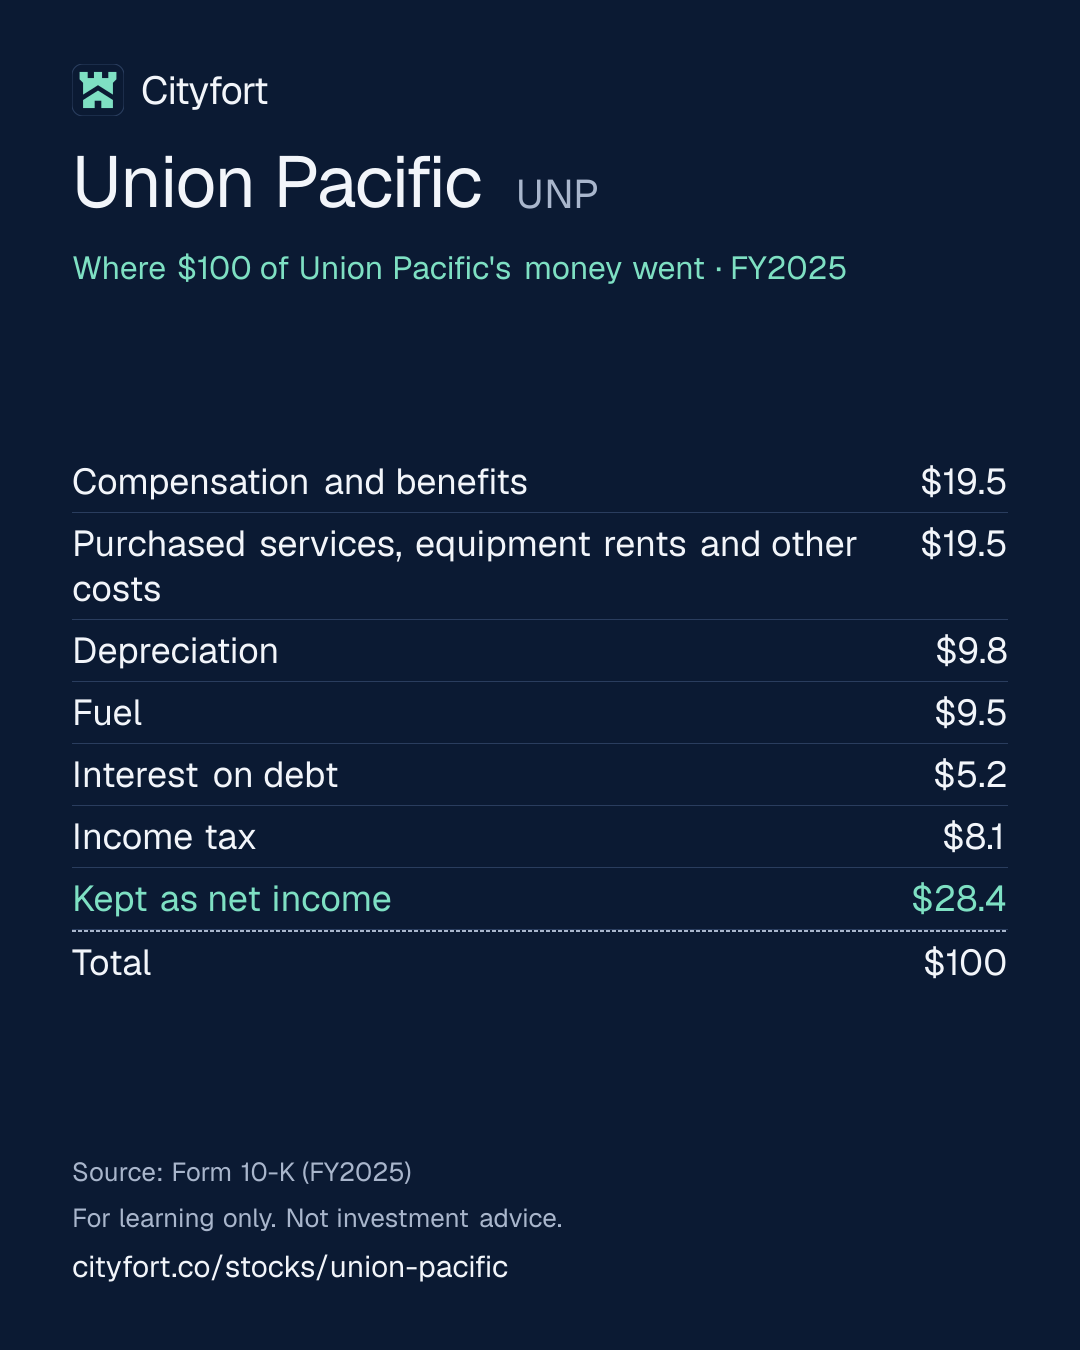
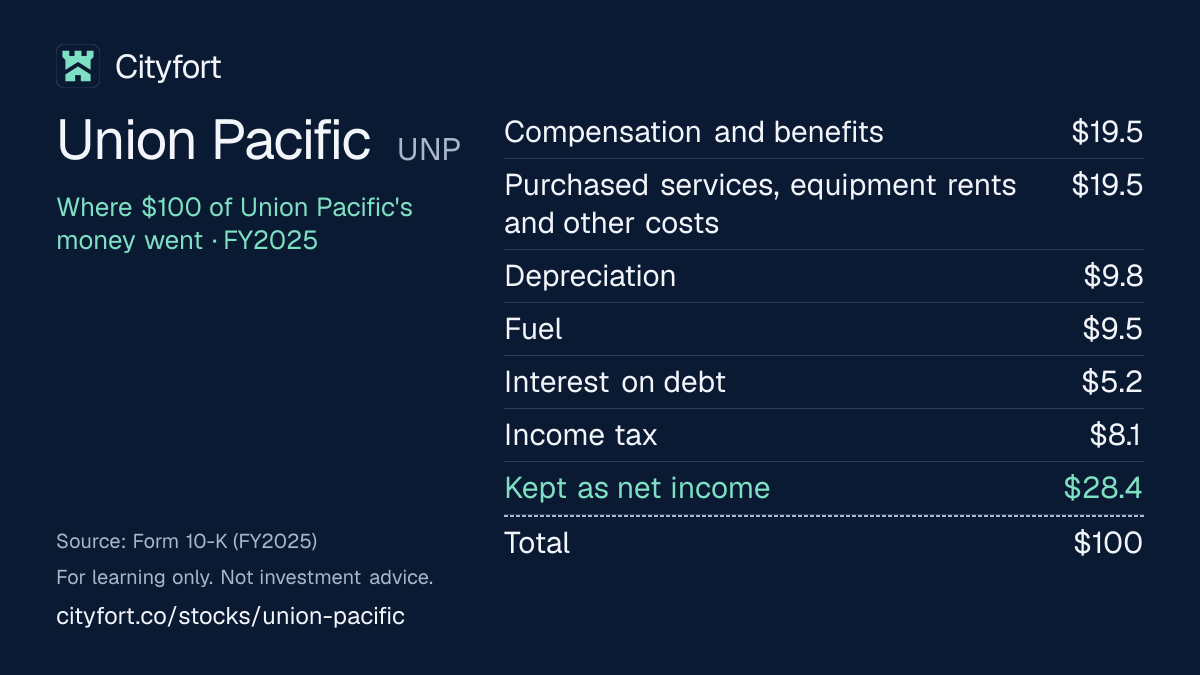
Where does $100 of Union Pacific's money go?
Union Pacific · FY2025
Receipt for every $100
| Compensation and benefits | $19.5 |
|---|---|
| Purchased services, equipment rents and other costs | $19.5 |
| Depreciation | $9.8 |
| Fuel | $9.5 |
| Interest on debt | $5.2 |
| Income tax | $8.1 |
| Kept as net income | $28.4 |
| Total | $100 |
Each line = amount ÷ total money in × 100. Lines may not add to exactly $100 because of rounding.
How this is worked out
Cityfort calculation from FY2025 10-K. Of every $100 that came in during FY2025: each line = line ÷ $25,139 million × 100 (revenue $24,510 million + other income $629 million). Other income includes $250 million of industrial park land sales. Operating income was $9,846 million, or $40.17 of each $100 of revenue.
Save this receipt as an image:
1080 × 1350 PNG for Instagram, LinkedIn1200 × 675 PNG for X
Embed this receipt
Paste this code into a blog or website to show the receipt, with a link back to this page:
Each week: one company explained in 5 points, picked by earnings date.
Free, no tips, unsubscribe anytime.
We'll send a confirmation email. See our privacy policy.
02The business in one line
What does Union Pacific do?
Shippers of grain, coal, chemicals, cars and containers pay Union Pacific to haul their freight by rail; most of the money goes on staff, fuel, outside services and track wear, and $28.39 of every $100 that came in during FY2025 was left as net income.
- Industrial shippers paid 35.1% of FY2025 revenue, Bulk shippers 31.0% and Premium shippers of cars and containers 28.7% (Cityfort calculation from FY2025 10-K).
- Union Pacific agreed in July 2025 to buy Norfolk Southern; the deal is under Surface Transportation Board review, and the company said on Oct 22, 2026 that it expects it to close in the second half of 2027.
03Who pays it
Who pays Union Pacific?
Industrial shippers
35%
of revenue
35.1% of FY2025 revenue, or $8,604 million: makers and users of chemicals, plastics, steel, minerals, lumber, paper, petroleum and sand.
Bulk shippers
31%
of revenue
31.0% of FY2025 revenue, or $7,586 million: grain and fertilizer shippers, food companies and power companies buying coal.
Premium shippers: automakers and container shippers
29%
of revenue
28.7% of FY2025 revenue, or $7,030 million: automakers and parts makers, and shipper agents, logistics companies and truckload carriers moving containers.
Other services
5%
of revenue
5.3% of FY2025 revenue, or $1,290 million: other subsidiaries' revenue and accessorial charges.
- Industrial shippers35%
- Bulk shippers31%
- Premium shippers: automakers and container shippers29%
- Other services5%
How spread out the customers are
Shares are of FY2025 total revenue of $24,510 million (Cityfort calculation from FY2025 10-K). The 10-K names no customer and gives no customer concentration; it says revenue comes mainly from customers based in the US. Freight to and from Mexico brought $2.9 billion in 2025.
04Why it makes money
Why does Union Pacific make money?
Track, locomotives and crews cost Union Pacific money whether trains are full or not, so carloads, prices and train efficiency decide how much of each $100 is left.
The operating ratio is operating expenses per $100 of revenue. It was 62.3% in FY2023 and 59.8% in FY2025, as carloads rose from 8,112,000 to 8,447,000 and average employees fell from 31,490 to 29,287. Fuel can push it the other way: higher fuel prices added 1.4 points in Q3 FY2026.
Operating expenses per $100 of revenue (operating ratio)
$62.3$59.8
FY2023 to FY2025
- Shippers book carloads of grain, chemicals, cars and containers
- Trains carry them over 32,889 route miles
- Prices per car cover crews, fuel and track
- Longer trains and faster cars spread the fixed costs
- About $40 of each $100 of revenue is left as operating income
- Cash pays for track, dividends and buybacks
↺ Step 6 feeds back into step 1.
05Business segments · FY2025
Which businesses make up Union Pacific?
Industrial
35%Chemicals and plastics, metals and minerals, forest products, and energy and specialized products. 37% of freight revenue in FY2025.
Revenue $8.6B
Bulk
31%Grain, fertilizer, food and refrigerated goods, and coal and renewables. 33% of freight revenue in FY2025.
Revenue $7.6B
Premium
29%Automotive ($2,398 million) and intermodal containers ($4,632 million). 30% of freight revenue in FY2025.
Revenue $7.0B
Other revenues
5%Not a business group: other subsidiaries' revenue, accessorial charges and other items.
Revenue $1.3B
How the mix changed
- Industrial
- Bulk
- Premium
- Other revenues
Revenue by segment, FY2021 to FY2025.
US$
See the numbers
06The numbers · Consolidated · US$
How has Union Pacific done?
Revenue
$24.5BFY2025
Revenue was $24,510 million in FY2025, up from $21,804 million in FY2021; Q3 FY2026 revenue of $7,197 million was up 15%, much of it from fuel surcharges, with freight revenue excluding fuel surcharge up 6%.
US$
See the numbers
Net profit
$7.1BFY2025
Net income rose from $6,379 million in FY2023 to $7,138 million in FY2025; FY2025 includes $250 million of industrial park land sales before tax.
US$
See the numbers
Profit kept per $100 of revenue
$29.1FY2025
Net income per $100 of revenue was $29.1 in FY2025, up from $26.4 in FY2023, when the operating ratio was 62.3%.
$ of profit per $100 of revenue (net margin)
See the numbers
Free cash flow
$5.5BFY2025
Operating cash flow was $9,290 million in FY2025 and capital investments $3,791 million, leaving free cash flow of $5,499 million.
US$ · cash from operations minus spending on plants and equipment
See the numbers
See all yearly numbers
EBITDA here = operating income plus depreciation and amortization (from the cash flow statement). Fiscal years are the company's own (Fiscal year ends Dec 31). Net profit is the share belonging to the company's owners.
Download Union Pacific's yearly and quarterly numbers (CSV, with source ids)
Learn: Fiscal years that don't end in December: Nvidia's FY2027 explained · Stock-based compensation and dilution: pay that becomes shares
Sources (11)
- Form 10-K, fiscal year 2022 (ended Dec 31, 2022)
- Form 10-K, fiscal year 2025 (ended Dec 31, 2025)
- Fourth quarter and full year 2024 earnings release (8-K Exhibit 99.1)
- First quarter 2025 earnings release (8-K Exhibit 99.1)
- Second quarter 2025 earnings release (8-K Exhibit 99.1)
- Third quarter 2025 earnings release (8-K Exhibit 99.1)
- Fourth quarter and full year 2025 earnings release (8-K Exhibit 99.1)
- First quarter 2026 earnings release (8-K Exhibit 99.1)
- Second quarter 2026 earnings release (8-K Exhibit 99.1)
- Third quarter 2026 earnings release (8-K Exhibit 99.1)
- Form 10-Q, Q3 FY2026 (quarter ended Sep 30, 2026)
07Who runs it
Who runs Union Pacific, and did they deliver?
V. James (Jim) Vena
Chief Executive Officer · since 2023
CEO since Aug 14, 2023; earlier Union Pacific's Chief Operating Officer (2019 to 2020). His 2025 total pay was $20,296,362, and the proxy's CEO pay ratio was 151 to 1.
Jennifer L. Hamann
Executive Vice President and Chief Financial Officer · since 2020
CFO since Jan 1, 2020. The company said on Oct 16, 2026 that she plans to retire in early 2027.
Michael R. McCarthy
Chairman of the Board · since 2023
Independent Chairman since the board split the Chairman and CEO roles in August 2023.
W. Anthony Will
Director · since 2026
Elected to the board effective Jan 5, 2026.
What they said, and what happened
4 too early to tell
Said on Jan 27, 2026
Union Pacific said in its Jan 27, 2026 earnings release that it expected 2026 EPS growth in the mid single digits.
Too early to tellWhat happened
The year is not over. On Oct 22, 2026 the company said it expects high-single-digit growth in reported EPS; nine-month diluted EPS was $9.71, up 9%.
Said on Jan 27, 2026
Union Pacific said in its Jan 27, 2026 earnings release that its 2026 capital plan was $3.3 billion.
Too early to tellWhat happened
The company raised the plan to $3.5 billion on Oct 22, 2026. Capital investments were $2,834 million in the first nine months.
Said on Jul 29, 2025
Union Pacific said on Jul 29, 2025 that it was targeting closing of the Norfolk Southern merger by early 2027.
Too early to tellWhat happened
The Q3 FY2026 10-Q says completion is now expected in the second half of 2027, after the Surface Transportation Board rejected the first application as incomplete in January 2026.
Said on Jan 27, 2026
Union Pacific said in its Jan 27, 2026 earnings release that its 2026 outlook was consistent with a 3-year EPS growth target of high single digit to low double digit a year through 2027.
Too early to tellWhat happened
Diluted EPS rose 8% in FY2025 to $11.98, and 9% in the first nine months of FY2026.
Sources (8)
- Form 10-K, fiscal year 2025 (ended Dec 31, 2025)
- Definitive proxy statement (DEF 14A), 2026 annual meeting
- Form 8-K, Item 5.02: CFO Jennifer L. Hamann to retire in early 2027 (Oct 16, 2026)
- Form 8-K, Item 5.02: W. Anthony Will elected director effective Jan 5, 2026 (Dec 12, 2025)
- Fourth quarter and full year 2025 earnings release (8-K Exhibit 99.1)
- Third quarter 2026 earnings release (8-K Exhibit 99.1)
- Press release: Union Pacific and Norfolk Southern to create America’s first transcontinental railroad (8-K Exhibit 99.1, Jul 29, 2025)
- Form 10-Q, Q3 FY2026 (quarter ended Sep 30, 2026)
08What could go wrong
What could go wrong for Union Pacific?
- Regulation
The merger may be delayed, changed or blocked
The Norfolk Southern merger needs Surface Transportation Board approval. The board rejected the first application as incomplete on Jan 16, 2026, accepted a revised one in May and denied motions to dismiss on Sep 18, 2026. Either side may owe a $2.5 billion termination fee in certain circumstances.
Watch Surface Transportation Board decisions and any conditions it sets; the company said in its Q3 FY2026 10-Q (Oct 22, 2026) that it expects completion in the second half of 2027.
- Debt
More debt after the merger
The company said in its Q3 FY2026 10-Q (Oct 22, 2026) that it expects to fund the about $20 billion cash part of the price with new debt and cash from operations. The 10-K says the combined company's higher debt may raise borrowing costs and limit dividends and buybacks. Total debt was $30,324 million on Sep 30, 2026.
Watch New debt issued for the deal and any rating agency action.
- Raw-material prices
Fuel prices
Fuel cost $1,040 million in Q3 FY2026, up from $616 million, as the average price rose to $4.21 a gallon from $2.56. Fuel surcharges raise revenue too, but the company says higher fuel prices added 1.4 points to its operating ratio.
Watch Fuel expense and the operating ratio in each quarterly release.
- Execution
Unions and strikes
Thirteen major rail unions represent about 83% of the workforce. Under the Railway Labor Act, agreements can be changed every five years, and the 10-K lists strikes and work stoppages among its risks.
Watch Results of the 2025 to 2029 labor negotiations, two of which were still open at a subsidiary.
- Legal
Hazardous materials and accidents
US law requires the railroad, as a common carrier, to carry certain hazardous materials such as chlorine, and the 10-K says an accident could lead to large claims and costs. Its derailment incident rate was 1.75 per million train miles in 2025.
Watch Derailment and injury rates in the 10-K, and claims accruals.
- Demand
Trade with Mexico and Asia
The 10-K says a significant portion of revenue comes from goods moving to and from Mexico, Canada and Southeast Asia. Freight to and from Mexico brought $2.9 billion in 2025.
Watch Premium and Mexico-related revenue in the releases and the 10-K.
- Competition
Competition from trucks, barges and BNSF
The 10-K says trucks usually win on transit time, barges compete for grain, and BNSF runs parallel routes. Q3 FY2026 service performance indexes were 92% for intermodal and 93% for manifest, down from 98% and 100%.
Watch Carloads by group and the service performance indexes in each release.
09Both sides
What do supporters and critics point to?
What supporters point to
- Q3 FY2026 net income was $2,076 million, up 16% from $1,788 million, and carloads rose 6%.
- The operating ratio fell from 62.3% in FY2023 to 59.8% in FY2025, as average employees fell from 31,490 to 29,287.
- Free cash flow of $5,499 million in FY2025 covered dividends paid of $3,236 million.
- Freight cars moved 225 miles a day in FY2025, up from 204 in FY2023, and time in terminals fell from 23.4 to 20.9 hours.
- Shareholders approved the Norfolk Southern share issuance with 99.5% of votes cast.
What critics point to
- Revenue grew 3.0% a year from FY2021 to FY2025 and net income 2.3% a year; diluted EPS grew faster, 4.8%, because buybacks cut the share count (Cityfort calculation from the FY2022 and FY2025 10-Ks).
- Q3 FY2026 revenue rose 15%, but freight revenue excluding fuel surcharge rose 6%, and fuel cost $1,040 million, up from $616 million.
- The merger calls for about $20 billion of cash and about 225 million new shares. The companies said on Jul 29, 2025 that they were targeting completion by early 2027; Union Pacific said in its Q3 FY2026 10-Q (Oct 22, 2026) that it expects completion in the second half of 2027.
- Return on average equity of 40.4% in FY2025 reflects equity reduced by $58,843 million of treasury stock; debt was 1.72 times equity at the end of 2025.
- Q3 FY2026 service performance indexes were 92% for intermodal and 93% for manifest, down from 98% and 100% a year earlier.
10What to watch next
What should you watch next at Union Pacific?
Next event
Q4 FY2026 results
Date not announced yet.
The Surface Transportation Board review
The board adopted a schedule on Aug 18, 2026 and denied motions to dismiss on Sep 18. The company said on Oct 22, 2026 that it expects completion in the second half of 2027.
Fuel and the operating ratio
The operating ratio was 59.1% in Q3 FY2026, with higher fuel prices adding 1.4 points. The company said on Oct 22, 2026 that it expects operating ratio improvement from its core business, with the reported ratio hurt by high fuel prices.
Cash building up for the deal
Cash and short-term investments were $3,086 million on Sep 30, 2026, up from $1,516 million at the end of 2025, with buybacks paused.
A new CFO
Jennifer L. Hamann plans to retire as CFO in early 2027; no successor was named on Oct 16, 2026.
11Key facts
Key facts about Union Pacific
- What does Union Pacific do?
- Union Pacific Corporation owns Union Pacific Railroad, a freight railroad with 32,889 route miles in 23 states in the western two-thirds of the US. Union Pacific had FY2025 revenue of $24,510 million and an average of 29,287 employees in 2025.
- How does Union Pacific make money, and what is its business model?
- Union Pacific's business model is charging shippers to move freight by rail, priced per carload or container. In FY2025, Union Pacific earned $23,220 million of freight revenue on 8,447,000 carloads, plus $1,290 million of other revenue, and kept operating income of $9,846 million.
- Is Union Pacific profitable?
- Union Pacific's FY2025 net income was $7,138 million, up from $6,747 million in FY2024, on revenue of $24,510 million. Union Pacific's Q3 FY2026 net income was $2,076 million, up from $1,788 million in Q3 FY2025, on revenue of $7,197 million.
- What is Union Pacific's revenue by business group?
- Union Pacific reports one segment, the railroad, and splits freight revenue into three groups. In FY2025, Union Pacific's Industrial group earned $8,604 million, Bulk $7,586 million and Premium $7,030 million, with $1,290 million of other revenues, for total revenue of $24,510 million.
- Who are Union Pacific's customers?
- Union Pacific carries freight for grain and fertilizer shippers, power companies, chemical, steel and lumber producers, automakers, and shipper agents, logistics companies and truckload carriers moving containers. Union Pacific names no customer as a large share of revenue; freight to and from Mexico brought $2.9 billion in 2025.
- Who owns Union Pacific?
- Union Pacific's largest holders named in its 2026 proxy were The Vanguard Group with 10.00% (holdings at Dec 31, 2025) and BlackRock with 7.08% (holdings at Dec 31, 2023). Union Pacific's directors and executive officers as a group held about 0.12% on Mar 13, 2026. Union Pacific has one class of common stock.
- What is Union Pacific's Bulk business?
- Union Pacific's Bulk group carries grain and grain products, fertilizer, food and refrigerated goods, and coal and renewables. Bulk freight revenue was $7,586 million in FY2025, 33% of Union Pacific's freight revenue; grain was the largest part at $3,926 million.
- What is Union Pacific's Industrial business?
- Union Pacific's Industrial group carries industrial chemicals and plastics, metals and minerals, forest products, and energy and specialized products such as petroleum, sand and waste. Industrial freight revenue was $8,604 million in FY2025, 37% of Union Pacific's freight revenue.
- What is Union Pacific's Premium business?
- Union Pacific's Premium group carries finished vehicles and auto parts ($2,398 million of FY2025 freight revenue) and intermodal containers and trailers ($4,632 million). Premium freight revenue was $7,030 million in FY2025, 30% of Union Pacific's freight revenue.
Terms on this page
- Capital expenditures (capex)
- Debt-to-equity
- Earnings per share (EPS)
- EBITDA
- Free cash flow
- Interest coverage
- Market cap
- Net debt
- Net margin
- P/E ratio
Each explains the term in plain English, with the same number from other companies on Cityfort.
Go deeper
More detail from the same filings. Open any section.
12What it sells
12What it sells
What does Union Pacific sell?
Bulk: grain, fertilizer, food and coal
Grain to export ports and processors, fertilizer, food and refrigerated goods, and coal for power plants. $7,586 million of FY2025 freight revenue, including $3,926 million from grain.
Industrial: chemicals, metals, lumber and energy products
Industrial chemicals and plastics ($2,512 million in FY2025), metals and minerals ($2,193 million), forest products ($1,290 million) and energy and specialized products such as petroleum, sand and waste ($2,609 million).
Automotive
Finished vehicles and auto parts, through more than 40 vehicle distribution centers it operates or reaches. $2,398 million of FY2025 freight revenue.
Intermodal containers
Shipping containers and truck trailers carried on rail cars, both imports from West Coast ports and domestic loads. $4,632 million of FY2025 freight revenue; each container or trailer counts as one carload.
Other services
Revenue from other subsidiaries ($718 million in FY2025) and accessorial charges for extra services ($475 million), among $1,290 million of other revenues.
What it does
- Does: Owns 26,294 of its 32,889 route miles and uses the rest under trackage rights or leases.
- Does: Works with other railroads on joint schedules to move freight to the Atlantic Coast, the Southeast, Canada and Mexico.
- Does: Recovers a significant amount of its fuel costs from customers through fuel surcharges, so revenue moves with fuel prices.
What it does not do
- Does not: Own Norfolk Southern yet: the merger had not closed by Sep 30, 2026, and the company said on Oct 22, 2026 that it expects completion in the second half of 2027.
- Does not: Report profit by business group: it treats the whole railroad as one segment.
- Does not: Name any customer as a large share of its revenue.
13How the money flows
13How the money flows · FY2025
How does money flow through Union Pacific?
Money in
- Operating revenues (freight $23,220M, other $1,290M)$24.5B
- Other income: real estate including land sales, interest and pension income$629M
The company
Union Pacific
$25.1B came in
Money out
- Compensation and benefits$4.9B
- Purchased services, equipment rents and other costs$4.9B
- Depreciation (wear on track and equipment)$2.5B
- Fuel$2.4B
- Interest on debt$1.3B
- Income tax$2.0B
- Net income$7.1B
- Shippers paid Union Pacific $23.2 billion to move freight in FY2025, and other services brought $1.3 billion.
- Staff cost $4.9 billion. Outside services, materials, equipment rents and other costs took another $4.9 billion.
- Wear on track and equipment (depreciation) cost $2.5 billion and fuel $2.4 billion, leaving operating income of $9,846 million.
- Other income of $629 million came in, including $250 million of industrial park land sales. Interest of $1,309 million and tax of $2,028 million went out.
- $7,138 million was left as net income.
14What it needs to run
14What it needs to run
What does Union Pacific need to run?
Track and land
32,889 route miles and 52,414 miles of total track at Dec 31, 2025. Properties, after depreciation, were $59,645 million, most of total assets of $69,698 million.
People
An average of 29,287 employees in 2025, down from 31,490 in 2023. Thirteen major rail unions represent about 83% of the workforce.
Diesel fuel
Fuel cost $2,390 million in FY2025. In Q3 FY2026 the average fuel price was $4.21 a gallon, up from $2.56 a year earlier.
Capital investment
Capital investments were $3,791 million in FY2025, including $311 million to buy out leased locomotives and freight cars. The 10-K names a small number of key suppliers of locomotives and rail among its risks.
15Competitors and what protects it
15Competitors and what protects it
Who does Union Pacific compete with?
BNSF Railway (Burlington Northern Santa Fe, LLC)
Union Pacific's 10-K calls it the main railroad competitor; BNSF runs parallel routes in many of Union Pacific's main traffic corridors.
Trucking companies (motor carriers)
The 10-K says trucks compete in all three business groups and generally beat railroads on transit time and timeliness; they also use public roads rather than private track.
Barge operators
The 10-K says barges on inland and Gulf Coast waterways can compete closely for grain and other bulk goods near its routes.
What protects the business
Each strength is scored 1 (weak) to 5 (strong) for the business, with the reason. It is not a rating of the share.
- A network that is hard to copy4 of 5
Union Pacific owns 26,294 route miles linking Pacific and Gulf Coast ports, the Midwest and all six major Mexico gateways. The 10-K notes that it must build and maintain its own track.
- Few rail rivals in the West3 of 5
The 10-K names one main railroad competitor, BNSF, with parallel routes in many corridors; trucks and barges compete for many of the same loads.
- Mix of goods carried3 of 5
No business group was more than 37% of FY2025 freight revenue, and grain, the largest commodity, was 16.9% (Cityfort calculation from FY2025 10-K).
Weak spot
Trucks are faster and use public roads
The 10-K says motor carriers generally have an advantage in transit time and timeliness, and that changes such as autonomous trucks or higher truck size limits could hurt its competitiveness.
16Where growth could come from
16Where growth could come from
Where could Union Pacific's growth come from?
Union Pacific said in its Oct 22, 2026 earnings release that it expects 2026 "reported earnings per share growth of high-single digit", operating ratio improvement from its core business with the reported ratio hurt by high fuel prices, and a capital plan of $3.5 billion. In its Jan 27, 2026 release it had pointed to mid-single-digit EPS growth and a $3.3 billion capital plan.
Norfolk Southern merger
EarlyCompany expects close in 2nd half 2027 (said Oct 22, 2026)
The deal would add Norfolk Southern's eastern network. Union Pacific said on Jul 29, 2025 that it expects about $2.75 billion a year of benefits from combining the two railroads; that is the company's statement, not a forecast by this page. Surface Transportation Board review is under way.
Status: Early, too early to judge.
Carload volume
Working2,293,000 carloads, Q3 FY2026
Up 6% from 2,163,000 in Q3 FY2025. Full-year carloads rose from 8,112,000 in FY2023 to 8,447,000 in FY2025.
Status: Working, on track against what the company said.
Intermodal containers
Working$1,517M revenue, Q3 FY2026
Up from $1,199 million in Q3 FY2025. Premium revenue was $2,188 million, up from $1,803 million.
Status: Working, on track against what the company said.
Operating ratio
Mixed59.1% in Q3 FY2026
Compared with 59.2% in Q3 FY2025. The company says higher fuel prices added 1.4 points; fuel cost $1,040 million, up from $616 million.
Status: Mixed, partly on track.
Workforce productivity
Working1,219 car miles per employee, Q3 FY2026
Up 5% from a year earlier, with an average of 28,540 employees, down 1%. The full-year figure rose from 1,000 in FY2023 to 1,132 in FY2025.
Status: Working, on track against what the company said.
Status compares progress with what the company itself said it would do: Working = on track against what the company said; Mixed = partly on track; Behind = behind the company's own plan; New = recently announced; Early = too early to judge.
Sources (6)
- Third quarter 2026 earnings release (8-K Exhibit 99.1)
- Fourth quarter and full year 2025 earnings release (8-K Exhibit 99.1)
- Press release: Union Pacific and Norfolk Southern to create America’s first transcontinental railroad (8-K Exhibit 99.1, Jul 29, 2025)
- Form 10-Q, Q3 FY2026 (quarter ended Sep 30, 2026)
- Form 10-K, fiscal year 2025 (ended Dec 31, 2025)
- Third quarter 2025 earnings release (8-K Exhibit 99.1)
17The company's own measures (non-GAAP)
17The company's own measures · FY2025 and Q3 FY2026, unless the row says otherwise
What do Union Pacific's own measures show?
Official (GAAP): Diluted EPS, FY2025
$11.98
Company's own measure: Adjusted diluted EPS, FY2025
$11.66
Leaves out $250 million of industrial park land sales, a $115 million deferred tax benefit in Q2, a crew staffing agreement cost and Norfolk Southern merger costs.
Official (GAAP): Diluted EPS, Q3 FY2026
$3.49
Company's own measure: Adjusted diluted EPS, Q3 FY2026
$3.53
Leaves out costs related to the Norfolk Southern merger.
Official (GAAP): Operating ratio, Q3 FY2026
59.1%
Company's own measure: Adjusted operating ratio, Q3 FY2026
58.8%
Operating ratio is operating expenses ÷ revenue. The adjusted figure leaves out merger costs.
Official (GAAP): Cash provided by operating activities, FY2025
$9.3B
Company's own measure: Company-defined free cash flow, FY2025
$2.3B
Union Pacific subtracts all cash used in investing ($3,762 million) and dividends paid ($3,236 million). Free cash flowCash from operations minus spending on buildings and equipment. Learn more as this page calculates it, operating cash flow minus capital investments, was $5,499 million.
Official (GAAP): Net income, FY2025
$7.1B
Company's own measure: Adjusted EBITDA, FY2025
$12.4B
Union Pacific's EBITDAOperating profit before wear-and-tear charges (depreciation and amortization). As a margin: per $100 of sales. ($12,940 million) adds tax, depreciation and interest back to net income, so it includes other income; its adjusted EBITDA makes further adjustments set out in the 10-K. EBITDA as this page calculates it, operating income plus depreciation, was $12,311 million.
Official (GAAP): Debt ÷ net income, 12 months to Sep 30, 2026
$4M
Company's own measure: Adjusted debt ÷ adjusted EBITDA, 12 months to Sep 30, 2026
2.4 x
Adjusted debt of $31,112 million includes $788 million of operating lease liabilities; adjusted EBITDA was $13,136 million. Both ratios are as the company states them.
Official (GAAP): Return on average common shareholders' equity, FY2025
40.4%
Company's own measure: Return on invested capital, FY2025
16.3%
The company's own measure of profit on debt plus equity. Return on equity is higher because equity is small after years of buybacks.
These are the company's own measures, defined by the company. They are not comparable across companies, and they are not added together. Each sits beside the nearest official (GAAP) figure.
Learn: Non-GAAP measures: what a company's "adjusted" numbers leave out
18Financial strength and debt
18Financial strength · Sep 30, 2026
How much debt does Union Pacific have?
- Total debt$30.3B
- Cash and investments$3.1B
- Net debt (debt minus cash)$27.2B
- Net worth (shareholders' money)$22.0B
- Debt to equity
- 1.38×
- $ of debt for every $1 of shareholders' money
- Interest cover
- 7.5×
- how many times operating profit covers interest
- Net debt of $27,238 million is total debt minus cash ($2,211 million) and short-term investments ($875 million) (Cityfort calculation from the Q3 FY2026 10-Q). Net debt was $30,298 million on Dec 31, 2025.
- Interest cover of 7.5 is FY2025 operating income of $9,846 million ÷ interest expense of $1,309 million (Cityfort calculation from FY2025 10-K).
- Operating lease liabilities of $788 million are not counted as debt here.
- Debt due within one year was $1,289 million on Sep 30, 2026. Principal due after 2030 was $27,412 million of $33,492 million on Dec 31, 2025, with notes due as late as 2072.
- A $2.0 billion revolving credit facility was undrawn on Dec 31, 2025.
- Equity is small next to assets of $72,609 million because past buybacks are held as treasury stock ($58,843 million on Dec 31, 2025).
- The Q3 FY2026 10-Q says the about $20 billion cash part of the Norfolk Southern price is expected to be funded with new debt and cash from operations; share buybacks are paused.
19Who owns it
19Who owns it · ownership as of Mar 13, 2026
Who owns Union Pacific?
- Officers and directors (as a group), shares
- 0.1%
Share classes
Holders of 5% or more
From the company's proxy statement (DEF 14A), later Schedule 13G filings and the share counts on its latest annual or quarterly report. Each holder row shows the date of its own filing.
Insider trades · Form 4 data as of Nov 6, 2026
What did Union Pacific's insiders report trading?
Union Pacific's insiders made 117 Form 4A filing an insider must make within two business days of buying or selling the company's shares. Learn more filings in the 12 months to Nov 6, 2026.
They reported no purchases and 5 sales (34,377 shares) in the open market or privately (codes P and S).
None of the sales were on forms with the Rule 10b5-1 plan box checked.
The same filings report 97 other share transactions (A: 74, F: 10, D: 5, M: 4, G: 2, J: 2).
They also report 52 transactions in options, stock units or other derivatives.
Insiders are a company's officers, directors and owners of more than 10% of a class of its shares. Most changes in their holdings must be reported to the SEC on a Form 4 within two business days. Source: SEC Form 4 filings on EDGAR.
- P
- a purchase in the open market or privately
- S
- a sale in the open market or privately
- A
- a grant, award or other acquisition from the company under Rule 16b-3
- D
- shares handed back to the company under Rule 16b-3
- F
- shares withheld or handed over to pay an exercise price or tax when an award is received, exercised or vests
- M
- exercise or conversion of an option or other derivative, exempt under Rule 16b-3
- G
- a bona fide gift
- J
- another acquisition or disposition, described in a footnote
Code meanings: General Instruction 8 of Form 4 (SEC).
The latest 25 of 102 transactions
Shares: A = acquired, D = disposed of. A price the filing gives only in a footnote shows as “See filing”. The 10b5-1 box is checked when at least one trade on the form was made under a Rule 10b5-1 plan. A Form 4/A replaces the form it amends. See all of Union Pacific's Form 4 filings on EDGAR.
Learn: How to read a proxy statement (DEF 14A): Nvidia's 2026 proxy · Form 4 insider filings: who files, the codes and the footnotes · Rule 10b5-1 trading plans: how insiders pre-schedule their trades
20What it does with profit
20What it does with profit
What does Union Pacific do with its profit?
Dividend per share
$5.44FY2025
Dividend paid for each share, by financial year.
$ per share
See the numbers
Buyback · Dec 31, 2021
Shares repurchased in FY2021.
$7.3B
Buyback · Dec 31, 2022
Shares repurchased in FY2022.
$6.3B
Buyback · Dec 31, 2023
Shares repurchased in FY2023.
$705M
Buyback · Dec 31, 2024
Shares repurchased in FY2024.
$1.5B
Buyback · Dec 31, 2025
Shares repurchased in FY2025, all in the first half; buybacks paused after the Norfolk Southern merger was announced.
$2.7B
Buyback · Sep 30, 2026
Shares repurchased in the first nine months of FY2026.
$26M
21Governance signals
21Governance signals
What do Union Pacific's governance filings show?
- Auditor
- Deloitte & Touche LLP
- Auditor changes
- None in the period covered
- Audit qualifications
- None reported
- Related-party dealings
- The 2026 proxy says the railroad paid Omaha Track and its affiliates about $21 million in 2025 for tie disposal, scrap removal and railcar repairs, and about $3.3 million for transload services. Omaha Track's CFO until April 2025 is the spouse of Union Pacific's former President; the proxy says she was not involved in these dealings.
- Credit rating
- Not checked for this page
Flags to know about
other · Oct 22, 2026
Pending Norfolk Southern merger
Each Norfolk Southern share would become one Union Pacific share plus $88.82 in cash: about 225 million new shares and about $20 billion of cash. Shareholders approved the share issuance on Nov 14, 2025. Either side may owe a $2.5 billion termination fee in certain circumstances. The company said in its Q3 FY2026 10-Q (Oct 22, 2026) that it expects completion in the second half of 2027.
other · Nov 6, 2025
Merger disclosure lawsuits
Three lawsuits challenging the mergers were filed in New York Supreme Court in October 2025, and demand letters from purported shareholders alleged deficiencies or omissions in the merger disclosures. The companies said the allegations are without merit and, without admitting any wrongdoing, filed supplemental disclosures on Nov 6, 2025.
other · Oct 16, 2026
CFO to retire
Chief Financial Officer Jennifer L. Hamann plans to retire in early 2027; no successor was named in the 8-K.
disclosure
Credit ratings not named in the filings
The FY2025 10-K and the 2026 10-Qs do not name Union Pacific's credit ratings. They say pricing on its credit facility depends on its senior unsecured debt ratings, and that the merger could lead rating agencies to act on the combined company's ratings.
disclosure
What the filings do not break out
The railroad is one reportable segment, so there is no profit by business group. The 10-K names no customer and gives no customer concentration.
Sources (6)
- Definitive proxy statement (DEF 14A), 2026 annual meeting
- Form 10-Q, Q3 FY2026 (quarter ended Sep 30, 2026)
- Form 8-K, Item 5.07: special meeting vote on the Norfolk Southern share issuance (Nov 17, 2025)
- Form 8-K, Item 8.01: merger-related lawsuits and supplemental disclosures (Nov 6, 2025)
- Form 8-K, Item 5.02: CFO Jennifer L. Hamann to retire in early 2027 (Oct 16, 2026)
- Form 10-K, fiscal year 2025 (ended Dec 31, 2025)
22What the market paid
22What the market paid · price as of Nov 5, 2026
What did the market pay for Union Pacific on Nov 5, 2026?
Price as of Nov 5, 2026 (shown for education; prices change daily).
Price as of Nov 5, 2026: a $297.95 close, from Nasdaq's historical price table for UNP; Union Pacific's shares are listed on the NYSE. Market value = $297.95 × 594,250,416 shares (10-Q cover, Oct 16, 2026) = $177,057 million (Cityfort calculation from the Nov 5, 2026 closing price and the Q3 FY2026 10-Q). P/E is price ÷ earnings per share: 23.2 on the last four quarters' diluted EPS of $12.83 (Cityfort calculation from the Nov 5, 2026 closing price and the Q4 FY2025 to Q3 FY2026 earnings releases), or 24.9 on FY2025 diluted EPS of $11.98. P/B is market value ÷ shareholders' equity of $22,018 million on Sep 30, 2026: 8.0.
- Share price
- $297.95
- Market value (market cap)
- $177.1B
- P/E
- 23.2×
- P/B
- 8×
More price-based ratios · as of Nov 5, 2026
Each ratio divides a number from the company's filings by the market value or share price on Nov 5, 2026. Prices change daily, so these ratios do too.
Price to sales (P/S)
6.7×
$177.1B market value ÷ $26.4B revenue (four quarters to Sep 30, 2026) = 6.7×
Cityfort calculation from the Nov 5, 2026 closing price and the Q4 FY2025 to Q3 FY2026 10-Qs and earnings releases. Source: UNP historical daily prices, Oct 15 to Nov 5, 2026 (Nasdaq.com historical table; UNP is listed on the NYSE; close of Nov 5, 2026: $297.95); Form 10-Q, Q3 FY2026 (quarter ended Sep 30, 2026); Fourth quarter and full year 2025 earnings release (8-K Exhibit 99.1) and 4 more
How price ratios workDividend yield
1.83%
$5.44 dividends per share (FY2025) ÷ $297.95 share price = 1.83%
Cityfort calculation from the FY2025 10-K and the Nov 5, 2026 closing price. Source: UNP historical daily prices, Oct 15 to Nov 5, 2026 (Nasdaq.com historical table; UNP is listed on the NYSE; close of Nov 5, 2026: $297.95); Form 10-Q, Q3 FY2026 (quarter ended Sep 30, 2026); Fourth quarter and full year 2025 earnings release (8-K Exhibit 99.1) and 4 more
What dividend yield meansFree cash flow yield
3.1%
$5.5B free cash flow (FY2025) ÷ $177.1B market value = 3.1%
Cityfort calculation from the FY2025 10-K and the Nov 5, 2026 closing price. Source: UNP historical daily prices, Oct 15 to Nov 5, 2026 (Nasdaq.com historical table; UNP is listed on the NYSE; close of Nov 5, 2026: $297.95); Form 10-Q, Q3 FY2026 (quarter ended Sep 30, 2026); Fourth quarter and full year 2025 earnings release (8-K Exhibit 99.1) and 4 more
What free cash flow means
Shares used for the market value: 594.25 million ($297.95 × 594.25 million shares ≈ $177.1B). Source: Form 10-Q, Q3 FY2026 (quarter ended Sep 30, 2026); Form 10-K, fiscal year 2025 (ended Dec 31, 2025)
Source: UNP historical daily prices, Oct 15 to Nov 5, 2026 (Nasdaq.com historical table; UNP is listed on the NYSE; close of Nov 5, 2026: $297.95); Form 10-Q, Q3 FY2026 (quarter ended Sep 30, 2026); Fourth quarter and full year 2025 earnings release (8-K Exhibit 99.1) and 4 more
Sources (7)
- UNP historical daily prices, Oct 15 to Nov 5, 2026 (Nasdaq.com historical table; UNP is listed on the NYSE; close of Nov 5, 2026: $297.95)
- Form 10-Q, Q3 FY2026 (quarter ended Sep 30, 2026)
- Fourth quarter and full year 2025 earnings release (8-K Exhibit 99.1)
- First quarter 2026 earnings release (8-K Exhibit 99.1)
- Second quarter 2026 earnings release (8-K Exhibit 99.1)
- Third quarter 2026 earnings release (8-K Exhibit 99.1)
- Form 10-K, fiscal year 2025 (ended Dec 31, 2025)
23How it got here
23How it got here
How did Union Pacific get here?
1969
Milestone
Holding company formed
Union Pacific Corporation was incorporated in Utah in 1969; its main operating company is Union Pacific Railroad.
2021
Milestone
Large buybacks
Union Pacific bought back $7,291 million of shares in FY2021 and $6,282 million in FY2022, while issuing $4,201 million and $6,080 million of debt; total debt rose from $29,729 million at the end of 2021 to $33,326 million at the end of 2022.
2023
Business-model change
New CEO and a separate Chairman
Jim Vena became CEO on Aug 14, 2023, and the board split the Chairman and CEO roles. The operating ratio was 62.3% in FY2023 and buybacks fell to $705 million.
2025
Business-model change
Deal to buy Norfolk Southern
On Jul 29, 2025, Union Pacific announced a merger with Norfolk Southern, an eastern railroad, to create what it called the first transcontinental railroad in the US. Buybacks were paused.
2025
Milestone
Shareholder vote and regulator filing
Shareholders approved the share issuance on Nov 14, 2025, with 99.5% of votes cast in favor. The two railroads filed their joint application with the Surface Transportation Board on Dec 19, 2025.
2026
Milestone
Regulator review under way
The Surface Transportation Board rejected the first application as incomplete on Jan 16, 2026, accepted a revised one on May 28, set a schedule on Aug 18 and denied motions to dismiss on Sep 18.
Sources (9)
- Form 10-K, fiscal year 2025 (ended Dec 31, 2025)
- Form 10-K, fiscal year 2022 (ended Dec 31, 2022)
- Definitive proxy statement (DEF 14A), 2026 annual meeting
- Form 8-K, Item 1.01: merger agreement with Norfolk Southern (filed Jul 29, 2025)
- Press release: Union Pacific and Norfolk Southern to create America’s first transcontinental railroad (8-K Exhibit 99.1, Jul 29, 2025)
- Form 10-Q, Q3 FY2026 (quarter ended Sep 30, 2026)
- Form 8-K, Item 5.07: special meeting vote on the Norfolk Southern share issuance (Nov 17, 2025)
- Press release: Union Pacific shareholders approve Norfolk Southern merger (8-K Exhibit 99.1, Nov 14, 2025)
- Press release: STB merger application filed (8-K Exhibit 99.1, Dec 19, 2025)
24Sources and changes
Where every number on this page comes from
Sources (21 documents)
- S1Form 10-K, fiscal year 2025 (ended Dec 31, 2025) · Union Pacific Corporation (SEC EDGAR) · Tier 1: company or exchange filing · Feb 6, 2026
- S3Form 10-K, fiscal year 2022 (ended Dec 31, 2022) · Union Pacific Corporation (SEC EDGAR) · Tier 1: company or exchange filing · Feb 10, 2023
- S4Form 10-Q, Q3 FY2026 (quarter ended Sep 30, 2026) · Union Pacific Corporation (SEC EDGAR) · Tier 1: company or exchange filing · Oct 22, 2026
- S7Third quarter 2026 earnings release (8-K Exhibit 99.1) · Union Pacific Corporation (SEC EDGAR) · Tier 1: company or exchange filing · Oct 22, 2026
- S8Second quarter 2026 earnings release (8-K Exhibit 99.1) · Union Pacific Corporation (SEC EDGAR) · Tier 1: company or exchange filing · Jul 23, 2026
- S9First quarter 2026 earnings release (8-K Exhibit 99.1) · Union Pacific Corporation (SEC EDGAR) · Tier 1: company or exchange filing · Apr 23, 2026
- S10Fourth quarter and full year 2025 earnings release (8-K Exhibit 99.1) · Union Pacific Corporation (SEC EDGAR) · Tier 1: company or exchange filing · Jan 27, 2026
- S11Third quarter 2025 earnings release (8-K Exhibit 99.1) · Union Pacific Corporation (SEC EDGAR) · Tier 1: company or exchange filing · Oct 23, 2025
- S12Second quarter 2025 earnings release (8-K Exhibit 99.1) · Union Pacific Corporation (SEC EDGAR) · Tier 1: company or exchange filing · Jul 24, 2025
- S13First quarter 2025 earnings release (8-K Exhibit 99.1) · Union Pacific Corporation (SEC EDGAR) · Tier 1: company or exchange filing · Apr 24, 2025
- S14Fourth quarter and full year 2024 earnings release (8-K Exhibit 99.1) · Union Pacific Corporation (SEC EDGAR) · Tier 1: company or exchange filing · Jan 23, 2025
- S15Definitive proxy statement (DEF 14A), 2026 annual meeting · Union Pacific Corporation (SEC EDGAR) · Tier 1: company or exchange filing · Mar 25, 2026
- S16Form 8-K, Item 1.01: merger agreement with Norfolk Southern (filed Jul 29, 2025) · Union Pacific Corporation (SEC EDGAR) · Tier 1: company or exchange filing · Jul 29, 2025
- S17Press release: Union Pacific and Norfolk Southern to create America’s first transcontinental railroad (8-K Exhibit 99.1, Jul 29, 2025) · Union Pacific Corporation (SEC EDGAR) · Tier 1: company or exchange filing · Jul 29, 2025
- S18Form 8-K, Item 8.01: merger-related lawsuits and supplemental disclosures (Nov 6, 2025) · Union Pacific Corporation (SEC EDGAR) · Tier 1: company or exchange filing · Nov 6, 2025
- S19Form 8-K, Item 5.07: special meeting vote on the Norfolk Southern share issuance (Nov 17, 2025) · Union Pacific Corporation (SEC EDGAR) · Tier 1: company or exchange filing · Nov 17, 2025
- S20Press release: Union Pacific shareholders approve Norfolk Southern merger (8-K Exhibit 99.1, Nov 14, 2025) · Union Pacific Corporation (SEC EDGAR) · Tier 1: company or exchange filing · Nov 17, 2025
- S21Form 8-K, Item 5.02: W. Anthony Will elected director effective Jan 5, 2026 (Dec 12, 2025) · Union Pacific Corporation (SEC EDGAR) · Tier 1: company or exchange filing · Dec 12, 2025
- S22Press release: STB merger application filed (8-K Exhibit 99.1, Dec 19, 2025) · Union Pacific Corporation (SEC EDGAR) · Tier 1: company or exchange filing · Dec 19, 2025
- S24Form 8-K, Item 5.02: CFO Jennifer L. Hamann to retire in early 2027 (Oct 16, 2026) · Union Pacific Corporation (SEC EDGAR) · Tier 1: company or exchange filing · Oct 16, 2026
- S25UNP historical daily prices, Oct 15 to Nov 5, 2026 (Nasdaq.com historical table; UNP is listed on the NYSE; close of Nov 5, 2026: $297.95) · Nasdaq, Inc. · Tier 1: company or exchange filing · Nov 5, 2026
Changes to this page (v1 · Nov 6, 2026)
- v1 · Nov 6, 2026First version, through Q3 FY2026 (quarter ended Sep 30, 2026), including the pending Norfolk Southern merger. (first version)
Numbers come only from tier 1 and tier 2 sources. Read how we research.
Disclaimer
For learning only. Cityfort is not a registered investment adviser or broker-dealer and does not recommend buying or selling any security. Prices shown are dated and may be out of date.
Investing in securities involves risk, including loss of capital. Before making any investment decision, do your own research and consider consulting a registered investment adviser or other qualified professional.
Cityfort, its owners and contributors may or may not hold securities of companies covered. Cityfort is not paid by any company it covers. Content is not an offer or solicitation to buy or sell any security, including in any initial public offering.
Read the positions policyRead the full disclaimerHide the full disclaimer
Cityfort publishes general educational content that explains how listed companies work. Cityfort is not registered with the US Securities and Exchange Commission or any state securities regulator as an investment adviser, and is not a broker-dealer or a member of FINRA. Cityfort does not provide investment, tax or legal advice, recommendations, ratings, price targets or any opinion on whether to buy, sell or hold any security. Nothing on the site is tailored to any person's circumstances.
All information is taken from publicly available sources, mainly company filings with the SEC, which are listed on each page with dates. We work to keep it accurate and correct errors publicly, but we do not guarantee that it is complete, accurate or up to date. Any market price or price-based ratio shown is dated, may be out of date by the time you read it, and is included only to explain concepts.
Statements by company management, including forward-looking statements and guidance, are reported as the company's statements, with their date and source; they are not our forecasts. Adjusted (non-GAAP) figures are the company's own measures and are shown next to the official (GAAP) figures.