Industrials · NYSE: VRT
Vertiv: how the business works
Vertiv makes and services the power and cooling equipment that keeps data centers running, with net sales of $10.2 billion in FY2025.
By Hardik Bhandare · Checked against filings: . Editorial policy. Corrections
Follow Vertiv
Email me when Vertiv's page is updated after earnings.
We'll send a confirmation email first. See our privacy policy.
Vertiv Holdings Co · Westerville, Ohio · Founded 1965
Updated for Q3 FY2026 · checked
- Net sales, FY2025
- $10.2B
- Net income, FY2025
- $1.3B
- Net sales, Q3 FY2026
- $4.3B
- Employees, Dec 31, 2025
- About 34,000
- Service centers
- Over 300
The short version
Vertiv in 5 points
1 · What it sells
Vertiv sells power equipment, cooling systems, racks and switchgear for data centers and other sites, plus service and spare parts, with net sales of $10.2 billion in FY2025.
2 · Who pays it
Vertiv does not disclose revenue by customer or end market; by region of sale, the Americas were 62% of FY2025 net sales, Asia Pacific 20% and Europe, Middle East & Africa 18%.
3 · What it keeps from $100
Of every $100 of FY2025 net sales, Vertiv kept $13.03 as net income and $17.89 as operating profit, with no warrant gains or losses in net income that year.
4 · Where the operating profit comes from
The Americas earned 74.1% of Vertiv's FY2025 segment profit, Europe, Middle East & Africa 16.3% and Asia Pacific 9.6%.
5 · The one thing to watch
Customer advances (deferred revenue) rose from $1,814.7 million on Dec 31, 2025 to $4,120.5 million on Sep 30, 2026, while inventories rose from $1,456.5 million to $3,288.4 million.
Sources: From Vertiv's FY2025 10-K and Q3 FY2026 earnings release · checked
See the full receipt and the management scorecard below
01Where the money goes · FY2025
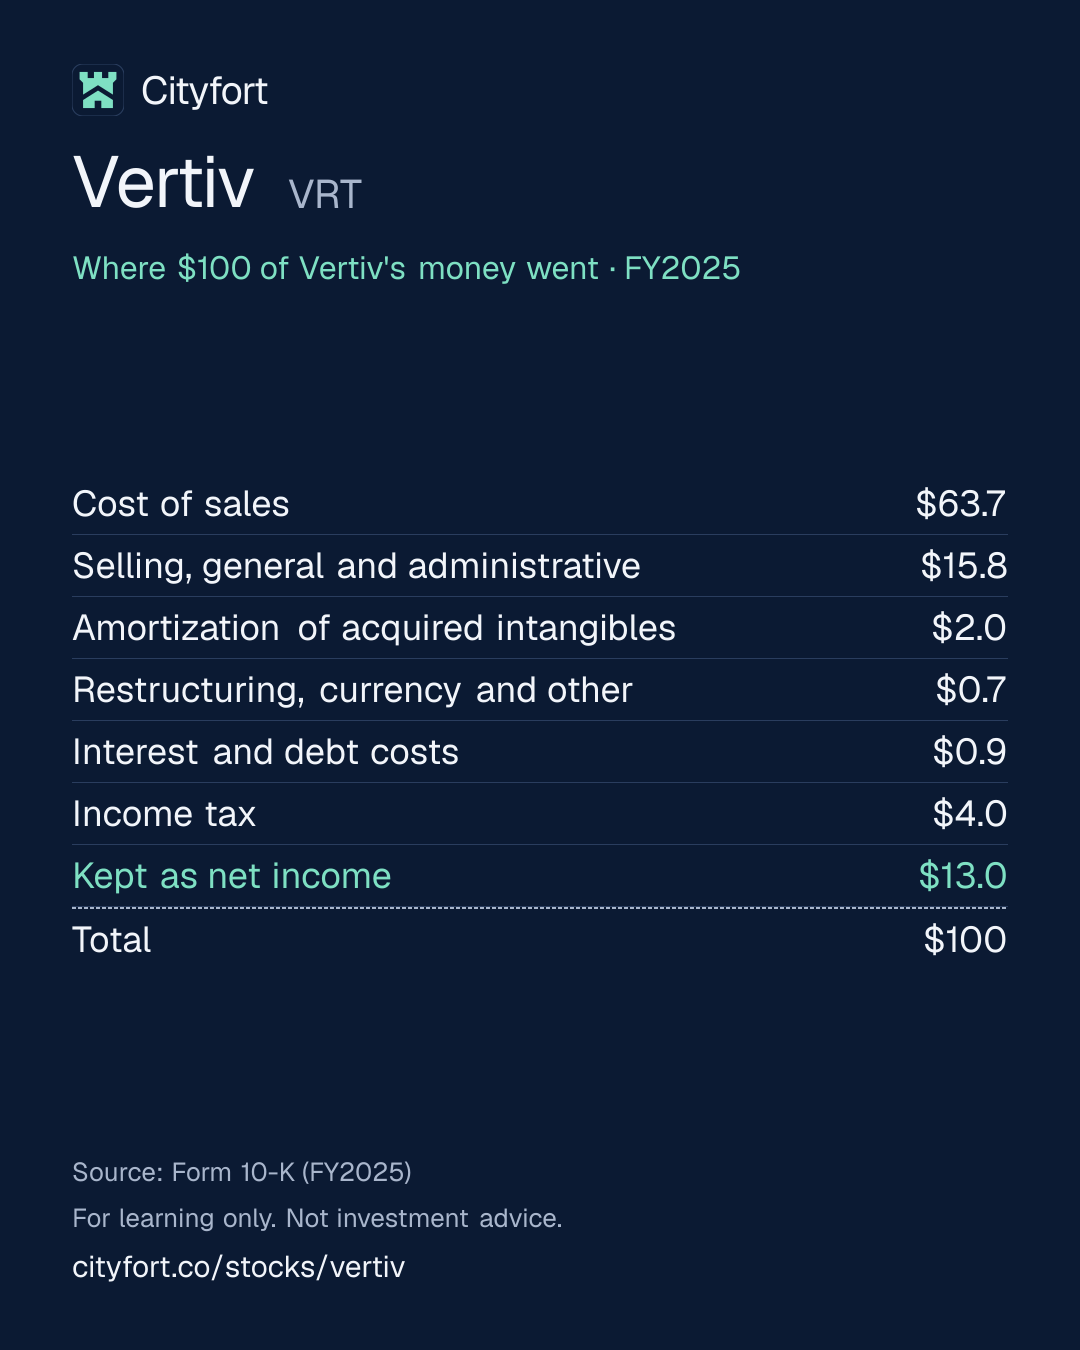
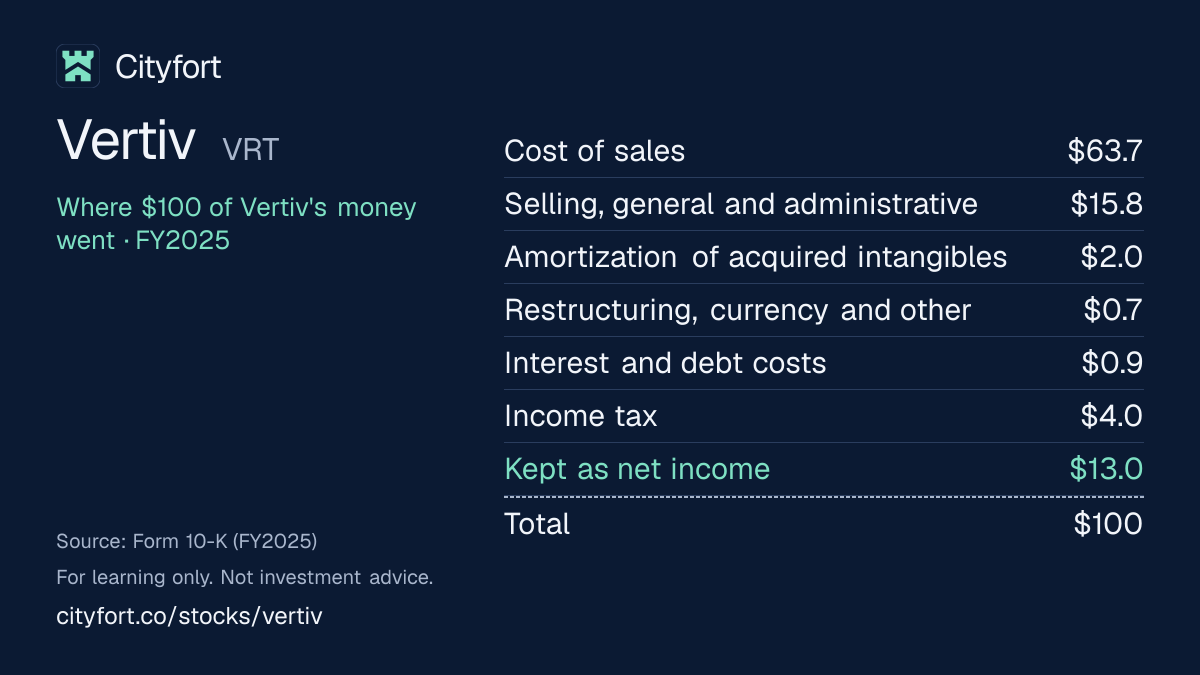
Where does $100 of Vertiv's money go?
Vertiv · FY2025
Receipt for every $100
| Cost of sales | $63.7 |
|---|---|
| Selling, general and administrative | $15.8 |
| Amortization of acquired intangibles | $2.0 |
| Restructuring, currency and other | $0.7 |
| Interest and debt costs | $0.9 |
| Income tax | $4.0 |
| Kept as net income | $13.0 |
| Total | $100 |
Each line = amount ÷ total money in × 100. Lines may not add to exactly $100 because of rounding.
How this is worked out
Cityfort calculation from the FY2025 10-K. Of every $100 of FY2025 net sales: each line = line ÷ $10,229.9 million × 100. Operating profit was $1,829.7 million, or $17.89 of each $100. Restructuring ($54.5 million), currency losses ($12.0 million) and other operating costs ($0.8 million) are grouped together. FY2025 had no warrant gains or losses, unlike FY2021 to FY2024.
Save this receipt as an image:
1080 × 1350 PNG for Instagram, LinkedIn1200 × 675 PNG for X
Embed this receipt
Paste this code into a blog or website to show the receipt, with a link back to this page:
Each week: one company explained in 5 points, picked by earnings date.
Free, no tips, unsubscribe anytime.
We'll send a confirmation email. See our privacy policy.
02The business in one line
What does Vertiv do?
Data center owners, telecom networks and industrial sites pay Vertiv for power and cooling equipment and for servicing it; most of the money goes on making that equipment, and $13.03 of every $100 of FY2025 net sales was left as net income.
- The Americas were 62% of FY2025 net sales, Asia Pacific 20% and Europe, Middle East & Africa 18%. Vertiv discloses no revenue by customer or end market.
- Cost of sales, for products and services, took $63.68 of every $100 in FY2025. The Americas earned 74.1% of segment profit (Cityfort calculation from the FY2025 10-K).
03Who pays it
Who pays Vertiv?
Hyperscale and cloud companies
Not disclosed
The largest data center builders. Vertiv's FY2025 10-K names Microsoft, AWS and Google Cloud as examples of companies in this market, not as disclosed customers.
Colocation operators
Not disclosed
Companies that rent data center space to others. The 10-K names Digital Realty, Equinix, Compass and QTS as examples of companies in this market, not as disclosed customers.
Newer AI cloud providers
Not disclosed
Companies the 10-K calls neoclouds. It names CoreWeave and Nebius as examples of companies in this market, not as disclosed customers.
Enterprises
Not disclosed
Companies running their own data centers. The 10-K names Goldman Sachs, J.P. Morgan, Walmart and Allianz as examples of companies in this market, not as disclosed customers.
Communication networks, commercial and industrial sites
Not disclosed
Telecom networks, government agencies, utilities and industrial plants.
How spread out the customers are
Vertiv's FY2025 10-K gives no revenue by customer or end market and names no 10% customer. Its risk factors say large customers make up a material portion of its customer base and have greater purchasing power. By region of sale, the Americas were 62% of FY2025 net sales, Asia Pacific 20% and Europe, Middle East & Africa 18%.
04Why it makes money
Why does Vertiv make money?
Sales grew faster than overhead, so more of each $100 reached operating profit.
Net sales roughly doubled from FY2021 to FY2025, while selling and administrative costs rose from $1,109.0 million to $1,617.8 million. Gross margin rose from 30.5% to 36.3% over the same years. Customers also pay ahead on orders: deferred revenue reached $4,120.5 million on Sep 30, 2026.
Operating profit per $100 of net sales
$5.2$17.9
FY2021 to FY2025
- Data center builders order power and cooling equipment
- Large orders bring advance payments
- Factories build and ship against the backlog
- Installed equipment needs service and spare parts
- Cash funds capacity, research and acquisitions
- A wider product range is offered on the next order
↺ Step 6 feeds back into step 1.
05Business segments · FY2025
Which businesses make up Vertiv?
Americas
62%North and South America. Net sales rose 41.9% in FY2025; segment profit was 26.8% of sales and 74.1% of the three segments' profit. Shares are a Cityfort calculation from the FY2025 10-K.
Revenue $6.4B · Operating profit $1.7B
Asia Pacific
20%Net sales rose 17.5% in FY2025. Segment profit was 11.0% of sales, the lowest of the three regions, and 9.6% of segment profit.
Revenue $2.0B · Operating profit $222M
Europe, Middle East & Africa
18%Net sales rose 1.7% in FY2025 while segment profit fell 14.1%, which Vertiv put down to mix, operational inefficiencies and added capacity. 16.3% of segment profit.
Revenue $1.8B · Operating profit $377M
How the mix changed
- Americas
- Asia Pacific
- Europe, Middle East & Africa
Revenue by segment, FY2021 to FY2025.
US$
See the numbers
06The numbers · Consolidated · US$
How has Vertiv done?
Revenue
$10.2BFY2025
Net sales rose every year, from $4,998.1 million in FY2021 to $10,229.9 million in FY2025, and were $4,312.8 million in Q3 FY2026 alone.
US$
See the numbers
Net profit
$1.3BFY2025
Net income moved with non-cash warrant revaluations until FY2024, which carried a $449.2 million warrant loss, and reached $1,332.8 million in FY2025 with no warrant charge.
US$
See the numbers
Profit kept per $100 of revenue
$13.0FY2025
Net income per $100 of net sales was $13.0 in FY2025, up from $6.2 in FY2024, while operating profit per $100 rose from $17.1 to $17.9.
$ of profit per $100 of revenue (net margin)
See the numbers
Free cash flow
$1.9BFY2025
Free cash flow, operating cash flow minus capital spending, went from minus $252.8 million in FY2022 to $1,893.8 million in FY2025 (Cityfort calculation from the FY2023 and FY2025 10-Ks).
US$ · cash from operations minus spending on plants and equipment
See the numbers
See all yearly numbers
EBITDA here = operating income plus depreciation and amortization (from the cash flow statement). Fiscal years are the company's own (Fiscal year ends Dec 31). Net profit is the share belonging to the company's owners.
Download Vertiv's yearly and quarterly numbers (CSV, with source ids)
Learn: Fiscal years that don't end in December: Nvidia's FY2027 explained · Stock-based compensation and dilution: pay that becomes shares
Sources (11)
- Form 10-K, fiscal year 2023 (ended Dec 31, 2023)
- Form 10-K, fiscal year 2025 (ended Dec 31, 2025)
- Q3 2024 earnings release (8-K Ex. 99.1), quarter ended Sep 30, 2024
- Q4 and full-year 2024 earnings release (8-K Ex. 99.1), quarter ended Dec 31, 2024
- Q1 2025 earnings release (8-K Ex. 99.1), quarter ended Mar 31, 2025
- Q2 2025 earnings release (8-K Ex. 99.1), quarter ended Jun 30, 2025
- Q3 2025 earnings release (8-K Ex. 99.1), quarter ended Sep 30, 2025
- Q3 2026 earnings release (8-K Ex. 99.1), quarter ended Sep 30, 2026
- Q4 and full-year 2025 earnings release (8-K Ex. 99.1), quarter ended Dec 31, 2025
- Q1 2026 earnings release (8-K Ex. 99.1), quarter ended Mar 31, 2026
- Q2 2026 earnings release (8-K Ex. 99.1), quarter ended Jun 30, 2026
07Who runs it
Who runs Vertiv, and did they deliver?
Giordano Albertazzi
Chief Executive Officer · since 2023
CEO and director since Jan 1, 2023; earlier he ran Vertiv's Americas and Europe, Middle East & Africa regions. His 2025 total pay was $18,311,719, 658 times the median employee's $27,811.
David M. Cote
Executive Chairman · since 2020
Executive Chairman since Feb 7, 2020. He led GS Acquisition Holdings Corp, the listed shell that combined with Vertiv, and was earlier Honeywell's Chairman and CEO.
Craig Chamberlin
Chief Financial Officer · since 2025
Since Nov 10, 2025, succeeding David Fallon, who retired on Nov 9, 2025.
What they said, and what happened
3 delivered · 1 too early to tell
Said on Feb 12, 2025
Vertiv said in its Q4 FY2024 earnings release that it expected FY2025 net sales of $9,125 million to $9,275 million.
DeliveredWhat happened
FY2025 net sales were $10,229.9 million, above the range.
Said on Feb 11, 2026
Vertiv said in its Q4 FY2025 earnings release that it expected Q1 FY2026 net sales of $2,500 million to $2,700 million.
DeliveredWhat happened
Q1 FY2026 net sales were $2,649.5 million, inside the range.
Said on Jul 29, 2026
Vertiv said in its Q2 FY2026 earnings release that it expected Q3 FY2026 adjusted diluted EPS (its own measure) of $1.77 to $1.83.
DeliveredWhat happened
Q3 FY2026 adjusted diluted EPS was $2.21. GAAP diluted EPS was $1.95.
Said on Oct 28, 2026
Vertiv said in its Q3 FY2026 earnings release that it expected FY2026 net sales of $14,450 million to $14,850 million.
Too early to tellWhat happened
Net sales for the first nine months of FY2026 were $10,236.6 million, as reported in the Q3 FY2026 earnings release.
Sources (8)
- 2026 proxy statement (DEF 14A), annual meeting 2026
- 8-K filed Oct 14, 2025, Item 5.02: Craig Chamberlin appointed CFO effective Nov 10, 2025; David Fallon retires Nov 9, 2025
- Q4 and full-year 2024 earnings release (8-K Ex. 99.1), quarter ended Dec 31, 2024
- Form 10-K, fiscal year 2025 (ended Dec 31, 2025)
- Q4 and full-year 2025 earnings release (8-K Ex. 99.1), quarter ended Dec 31, 2025
- Q1 2026 earnings release (8-K Ex. 99.1), quarter ended Mar 31, 2026
- Q2 2026 earnings release (8-K Ex. 99.1), quarter ended Jun 30, 2026
- Q3 2026 earnings release (8-K Ex. 99.1), quarter ended Sep 30, 2026
08What could go wrong
What could go wrong for Vertiv?
- Demand
Reliance on data center spending
Vertiv's FY2025 10-K says a substantial portion of its business depends on growth in customers' data centers and communication networks. It names shifts in AI spending and capacity built ahead of demand as risks.
Watch Organic order growth and Americas net sales in each earnings release ($2,988.8 million in Q3 FY2026).
- Concentration
Large customers with bargaining power
Large customers make up a material portion of Vertiv's customer base and have greater purchasing power, its 10-K says. Vertiv gives no customer shares, so the exposure cannot be read from the filings.
Watch Any customer concentration disclosure in the FY2026 10-K, and gross margin (38.1% in Q3 FY2026).
- Execution
Orders can be canceled or delayed
The $15.0 billion backlog at Dec 31, 2025 can be canceled or rescheduled, and long sales cycles make results uneven. Inventories reached $3,288.4 million on Sep 30, 2026, against $4,120.5 million of customer advances.
Watch Inventories and customer advances on each quarter's balance sheet.
- Execution
Acquisitions and contingent payments
Vertiv paid $1.45 billion for UtilityInnovation Group, with up to $1.15 billion more tied to earnings targets. PurgeRite's earnout liability was $239.6 million, and contingent payment expense was $95.5 million in the first nine months of FY2026.
Watch Contingent payment expense in "other operating expense" and goodwill in the FY2026 10-K.
- Execution
Uneven results in Europe, Middle East & Africa
EMEA segment profit fell 14.1% in FY2025, and EMEA net sales fell 20.3% in Q1 FY2026 before rising 22.8% in Q3 FY2026.
Watch EMEA net sales and segment profit margin (28.0% in Q3 FY2026) each quarter.
- Competition
Competition and new cooling technology
The 10-K names Schneider Electric, Eaton, Legrand and Huawei as large rivals with greater resources. It says shifts in power and cooling technology could reduce demand for existing products.
Watch Segment profit margins in each earnings release, and engineering spending in the 10-K ($441.7 million in FY2025).
- Legal
Pending shareholder lawsuits
A securities class action and derivative suits allege misleading statements on inflation, supply chain and pricing in 2021 and 2022. Vertiv says it cannot predict the outcome.
Watch Legal proceedings notes in each 10-Q and 10-K.
Sources (5)
- Form 10-K, fiscal year 2025 (ended Dec 31, 2025)
- Q3 2026 earnings release (8-K Ex. 99.1), quarter ended Sep 30, 2026
- 8-K filed Oct 27, 2026, Ex. 99.1: Vertiv completes acquisition of UtilityInnovation Group
- Form 10-Q, Q3 fiscal 2026 (quarter ended Sep 30, 2026)
- Q1 2026 earnings release (8-K Ex. 99.1), quarter ended Mar 31, 2026
09Both sides
What do supporters and critics point to?
What supporters point to
- Q3 FY2026 net sales were $4,312.8 million, up from $2,675.8 million a year earlier, and net income was $764.5 million, up from $398.5 million.
- Backlog was $15.0 billion at Dec 31, 2025, up from $7.2 billion a year earlier, and Vertiv said Q3 FY2026 organic orders rose over 100%.
- Operating profit per $100 of net sales rose from $5.2 in FY2021 to $17.9 in FY2025.
- Vertiv held net cash of $783.2 million on Sep 30, 2026 (Cityfort calculation from the Q3 FY2026 10-Q and earnings release), and Moody's, S&P and Fitch rate its debt investment grade.
- Free cash flow was $1,893.8 million in FY2025, up from $1,152.3 million in FY2024.
What critics point to
- Vertiv names no customer shares, while its 10-K says large customers have greater purchasing power.
- Operating cash flow of $2,660.6 million in the first nine months of FY2026 included $2,312.9 million from higher customer advances.
- Inventories rose from $1,456.5 million to $3,288.4 million in the nine months to Sep 30, 2026.
- EMEA segment profit fell 14.1% in FY2025, and EMEA net sales fell 20.3% in Q1 FY2026.
- UtilityInnovation Group can earn up to $1.15 billion more, and PurgeRite's earnout liability was $239.6 million on Sep 30, 2026.
10What to watch next
What should you watch next at Vertiv?
Next event
Q4 FY2026 results
Date not announced yet.
Customer advances against inventories
Customer advances (deferred revenue) rose from $1,814.7 million on Dec 31, 2025 to $4,120.5 million on Sep 30, 2026, while inventories rose from $1,456.5 million to $3,288.4 million.
Q4 FY2026 against the company's range
Vertiv said on Oct 28, 2026 that it expects Q4 FY2026 net sales of $4,313 million to $4,513 million. Q3 FY2026 net sales were $4,312.8 million.
UtilityInnovation Group
Closed Oct 26, 2026 for $1.45 billion, with up to $1.15 billion more tied to earnings over 12 and 24 months. It is not in the Q3 FY2026 numbers.
Europe, Middle East & Africa
EMEA net sales were $544.7 million in Q3 FY2026, up 22.8%, after a 20.3% fall in Q1 FY2026.
11Key facts
Key facts about Vertiv
- What does Vertiv do?
- Vertiv designs, makes, installs and services power and cooling equipment for data centers, communication networks and commercial and industrial sites. Vertiv had FY2025 net sales of $10,229.9 million and about 34,000 employees at Dec 31, 2025.
- How does Vertiv make money, and what is its business model?
- Vertiv's business model is selling equipment such as power systems, cooling units, switchgear and racks, then earning more from service and spare parts over the equipment's life. In FY2025, Vertiv's products brought in $8,207.0 million and services and spares $2,022.9 million.
- Is Vertiv profitable?
- Vertiv's FY2025 net income was $1,332.8 million, up from $495.8 million in FY2024, when a $449.2 million non-cash loss on warrants reduced it. Vertiv's Q3 FY2026 net income was $764.5 million, up from $398.5 million a year earlier.
- What is Vertiv's revenue by segment?
- Vertiv reports three regional segments. In FY2025, Vertiv's net sales were $6,386.3 million in the Americas, $2,019.2 million in Asia Pacific and $1,824.4 million in Europe, Middle East & Africa.
- Who are Vertiv's customers?
- Vertiv sells to hyperscale and cloud companies, colocation data center operators, newer AI cloud providers, large enterprises, telecom networks and industrial sites. Vertiv's FY2025 10-K names Microsoft, AWS, Google Cloud, Equinix and CoreWeave as examples of companies in these markets, not as disclosed customers, and gives no customer list or revenue share for any customer.
- How big is Vertiv?
- Vertiv had FY2025 net sales of $10,229.9 million and net income of $1,332.8 million. Vertiv had about 34,000 employees and about 300 locations in more than 40 countries at the end of 2025.
- Who owns Vertiv?
- Vertiv's 5% holders include Vanguard Capital Management with 7.48% (Schedule 13GA filing by anyone who owns more than 5% of a company's shares and does not seek control. Learn more, Mar 31, 2026) and BlackRock with 6.8% (Schedule 13G/A, Sep 30, 2026). Vertiv's officers and directors as a group held 1.10% on Apr 15, 2026. Vertiv has one class of common stock with one vote per share.
- What products does Vertiv sell?
- Vertiv's products include AC and DC power systems, uninterruptible power supplies, air and liquid cooling, switchgear, busbar, racks, rack power distribution, energy storage and monitoring software. Vertiv's product sales were $8,207.0 million in FY2025, 80.2% of net sales (Cityfort calculation from the FY2025 10-K).
- What is Vertiv's services business?
- Vertiv's services business does maintenance, installation, testing, remote monitoring, fluid management for liquid cooling and spare parts, with about 5,000 service engineers. Vertiv's services and spares sales were $2,022.9 million in FY2025 and $719.0 million in Q3 FY2026, up 41.5% from a year earlier.
- How much debt does Vertiv have?
- Vertiv had total debt of $2,928.5 million on Sep 30, 2026, against cash and short-term investments of $3,711.7 million. Vertiv's debt is rated Baa3 by Moody's and BBB- by S&P and Fitch, as stated in Vertiv's 8-K filed Mar 3, 2026.
Sources (7)
- Form 10-K, fiscal year 2025 (ended Dec 31, 2025)
- Q3 2026 earnings release (8-K Ex. 99.1), quarter ended Sep 30, 2026
- Schedule 13G by Vanguard Capital Management on Vertiv Holdings Co Class A common stock (event date Mar 31, 2026)
- Schedule 13G/A by BlackRock, Inc. on Vertiv Holdings Co Class A common stock (event date Sep 30, 2026)
- 2026 proxy statement (DEF 14A), annual meeting 2026
- Form 10-Q, Q3 fiscal 2026 (quarter ended Sep 30, 2026)
- 8-K filed Mar 3, 2026, Ex. 99.1: completion of $2.1 billion senior unsecured notes and $2.5 billion revolving credit facility (states Moody's, S&P and Fitch ratings)
Terms on this page
- Backlog
- Capital expenditures (capex)
- Debt-to-equity
- Earnings per share (EPS)
- EBITDA
- Free cash flow
- Interest coverage
- Market cap
- Net debt
- Net margin
Each explains the term in plain English, with the same number from other companies on Cityfort.
Go deeper
More detail from the same filings. Open any section.
12What it sells
12What it sells
What does Vertiv sell?
Power equipment
AC and DC power systems, single-phase UPS (backup power that bridges outages), switchgear, busbar, rack power distribution and energy storage.
Cooling (thermal management)
Air-cooled and liquid-cooled systems that remove heat from servers and other IT equipment.
Racks and integrated modules
Racks, cabinets, rack cooling and integrated modular systems. Great Lakes, bought in August 2025, added racks and cabinets.
Services and spare parts
Maintenance, project management, testing, remote monitoring, fluid management and spare parts from about 5,000 service engineers and over 300 service centers. $2,022.9 million in FY2025.
Software
Software for managing IT equipment and the power and cooling systems that support it.
What it does
- Does: Designs, makes, installs and maintains the equipment.
- Does: Sells direct through about 3,000 salespeople and through distributors, resellers and equipment makers.
- Does: Serves telecom networks and industrial sites as well as data centers.
What it does not do
- Does not: Own or run data centers: it supplies the equipment inside them.
- Does not: Make servers or chips. It names NVIDIA as a partner, not a product line.
- Does not: Report revenue by customer or by end market.
13How the money flows
13How the money flows · FY2025
How does money flow through Vertiv?
Money in
- Product sales$8.4B
- Service sales$1.8B
The company
Vertiv
$10.2B came in
Money out
- Cost of sales$6.5B
- Selling, general and administrative$1.6B
- Amortization of acquired intangibles$200M
- Restructuring, currency and other operating costs$67.3M
- Interest and debt repayment costs$87.8M
- Income tax$409M
- Net income$1.3B
- Customers paid Vertiv $10,229.9 million in FY2025: $8,390.6 million for products and $1,839.3 million for services.
- Making and delivering the products and services cost $6,514.7 million.
- Selling and running the company took $1,617.8 million. Amortization, the yearly charge for intangible assets bought in past deals, took $200.4 million.
- Restructuring and other costs of $67.3 million left an operating profit of $1,829.7 million.
- After $87.8 million of interest and debt costs and $409.1 million of tax, $1,332.8 million was net income.
14What it needs to run
14What it needs to run
What does Vertiv need to run?
Factories and materials
Manufacturing needs steel, copper, aluminum and electronic components. About 41% of employees worked in manufacturing at Dec 31, 2025.
A service network
About 5,000 field service engineers and over 300 service centers maintain installed equipment.
Engineering and research
Vertiv spent $441.7 million on engineering, research and development in FY2025.
Working capital for a larger order book
Inventories rose from $1,456.5 million on Dec 31, 2025 to $3,288.4 million on Sep 30, 2026. Customer advances rose faster over the same months.
15Competitors and what protects it
15Competitors and what protects it
Who does Vertiv compete with?
Schneider Electric
Named by Vertiv as a large global competitor with a broad product and service range.
Eaton
Named by Vertiv as a large global competitor that competes directly in its markets.
Legrand
Named by Vertiv as a large global competitor.
Huawei
Named by Vertiv as a large global competitor.
Delta Electronics
Named by Vertiv among specialists with a narrower range, with Stulz, Johnson Controls and Socomec.
What protects the business
Each strength is scored 1 (weak) to 5 (strong) for the business, with the reason. It is not a rating of the share.
- Service network4 of 5
About 5,000 service engineers and over 300 service centers maintain installed equipment. Services and spares were $2,022.9 million of FY2025 net sales.
- Orders already taken4 of 5
Vertiv reported a backlog of $15.0 billion at Dec 31, 2025, up from $7.2 billion a year earlier. It says orders can be canceled or rescheduled.
- Range across power and cooling3 of 5
It sells power, cooling, racks, switchgear and services. Acquisitions added liquid-cooling fluid management (PurgeRite) and microgrid equipment (UtilityInnovation Group).
- Engineering spending3 of 5
Vertiv spent $441.7 million on engineering, research and development in FY2025. Its 10-K says rivals with greater resources may develop better products.
Weak spot
Large customers' bargaining power
Vertiv's FY2025 10-K says large customers make up a material portion of its customer base and have greater purchasing power. It gives no customer shares, so the exposure cannot be sized.
16Where growth could come from
16Where growth could come from
Where could Vertiv's growth come from?
Vertiv said in its Q3 FY2026 earnings release (Oct 28, 2026) that it expects FY2026 net sales of $14,450 million to $14,850 million, and Q4 FY2026 net sales of $4,313 million to $4,513 million. It had given $13,250 million to $13,750 million in February 2026 and raised the range in April, July and October.
Americas
Working$2,988.8M net sales, Q3 FY2026
Up 74.5% from a year earlier, or 66.2% excluding acquisitions and currency, as Vertiv reports it. FY2025 Americas net sales rose 41.9%.
Status: Working, on track against what the company said.
Orders
WorkingOver 100% organic growth, Q3 FY2026
Vertiv said Q3 FY2026 organic orders rose over 100% from a year earlier. Backlog was $15.0 billion at Dec 31, 2025; 2026 releases give no dollar backlog.
Status: Working, on track against what the company said.
Asia Pacific
Working$779.3M net sales, Q3 FY2026
Up 49.9% from a year earlier. Segment profit was $132.4 million, or 17.0% of sales, against 13.2% a year earlier.
Status: Working, on track against what the company said.
Europe, Middle East & Africa
Mixed$544.7M net sales, Q3 FY2026
Up 22.8% from a year earlier, after Q1 FY2026 sales fell 20.3%. FY2025 segment profit fell 14.1%.
Status: Mixed, partly on track.
Services and spares
Working$719.0M, Q3 FY2026
Up 41.5% from a year earlier, or 18.1% excluding acquisitions and currency, as Vertiv reports it.
Status: Working, on track against what the company said.
Acquisitions
New$1.45B cash for UtilityInnovation Group
Closed Oct 26, 2026, with up to $1.15 billion more if earnings targets are met over 12 and 24 months. PurgeRite (about $1.0 billion) closed Dec 4, 2025.
Status: New, recently announced.
Status compares progress with what the company itself said it would do: Working = on track against what the company said; Mixed = partly on track; Behind = behind the company's own plan; New = recently announced; Early = too early to judge.
Sources (8)
- Q3 2026 earnings release (8-K Ex. 99.1), quarter ended Sep 30, 2026
- Q4 and full-year 2025 earnings release (8-K Ex. 99.1), quarter ended Dec 31, 2025
- Q1 2026 earnings release (8-K Ex. 99.1), quarter ended Mar 31, 2026
- Q2 2026 earnings release (8-K Ex. 99.1), quarter ended Jun 30, 2026
- Form 10-K, fiscal year 2025 (ended Dec 31, 2025)
- Form 10-Q, Q3 fiscal 2026 (quarter ended Sep 30, 2026)
- 8-K filed Oct 27, 2026, Ex. 99.1: Vertiv completes acquisition of UtilityInnovation Group
- 8-K filed Dec 5, 2025, Ex. 99.1: Vertiv completes acquisition of PurgeRite
17The company's own measures (non-GAAP)
17The company's own measures · FY2025 and Q3 FY2026, unless the row says otherwise
What do Vertiv's own measures show?
Official (GAAP): Operating profit, FY2025
$1.8B
Company's own measure: Adjusted operating profit, FY2025
$2.1B
Vertiv adds back amortization of acquired intangibles, restructuring, contingent payments for acquisitions and deal costs.
Official (GAAP): Diluted EPS, FY2025
$3.41
Company's own measure: Adjusted diluted EPS, FY2025
$4.20
Also leaves out one-time tax items and debt refinancing costs.
Official (GAAP): Operating profit, Q3 FY2026
$984M
Company's own measure: Adjusted operating profit, Q3 FY2026
$1.1B
Same definition. Q3 FY2026 operating profit included $33.5 million of PurgeRite contingent payment expense, which the adjusted figure leaves out.
Official (GAAP): Diluted EPS, Q3 FY2026
$1.95
Company's own measure: Adjusted diluted EPS, Q3 FY2026
$2.21
Same definition as the full year.
Official (GAAP): Operating cash flow, FY2025
$2.1B
Company's own measure: Adjusted free cash flow, FY2025
$1.9B
Vertiv's measure: operating cash flow minus capital spending and capitalized software. The free cash flowCash from operations minus spending on buildings and equipment. Learn more in "The numbers" deducts capital spending only ($1,893.8 million).
Official (GAAP): Net sales growth, Q3 FY2026
61.2%
Company's own measure: Organic net sales growth, Q3 FY2026
55.0%
Organic growth leaves out acquisitions and currency changes. The GAAP growth is as reported in the Q3 FY2026 earnings release.
Official (GAAP): Deferred revenue (customer advances), Dec 31, 2025
$1.8B
Company's own measure: Backlog, Dec 31, 2025
$15.0B
Orders received but not yet filled, as Vertiv reports them; it was $7.2 billion a year earlier. Most are firm and expected to ship within 12 to 18 months, but orders can be canceled or rescheduled. Deferred revenue is customer payments received ahead of delivery, not a backlog measure. 2026 releases give order growth rates only, with no dollar backlog.
These are the company's own measures, defined by the company. They are not comparable across companies, and they are not added together. Each sits beside the nearest official (GAAP) figure.
Learn: Non-GAAP measures: what a company's "adjusted" numbers leave out
18Financial strength and debt
18Financial strength · Sep 30, 2026
How much debt does Vertiv have?
- Total debt$2.9B
- Cash and investments$3.7B
- Net cash (cash minus debt)$783M
- Net worth (shareholders' money)$5.5B
- Debt to equity
- 0.53×
- $ of debt for every $1 of shareholders' money
- Interest cover
- 21.3×
- how many times operating profit covers interest
- Net debt was $1,085.1 million at Dec 31, 2025 (Cityfort calculation from the FY2025 10-K). Vertiv's Q2 FY2026 release says it reached a net cash position by the end of that quarter.
- Debt on Sep 30, 2026: $850.0 million of 4.125% secured notes due 2028, plus $2.1 billion of unsecured notes due 2036 to 2066 issued in March 2026. $2,484.0 million was available under a $2.5 billion revolving credit line.
- Customer advances (deferred revenue) rose from $1,814.7 million on Dec 31, 2025 to $4,120.5 million on Sep 30, 2026. Over the same months inventories rose from $1,456.5 million to $3,288.4 million.
- Interest cover of 21.3 is FY2025 operating profit of $1,829.7 million divided by net interest of $86.1 million (Cityfort calculation from the FY2025 10-K). Debt to equity of 0.53 uses equity of $5,502.0 million.
- Contingent payments for acquisitions are not debt: the PurgeRite earnout liability was $239.6 million on Sep 30, 2026, and UtilityInnovation Group can earn up to $1.15 billion more.
Sources (5)
- Form 10-Q, Q3 fiscal 2026 (quarter ended Sep 30, 2026)
- Q3 2026 earnings release (8-K Ex. 99.1), quarter ended Sep 30, 2026
- Form 10-K, fiscal year 2025 (ended Dec 31, 2025)
- Q2 2026 earnings release (8-K Ex. 99.1), quarter ended Jun 30, 2026
- 8-K filed Oct 27, 2026, Ex. 99.1: Vertiv completes acquisition of UtilityInnovation Group
19Who owns it
19Who owns it · ownership as of Apr 15, 2026
Who owns Vertiv?
- Officers and directors (as a group), shares
- 1.1%
Share classes
Holders of 5% or more
From the company's proxy statement (DEF 14A), later Schedule 13G filings and the share counts on its latest annual or quarterly report. Each holder row shows the date of its own filing.
Insider trades · Form 4 data as of Nov 6, 2026
What did Vertiv's insiders report trading?
Vertiv's insiders made 91 Form 4A filing an insider must make within two business days of buying or selling the company's shares. Learn more filings in the 12 months to Nov 6, 2026.
They reported no purchases and 73 sales (510,549 shares) in the open market or privately (codes P and S).
20 of the 73 sales were on forms with the Rule 10b5-1 plan box checked.
The same filings report 75 other share transactions (A: 52, M: 9, F: 7, G: 7).
They also report 30 transactions in options, stock units or other derivatives.
Insiders are a company's officers, directors and owners of more than 10% of a class of its shares. Most changes in their holdings must be reported to the SEC on a Form 4 within two business days. Source: SEC Form 4 filings on EDGAR.
- P
- a purchase in the open market or privately
- S
- a sale in the open market or privately
- A
- a grant, award or other acquisition from the company under Rule 16b-3
- F
- shares withheld or handed over to pay an exercise price or tax when an award is received, exercised or vests
- M
- exercise or conversion of an option or other derivative, exempt under Rule 16b-3
- G
- a bona fide gift
Code meanings: General Instruction 8 of Form 4 (SEC).
The latest 25 of 148 transactions
Shares: A = acquired, D = disposed of. A price the filing gives only in a footnote shows as “See filing”. The 10b5-1 box is checked when at least one trade on the form was made under a Rule 10b5-1 plan. A Form 4/A replaces the form it amends. See all of Vertiv's Form 4 filings on EDGAR.
Learn: How to read a proxy statement (DEF 14A): Nvidia's 2026 proxy · Form 4 insider filings: who files, the codes and the footnotes · Rule 10b5-1 trading plans: how insiders pre-schedule their trades
Sources (6)
- Form 10-Q, Q3 fiscal 2026 (quarter ended Sep 30, 2026)
- Form 10-K, fiscal year 2025 (ended Dec 31, 2025)
- Schedule 13G by Vanguard Capital Management on Vertiv Holdings Co Class A common stock (event date Mar 31, 2026)
- Schedule 13G/A by The Vanguard Group (0% after its Jan 12, 2026 internal realignment; event date Mar 13, 2026)
- Schedule 13G/A by BlackRock, Inc. on Vertiv Holdings Co Class A common stock (event date Sep 30, 2026)
- 2026 proxy statement (DEF 14A), annual meeting 2026
20What it does with profit
20What it does with profit
What does Vertiv do with its profit?
Buyback · Mar 31, 2024
9,076,444 shares bought back in Q1 2024 under a $3.0 billion authorization approved Nov 29, 2023. None were bought since, and $2.4 billion remained at Dec 31, 2025.
$600M
21Governance signals
21Governance signals
What do Vertiv's governance filings show?
- Auditor
- Ernst & Young LLP, since 2016
- Auditor changes
- None in the period covered
- Audit qualifications
- None reported
- Related-party dealings
- The 2026 proxy statement describes its approval policy for related-person transactions and lists only indemnification agreements with officers and directors as other related-party arrangements. EY's total fees were $9,574,006 for FY2025.
- Credit rating
- Moody's / S&P / Fitch (as stated in Vertiv's 8-K filed Mar 3, 2026) Baa3 (Moody's, upgraded Feb 19, 2026) / BBB- (S&P, upgraded Feb 12, 2026) / BBB- (Fitch, date not stated) (Not stated in the filing), Mar 3, 2026
A credit rating describes the company's ability to repay debt. It is not a rating of the share.
Flags to know about
other · May 3, 2022
Securities class action and derivative suits
A putative class action filed May 3, 2022 alleges that Vertiv's public statements on inflation, supply chain pressures and pricing were materially false or misleading. Derivative suits filed in 2023 and 2024 make similar allegations. Vertiv says the outcome cannot be predicted; they were pending in its Q3 FY2026 10-Q.
regulatory · Dec 30, 2025
SEC investigation closed
Vertiv received an SEC subpoena in November 2023 relating to the lawsuit's allegations. On Dec 30, 2025, the SEC's Division of Enforcement said it had concluded its investigation as to the company and did not intend to recommend any enforcement action against the company at this time.
regulatory · Mar 31, 2024
Mexico customs payment
A Mexican subsidiary paid about $10.1 million in Q1 2024 after a contested customs audit covering April 2016 to February 2018. Vertiv says it will seek reimbursement.
disclosure
Warrant revaluations in FY2021 to FY2024
Non-cash warrant revaluations changed net income: losses of $61.9 million (FY2021), $157.9 million (FY2023) and $449.2 million (FY2024), and a $90.9 million gain (FY2022). FY2022 diluted EPS was minus $0.04 although net income was $76.6 million, because the diluted figure removes that gain. No warrants remain after December 2024.
disclosure
Q3 FY2025 cash flow figures changed
The Q3 FY2026 release shows Q3 FY2025 operating cash flow of $482.7 million; the original Q3 FY2025 release showed $508.7 million. About $26.0 million of outflows moved from investing to operating cash flow; the Q3 FY2025 investing outflow went from $709.9 million to $683.9 million. The filings read for this page give no reason; the FY2025 10-K total uses the revised figure.
disclosure
What the filings do not break out
The filings used here give no revenue by customer or end market, no data center revenue figure and no dollar backlog after Dec 31, 2025.
other
Past material weaknesses
Vertiv's FY2025 10-K says internal control over financial reporting was effective at Dec 31, 2025, and notes that the company has had material weaknesses in the past.
Sources (7)
- Form 10-K, fiscal year 2025 (ended Dec 31, 2025)
- 2026 proxy statement (DEF 14A), annual meeting 2026
- 8-K filed Mar 3, 2026, Ex. 99.1: completion of $2.1 billion senior unsecured notes and $2.5 billion revolving credit facility (states Moody's, S&P and Fitch ratings)
- Form 10-Q, Q3 fiscal 2026 (quarter ended Sep 30, 2026)
- Form 10-K, fiscal year 2023 (ended Dec 31, 2023)
- Q3 2026 earnings release (8-K Ex. 99.1), quarter ended Sep 30, 2026
- Q3 2025 earnings release (8-K Ex. 99.1), quarter ended Sep 30, 2025
22What the market paid
22What the market paid · price as of Nov 5, 2026
What did the market pay for Vertiv on Nov 5, 2026?
Price as of Nov 5, 2026 (shown for education; prices change daily).
Price as of Nov 5, 2026: a $176.73 close, from Nasdaq's historical price table for VRT; Vertiv's shares are listed on the NYSE. Other closes in that table were $242.94 on Oct 28, 2026, the day Q3 results came out, $235.97 on Nov 3 and $205.55 on Nov 4. Market value = $176.73 × 385,060,421 shares (10-Q cover, Oct 26, 2026) = $68,052 million (Cityfort calculation from the Nov 5, 2026 closing price and the Q3 FY2026 10-Q). P/E is price ÷ earnings per share: 33.0 on the last four quarters' diluted EPS of $5.35 (Cityfort calculation from the Nov 5, 2026 closing price and the Q4 FY2025 to Q3 FY2026 earnings releases), or 51.8 on FY2025 diluted EPS of $3.41. Dividend yield was 0.14% on $0.25, the $0.0625 quarterly rate declared Nov 14, 2025 × 4 (Cityfort calculation from the Nov 5, 2026 closing price and the FY2025 10-K).
- Share price
- $176.73
- Market value (market cap)
- $68.1B
- P/E
- 33×
More price-based ratios · as of Nov 5, 2026
Each ratio divides a number from the company's filings by the market value or share price on Nov 5, 2026. Prices change daily, so these ratios do too.
Price to sales (P/S)
5.2×
$68.1B market value ÷ $13.1B revenue (four quarters to Sep 30, 2026) = 5.2×
Cityfort calculation from the Nov 5, 2026 closing price and the Q4 FY2025 to Q3 FY2026 earnings releases. Source: VRT historical quotes, Oct 27 to Nov 5, 2026 (close Nov 5, 2026: $176.73); Form 10-Q, Q3 fiscal 2026 (quarter ended Sep 30, 2026); Q4 and full-year 2025 earnings release (8-K Ex. 99.1), quarter ended Dec 31, 2025 and 4 more
How price ratios workFree cash flow yield
2.8%
$1.9B free cash flow (FY2025) ÷ $68.1B market value = 2.8%
Cityfort calculation from the FY2025 10-K and the Nov 5, 2026 closing price. Source: VRT historical quotes, Oct 27 to Nov 5, 2026 (close Nov 5, 2026: $176.73); Form 10-Q, Q3 fiscal 2026 (quarter ended Sep 30, 2026); Q4 and full-year 2025 earnings release (8-K Ex. 99.1), quarter ended Dec 31, 2025 and 4 more
What free cash flow means
Shares used for the market value: 385.06 million ($176.73 × 385.06 million shares ≈ $68.1B). Source: Form 10-Q, Q3 fiscal 2026 (quarter ended Sep 30, 2026); Form 10-K, fiscal year 2025 (ended Dec 31, 2025)
Source: VRT historical quotes, Oct 27 to Nov 5, 2026 (close Nov 5, 2026: $176.73); Form 10-Q, Q3 fiscal 2026 (quarter ended Sep 30, 2026); Q4 and full-year 2025 earnings release (8-K Ex. 99.1), quarter ended Dec 31, 2025 and 4 more
Sources (7)
- VRT historical quotes, Oct 27 to Nov 5, 2026 (close Nov 5, 2026: $176.73)
- Form 10-Q, Q3 fiscal 2026 (quarter ended Sep 30, 2026)
- Q4 and full-year 2025 earnings release (8-K Ex. 99.1), quarter ended Dec 31, 2025
- Q1 2026 earnings release (8-K Ex. 99.1), quarter ended Mar 31, 2026
- Q2 2026 earnings release (8-K Ex. 99.1), quarter ended Jun 30, 2026
- Q3 2026 earnings release (8-K Ex. 99.1), quarter ended Sep 30, 2026
- Form 10-K, fiscal year 2025 (ended Dec 31, 2025)
23How it got here
23How it got here
How did Vertiv get here?
1965
Milestone
Liebert Corp. founded
Liebert Corp., the first maker of computer-room air conditioning, was set up in 1965 from a business Ralph Liebert started in 1946.
1987
Business-model change
Part of Emerson Electric
Emerson Electric bought Liebert in 1987 and in 2000 formed its Network Power business, bringing Liebert and other units under one brand.
2020
Business-model change
Listed through a SPAC
On Feb 7, 2020, Vertiv listed on the NYSE by combining with GS Acquisition Holdings Corp, a listed shell company formed to buy a business.
2021
Milestone
E&I Engineering bought
On Nov 1, 2021, Vertiv bought E&I Engineering, a switchgear and busway maker, for $1,770.4 million net, in cash and stock.
2022
Crisis
Costs outran prices
FY2022 operating margin fell to 3.9% and operating cash flow was minus $152.8 million. A shareholder class action over inflation and pricing statements was filed that May.
2024
Milestone
Buyback and the last warrants
Vertiv bought back $599.9 million of shares in Q1 2024. The last private warrants were exercised on Dec 6, 2024.
2025
Business-model change
PurgeRite: liquid cooling services
On Dec 4, 2025, Vertiv bought PurgeRite, which handles the fluids in liquid-cooling systems, for about $1.0 billion plus up to $250 million of earnout.
2026
Milestone
Investment-grade ratings and new notes
S&P and Moody's upgraded Vertiv in February 2026. In March it issued $2.1 billion of unsecured notes and repaid its term loan; the company said it joined the S&P 500 that month.
2026
Business-model change
UtilityInnovation Group bought
On Oct 26, 2026, Vertiv closed its purchase of UtilityInnovation Group, which makes microgrid controls, switchgear and energy storage, for $1.45 billion in cash.
Sources (9)
- Form 10-K, fiscal year 2025 (ended Dec 31, 2025)
- EDGAR filing list for Vertiv Holdings Co (CIK 0001674101): forms, dates, former name GS Acquisition Holdings Corp
- Form 10-K, fiscal year 2023 (ended Dec 31, 2023)
- 8-K filed Dec 5, 2025, Ex. 99.1: Vertiv completes acquisition of PurgeRite
- Form 10-Q, Q3 fiscal 2026 (quarter ended Sep 30, 2026)
- 8-K filed Mar 3, 2026, Ex. 99.1: completion of $2.1 billion senior unsecured notes and $2.5 billion revolving credit facility (states Moody's, S&P and Fitch ratings)
- Q1 2026 earnings release (8-K Ex. 99.1), quarter ended Mar 31, 2026
- 8-K filed Sep 2, 2026, Ex. 99.1: agreement to acquire UtilityInnovation Group
- 8-K filed Oct 27, 2026, Ex. 99.1: Vertiv completes acquisition of UtilityInnovation Group
24Sources and changes
Where every number on this page comes from
Sources (23 documents)
- S1Form 10-K, fiscal year 2025 (ended Dec 31, 2025) · Vertiv Holdings Co (SEC EDGAR) · Tier 1: company or exchange filing · Feb 13, 2026
- S2Form 10-K, fiscal year 2023 (ended Dec 31, 2023) · Vertiv Holdings Co (SEC EDGAR) · Tier 1: company or exchange filing · Feb 23, 2024
- S4Form 10-Q, Q3 fiscal 2026 (quarter ended Sep 30, 2026) · Vertiv Holdings Co (SEC EDGAR) · Tier 1: company or exchange filing · Oct 28, 2026
- S5Q3 2026 earnings release (8-K Ex. 99.1), quarter ended Sep 30, 2026 · Vertiv Holdings Co (SEC EDGAR) · Tier 1: company or exchange filing · Oct 28, 2026
- S6Q2 2026 earnings release (8-K Ex. 99.1), quarter ended Jun 30, 2026 · Vertiv Holdings Co (SEC EDGAR) · Tier 1: company or exchange filing · Jul 29, 2026
- S7Q1 2026 earnings release (8-K Ex. 99.1), quarter ended Mar 31, 2026 · Vertiv Holdings Co (SEC EDGAR) · Tier 1: company or exchange filing · Apr 22, 2026
- S8Q4 and full-year 2025 earnings release (8-K Ex. 99.1), quarter ended Dec 31, 2025 · Vertiv Holdings Co (SEC EDGAR) · Tier 1: company or exchange filing · Feb 11, 2026
- S9Q3 2025 earnings release (8-K Ex. 99.1), quarter ended Sep 30, 2025 · Vertiv Holdings Co (SEC EDGAR) · Tier 1: company or exchange filing · Oct 22, 2025
- S10Q2 2025 earnings release (8-K Ex. 99.1), quarter ended Jun 30, 2025 · Vertiv Holdings Co (SEC EDGAR) · Tier 1: company or exchange filing · Jul 30, 2025
- S11Q1 2025 earnings release (8-K Ex. 99.1), quarter ended Mar 31, 2025 · Vertiv Holdings Co (SEC EDGAR) · Tier 1: company or exchange filing · Apr 23, 2025
- S12Q4 and full-year 2024 earnings release (8-K Ex. 99.1), quarter ended Dec 31, 2024 · Vertiv Holdings Co (SEC EDGAR) · Tier 1: company or exchange filing · Feb 12, 2025
- S13Q3 2024 earnings release (8-K Ex. 99.1), quarter ended Sep 30, 2024 · Vertiv Holdings Co (SEC EDGAR) · Tier 1: company or exchange filing · Oct 23, 2024
- S142026 proxy statement (DEF 14A), annual meeting 2026 · Vertiv Holdings Co (SEC EDGAR) · Tier 1: company or exchange filing · Apr 24, 2026
- S158-K filed Mar 3, 2026, Ex. 99.1: completion of $2.1 billion senior unsecured notes and $2.5 billion revolving credit facility (states Moody's, S&P and Fitch ratings) · Vertiv Holdings Co (SEC EDGAR) · Tier 1: company or exchange filing · Mar 3, 2026
- S168-K filed Dec 5, 2025, Ex. 99.1: Vertiv completes acquisition of PurgeRite · Vertiv Holdings Co (SEC EDGAR) · Tier 1: company or exchange filing · Dec 5, 2025
- S178-K filed Sep 2, 2026, Ex. 99.1: agreement to acquire UtilityInnovation Group · Vertiv Holdings Co (SEC EDGAR) · Tier 1: company or exchange filing · Sep 2, 2026
- S188-K filed Oct 27, 2026, Ex. 99.1: Vertiv completes acquisition of UtilityInnovation Group · Vertiv Holdings Co (SEC EDGAR) · Tier 1: company or exchange filing · Oct 27, 2026
- S208-K filed Oct 14, 2025, Item 5.02: Craig Chamberlin appointed CFO effective Nov 10, 2025; David Fallon retires Nov 9, 2025 · Vertiv Holdings Co (SEC EDGAR) · Tier 1: company or exchange filing · Oct 14, 2025
- S21Schedule 13G/A by BlackRock, Inc. on Vertiv Holdings Co Class A common stock (event date Sep 30, 2026) · BlackRock, Inc. (SEC EDGAR) · Tier 1: company or exchange filing · Oct 27, 2026
- S22Schedule 13G by Vanguard Capital Management on Vertiv Holdings Co Class A common stock (event date Mar 31, 2026) · Vanguard Capital Management (SEC EDGAR) · Tier 1: company or exchange filing · Apr 30, 2026
- S23Schedule 13G/A by The Vanguard Group (0% after its Jan 12, 2026 internal realignment; event date Mar 13, 2026) · The Vanguard Group (SEC EDGAR) · Tier 1: company or exchange filing · Mar 27, 2026
- S24VRT historical quotes, Oct 27 to Nov 5, 2026 (close Nov 5, 2026: $176.73) · Nasdaq, Inc. · Tier 1: company or exchange filing · Nov 5, 2026
- S25EDGAR filing list for Vertiv Holdings Co (CIK 0001674101): forms, dates, former name GS Acquisition Holdings Corp · U.S. SEC (EDGAR) · Tier 1: company or exchange filing · Nov 6, 2026
Changes to this page (v1 · Nov 6, 2026)
- v1 · Nov 6, 2026First version, through Q3 FY2026 (quarter ended Sep 30, 2026) and the FY2025 10-K. (first version)
Numbers come only from tier 1 and tier 2 sources. Read how we research.
Disclaimer
For learning only. Cityfort is not a registered investment adviser or broker-dealer and does not recommend buying or selling any security. Prices shown are dated and may be out of date.
Investing in securities involves risk, including loss of capital. Before making any investment decision, do your own research and consider consulting a registered investment adviser or other qualified professional.
Cityfort, its owners and contributors may or may not hold securities of companies covered. Cityfort is not paid by any company it covers. Content is not an offer or solicitation to buy or sell any security, including in any initial public offering.
Read the positions policyRead the full disclaimerHide the full disclaimer
Cityfort publishes general educational content that explains how listed companies work. Cityfort is not registered with the US Securities and Exchange Commission or any state securities regulator as an investment adviser, and is not a broker-dealer or a member of FINRA. Cityfort does not provide investment, tax or legal advice, recommendations, ratings, price targets or any opinion on whether to buy, sell or hold any security. Nothing on the site is tailored to any person's circumstances.
All information is taken from publicly available sources, mainly company filings with the SEC, which are listed on each page with dates. We work to keep it accurate and correct errors publicly, but we do not guarantee that it is complete, accurate or up to date. Any market price or price-based ratio shown is dated, may be out of date by the time you read it, and is included only to explain concepts.
Statements by company management, including forward-looking statements and guidance, are reported as the company's statements, with their date and source; they are not our forecasts. Adjusted (non-GAAP) figures are the company's own measures and are shown next to the official (GAAP) figures.