Industrials · NASDAQ: AAL
American Airlines: how the business works
American Airlines Group sells airline seats and AAdvantage miles from nine US hubs, with FY2025 revenue of $54.6 billion.
By Hardik Bhandare · Checked against filings: . Editorial policy. Corrections
Follow American Airlines
Email me when American Airlines's page is updated after earnings.
We'll send a confirmation email first. See our privacy policy.
American Airlines Group Inc. · Fort Worth, Texas
Updated for Q3 FY2026 · checked
- Revenue, FY2025
- $54.6B
- Net income, FY2025
- $111M
- Passengers boarded in 2025
- About 224M
- Aircraft, Dec 31, 2025
- 1,580
- Full-time equivalent employees, Dec 31, 2025
- About 139,100
The short version
American Airlines in 5 points
1 · What it sells
American Airlines Group sells airline seats on 1,580 aircraft, plus AAdvantage miles and cargo space, with FY2025 revenue of $54.6 billion.
2 · Who pays it
In FY2025, ticket sales were 83.5% of revenue, miles redeemed for travel 7.4%, loyalty marketing services 6.4%, cargo 1.5% and other revenue 1.2%, and no customer is named as a concentration.
3 · What it keeps from $100
Of every $100 that came in during FY2025, American kept $0.2 as net income after $3.1 of interest expense, while operating income was $2.7 per $100 of revenue.
4 · Where the operating profit comes from
American reports one operating segment and no profit for AAdvantage or any region, and its operating income per $100 of revenue fell from $5.7 in FY2023 to $2.7 in FY2025.
5 · The one thing to watch
American's fuel cost was $4,635 million in Q3 FY2026, up from $2,767 million a year earlier, and its operating income was $115 million, down from $151 million.
Sources: From American Airlines Group's FY2025 10-K and its Q3 FY2026 and Q3 FY2025 earnings releases · checked
See the full receipt and the management scorecard below
01Where the money goes · FY2025
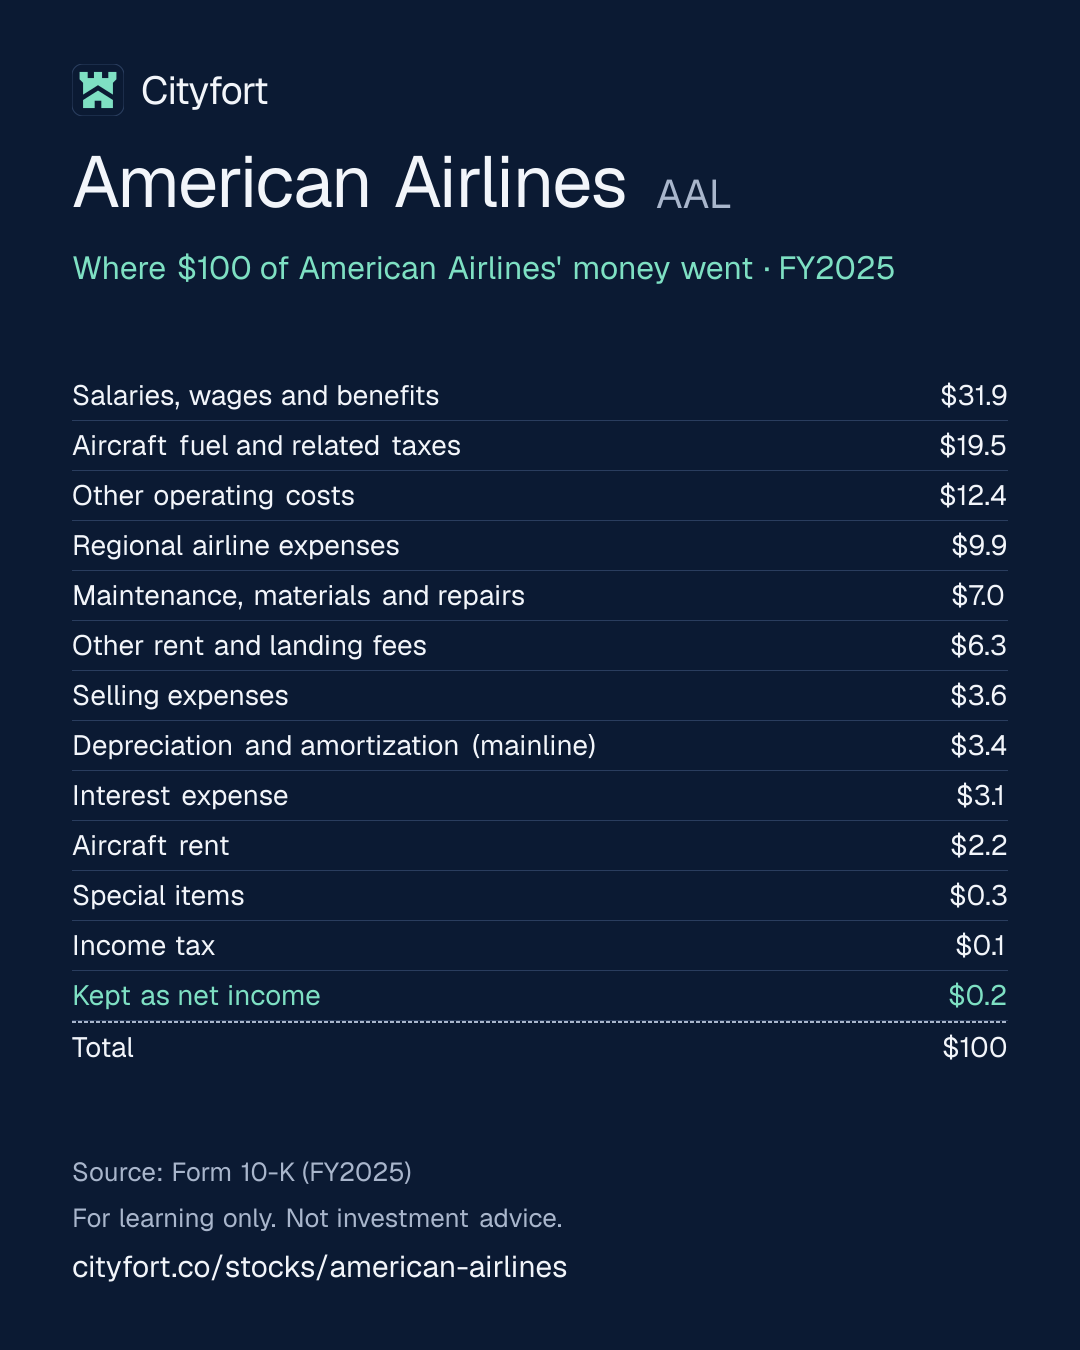
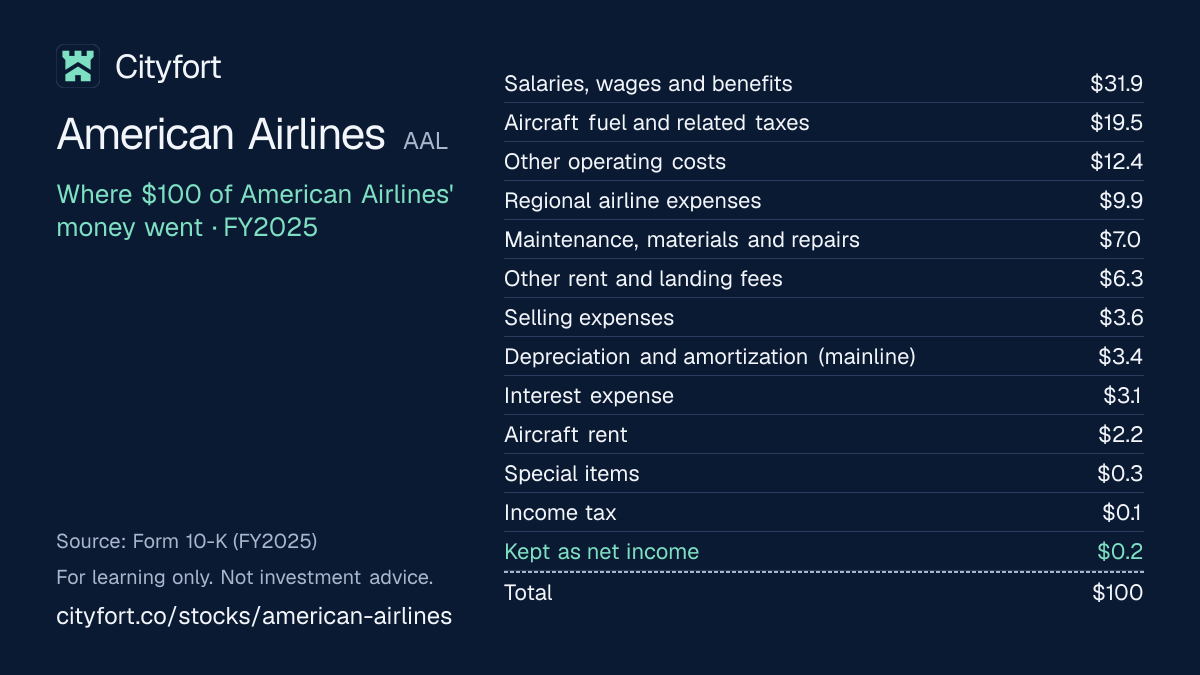
Where does $100 of American Airlines' money go?
American Airlines · FY2025
Receipt for every $100
| Salaries, wages and benefits | $31.9 |
|---|---|
| Aircraft fuel and related taxes | $19.5 |
| Other operating costs | $12.4 |
| Regional airline expenses | $9.9 |
| Maintenance, materials and repairs | $7.0 |
| Other rent and landing fees | $6.3 |
| Selling expenses | $3.6 |
| Depreciation and amortization (mainline) | $3.4 |
| Interest expense | $3.1 |
| Aircraft rent | $2.2 |
| Special items | $0.3 |
| Income tax | $0.1 |
| Kept as net income | $0.2 |
| Total | $100 |
Each line = amount ÷ total money in × 100. Lines may not add to exactly $100 because of rounding.
How this is worked out
Cityfort calculation from the FY2025 10-K. Of every $100 that came in during FY2025: each line = line ÷ $55,072 million × 100 (revenue $54,633 million + interest income $357 million + other income $82 million). Rounded lines add to $99.9. Per $100 of revenue alone, operating income was $2.7 and net income $0.2.
Save this receipt as an image:
1080 × 1350 PNG for Instagram, LinkedIn1200 × 675 PNG for X
Embed this receipt
Paste this code into a blog or website to show the receipt, with a link back to this page:
Each week: one company explained in 5 points, picked by earnings date.
Free, no tips, unsubscribe anytime.
We'll send a confirmation email. See our privacy policy.
02The business in one line
What does American Airlines do?
Travelers pay American for seats and Citi and other partners pay it for AAdvantage miles; most of the money goes on staff and fuel, and $0.2 of every $100 that came in during FY2025 was left as net income.
- Ticket sales were 83.5% of FY2025 revenue, and the two loyalty lines together were 13.8% (Cityfort calculation from the FY2025 10-K).
- Net interest expense of $1,716 million in FY2025 was larger than operating income of $1,467 million. Interest and other income of $439 million left pre-tax income of $190 million.
03Who pays it
Who pays American Airlines?
Travelers buying tickets
84%
of revenue
83.5% of FY2025 revenue, or $45,607 million of passenger travel.
AAdvantage members redeeming miles
7%
of revenue
7.4% of FY2025 revenue, or $4,036 million. Members earn miles by flying and by spending with partners.
Citi and other loyalty partners
6%
of revenue
6.4% of FY2025 revenue, or $3,511 million of loyalty marketing services. Citi is the most significant mileage partner.
Cargo shippers
2%
of revenue
1.5% of FY2025 revenue, or $839 million.
Other
1%
of revenue
1.2% of FY2025 revenue, or $640 million.
- Travelers buying tickets84%
- AAdvantage members redeeming miles7%
- Citi and other loyalty partners6%
- Cargo shippers2%
- Other1%
How spread out the customers are
These shares are by type of revenue, a Cityfort calculation from the FY2025 10-K; American names no customer as a concentration. Co-brand card and other partners paid American $6.2 billion in cash in 2025. That cash is not a revenue line: it feeds several lines over time.
04Why it makes money
Why does American Airlines make money?
American's profit is the thin gap between what each seat mile earns and what it costs.
A seat mile is one seat flown one mile. In FY2025, American earned 18.25 cents per seat mile and spent 17.76 cents. In Q3 FY2026 it earned 20.25 cents and spent 20.10 cents, as fuel rose to $3.85 a gallon.
Operating income per $100 of revenue
$5.7$2.7
FY2023 to FY2025
- Fly about 224 million passengers a year through nine US hubs
- Sell main cabin, premium and corporate tickets
- Sell AAdvantage miles to Citi and other partners
- Pay staff, fuel, regional airlines and airports
- Pay interest on $29.6 billion of debt and finance leases
- Spend what remains on new aircraft and debt repayment
↺ Step 6 feeds back into step 1.
05Business segments · FY2025
Which businesses make up American Airlines?
American Airlines (one reported segment)
100%American reports one operating segment, and its CEO reviews consolidated figures, so no region or loyalty business shows its own profit. Revenue by type and by region is in the sections on who pays and where it sells.
Revenue $54.6B · Operating profit $1.5B
How the mix changed
- American Airlines (one reported segment)
Revenue by segment, FY2021 to FY2025.
US$
See the numbers
06The numbers · Consolidated · US$
How has American Airlines done?
Revenue
$54.6BFY2025
Revenue rose from $29.9 billion in FY2021 to $54.6 billion in FY2025, and Q3 FY2026 revenue was $16,335 million, up 19.3% from a year earlier.
US$
See the numbers
Net profit
$111MFY2025
Net income was $111 million in FY2025, down from $846 million in FY2024, and the FY2021 loss of $1,993 million included $4,455 million of net special credits, mainly government payroll support.
US$
See the numbers
Profit kept per $100 of revenue
$0.2FY2025
Operating income per $100 of revenue fell from $5.7 in FY2023 to $2.7 in FY2025, and stock-based pay of $57 million in FY2025 was about half of that year's $111 million net income.
$ of profit per $100 of revenue (net margin)
See the numbers
Free cash flow
−$680MFY2025
Free cash flow was negative $680 million in FY2025, from $3,099 million of operating cash flow minus $3,779 million of capital spending (Cityfort calculation from the FY2025 10-K).
US$ · cash from operations minus spending on plants and equipment
See the numbers
See all yearly numbers
EBITDA here = operating income plus depreciation and amortization (from the cash flow statement). Fiscal years are the company's own (Fiscal year ends Dec 31). Net profit is the share belonging to the company's owners.
Download American Airlines's yearly and quarterly numbers (CSV, with source ids)
Learn: Fiscal years that don't end in December: Nvidia's FY2027 explained · Stock-based compensation and dilution: pay that becomes shares
Sources (11)
- Form 10-K, fiscal year 2022 (ended Dec 31, 2022)
- Form 10-K, fiscal year 2023 (ended Dec 31, 2023)
- Form 10-K, fiscal year 2025 (ended Dec 31, 2025)
- Earnings release, Q3 FY2025 (Form 8-K Exhibit 99.1, Oct 23, 2025)
- Earnings release, Q4 and full year FY2024 (Form 8-K Exhibit 99.1, Jan 23, 2025)
- Earnings release, Q1 FY2025 (Form 8-K Exhibit 99.1, Apr 24, 2025)
- Earnings release, Q2 FY2025 (Form 8-K Exhibit 99.1, Jul 24, 2025)
- Earnings release, Q4 and full year FY2025 (Form 8-K Exhibit 99.1, Jan 27, 2026)
- Earnings release, Q1 FY2026 (Form 8-K Exhibit 99.1, Apr 23, 2026)
- Earnings release, Q2 FY2026 (Form 8-K Exhibit 99.1, Jul 23, 2026)
- Earnings release, Q3 FY2026 (Form 8-K Exhibit 99.1, Oct 22, 2026)
07Who runs it
Who runs American Airlines, and did they deliver?
Robert D. Isom
Chief Executive Officer, President and director
His 2025 total pay was $13,871,825, against a median employee's $89,429: a ratio of 155.1 to 1, as the proxy states. He chose not to receive a 2025 short-term incentive award.
Devon E. May
Chief Financial Officer
Named as CFO in the 2026 proxy statementThe yearly filing about shareholder votes, the board and executive pay. Learn more.
Gregory D. Smith
Independent Chairman
All directors other than Isom are independent under Nasdaq rules, by the 2026 proxy.
Stephen L. Johnson
Vice Chair and Chief Strategy Officer
To retire at the end of 2026, by an 8-K filed Jun 16, 2026.
Mary N. Dillon and John W. Dietrich
Directors elected in 2026 · since 2026
Dillon joined the board on Mar 24, 2026 and Dietrich on Jul 15, 2026.
What they said, and what happened
2 too early to tell · 3 delivered · 2 withdrawn · 1 missed
Said on Oct 22, 2026
American's Oct 22, 2026 release said it expects nearly $1 billion of annual run-rate savings and more than $900 million of working capital improvements by the end of 2026.
Too early to tellWhat happened
Due by the end of 2026.
Said on Jul 23, 2026
American's Jul 23, 2026 release guided Q3 FY2026 adjusted EPS to a loss of $0.70 to $0.10, with fuel at about $3.75 a gallon.
DeliveredWhat happened
Adjusted EPS was a loss of $0.28, with fuel at $3.85 a gallon. GAAP diluted EPS was a loss of $0.41.
Said on Apr 23, 2026
American's Apr 23, 2026 release guided Q2 FY2026 adjusted EPS to a loss of $0.20 to a profit of $0.20, with fuel at about $4.00 a gallon.
DeliveredWhat happened
Adjusted EPS was $0.15, with fuel at $4.05 a gallon. GAAP diluted EPS was $0.11.
Said on Mar 17, 2026
American's Mar 17, 2026 8-K said it expected Q1 FY2026 revenue to be up over 10%, with fuel at about $2.75 a gallon.
DeliveredWhat happened
Revenue was $13,912 million, up 10.8% from $12,551 million, as stated in the Q1 FY2026 earnings release; fuel was $2.75 a gallon.
Said on Jan 27, 2026
American's Jan 27, 2026 release aimed for total debt below $35 billion in 2026, on its own measure including operating leases and pension.
Too early to tellWhat happened
Total debt was $34,732 million on Mar 31, 2026 and $36,366 million on Sep 30, 2026.
Said on Jan 27, 2026
American's Jan 27, 2026 release guided FY2026 adjusted EPS to $1.70 to $2.70 and free cash flowCash from operations minus spending on buildings and equipment. Learn more to more than $2 billion.
WithdrawnWhat happened
Replaced with a loss of $0.40 to a profit of $1.10 on Apr 23, 2026, a loss of $0.65 to a profit of $0.65 on Jul 23, and a loss of $1.60 to $1.00 on Oct 22.
Said on Oct 23, 2025
American's Oct 23, 2025 release guided FY2025 adjusted EPS to $0.65 to $0.95 and Q4 FY2025 to $0.45 to $0.75.
MissedWhat happened
FY2025 adjusted EPS was $0.36 and Q4 $0.16. GAAP diluted EPS was $0.17 and $0.15.
Said on Jan 23, 2025
American's Jan 23, 2025 release guided FY2025 adjusted EPS to $1.70 to $2.70.
WithdrawnWhat happened
Withdrawn on Apr 24, 2025. FY2025 adjusted EPS was $0.36.
Sources (12)
- 2026 proxy statement (DEF 14A)
- Form 8-K, Item 5.02: Vice Chair Stephen L. Johnson to retire at end of 2026 (Jun 16, 2026)
- Form 8-K, Item 5.02: Mary N. Dillon elected to the board (Mar 24, 2026)
- Form 8-K, Item 5.02: John W. Dietrich elected to the board (Jul 15, 2026)
- Earnings release, Q3 FY2026 (Form 8-K Exhibit 99.1, Oct 22, 2026)
- Earnings release, Q2 FY2026 (Form 8-K Exhibit 99.1, Jul 23, 2026)
- Earnings release, Q1 FY2026 (Form 8-K Exhibit 99.1, Apr 23, 2026)
- Form 8-K, Item 7.01: updated first-quarter 2026 guidance (Mar 17, 2026)
- Earnings release, Q4 and full year FY2025 (Form 8-K Exhibit 99.1, Jan 27, 2026)
- Earnings release, Q3 FY2025 (Form 8-K Exhibit 99.1, Oct 23, 2025)
- Earnings release, Q4 and full year FY2024 (Form 8-K Exhibit 99.1, Jan 23, 2025)
- Earnings release, Q1 FY2025 (Form 8-K Exhibit 99.1, Apr 24, 2025)
08What could go wrong
What could go wrong for American Airlines?
- Raw-material prices
Fuel price
Fuel cost $4,635 million in Q3 FY2026, up from $2,767 million a year earlier, as the price per gallon rose from $2.37 to $3.85. American does not hedge fuel. Fuel was 28.4% of Q3 FY2026 revenue (Cityfort calculation from the Q3 FY2026 earnings release).
Watch Price per gallon in each release. American's Oct 22, 2026 guidance assumes about $4.70 in Q4 FY2026.
- Debt
Debt and interest
Debt and finance leases were $29,635 million on Sep 30, 2026. FY2025 net interest expense of $1,716 million was larger than operating income of $1,467 million. Principal of $7,324 million falls due in 2028.
Watch American's total debt against its goal of below $35 billion: $36,366 million on Sep 30, 2026.
- Execution
Labor costs and unions
About 86% of American's 139,100 employees are in unions, and salaries, wages and benefits were 38% of 2025 operating expenses. A new flight attendant contract brought $516 million of one-time charges in Q3 FY2024.
Watch Salaries, wages and benefits each quarter: $4,713 million in Q3 FY2026.
- Execution
Regional airlines and safety
American relies on its own and contracted regional airlines. The fatal accident of American Eagle flight 5342 on Jan 29, 2025 cut Q1 FY2025 revenue by about $200 million, by the FY2025 10-K.
Watch Regional operating expenses, before regional depreciation: $1,356 million in Q3 FY2026.
- Other
Events outside its control
The FY2025 10-K names government shutdowns as a risk. The Q4 FY2025 shutdown cut revenue by about $325 million, and winter storms cut Q1 FY2026 revenue by about $320 million.
Watch Revenue effects the company states in each earnings release.
- Competition
Competition on fares
The FY2025 10-K calls the industry intensely competitive and names nine US rivals. FY2025 passenger revenue was $49,643 million, against $49,586 million in FY2024, while capacity, in available seat miles, rose 2.2%, as stated in the FY2025 10-K.
Watch Passenger revenue per seat mile: 18.47 cents in Q3 FY2026.
- Cash and liquidity
Card processing agreements
American's FY2025 10-K says its credit card processing agreements could affect its liquidity if its finances worsen. Total available liquidity was $11.8 billion on Sep 30, 2026, by the company.
Watch Total available liquidity in each 10-Q.
- Legal
Antitrust lawsuits
Private plaintiffs filed putative class action complaints from December 2022 alleging that AAG and JetBlue violated US antitrust law through the former Northeast Alliance; a class certification motion filed in July 2026 was opposed by AAG and JetBlue in October 2026, and AAG says the suits are without merit (Q3 FY2026 10-Q).
Watch Updates in the legal proceedings note of each 10-Q.
Sources (6)
- Earnings release, Q3 FY2026 (Form 8-K Exhibit 99.1, Oct 22, 2026)
- Earnings release, Q3 FY2025 (Form 8-K Exhibit 99.1, Oct 23, 2025)
- Form 10-Q, Q3 FY2026 (quarter ended Sep 30, 2026)
- Form 10-K, fiscal year 2025 (ended Dec 31, 2025)
- Earnings release, Q4 and full year FY2025 (Form 8-K Exhibit 99.1, Jan 27, 2026)
- Earnings release, Q1 FY2026 (Form 8-K Exhibit 99.1, Apr 23, 2026)
09Both sides
What do supporters and critics point to?
What supporters point to
- Q3 FY2026 revenue was $16,335 million, up 19.3% from a year earlier, and premium revenue rose 22.9%, the company said.
- Loyalty marketing services revenue rose from $2,166 million in FY2021 to $3,511 million in FY2025.
- Debt and finance leases fell from $38,060 million at Dec 31, 2021 to $29,635 million at Sep 30, 2026.
- Operating cash flow was $4,541 million in the first nine months of FY2026, up from $3,373 million a year earlier.
- Total available liquidity was $11.8 billion on Sep 30, 2026, by the company.
What critics point to
- American lost $269 million in Q3 FY2026 and $580 million in the first nine months, against net income of $12 million a year earlier.
- Fuel cost rose 67.5% to $4,635 million in Q3 FY2026, and American does not hedge fuel.
- Stockholders' equity was negative at every year end from FY2021 to FY2025, and the deficit was $4,224 million on Sep 30, 2026.
- FY2026 adjusted EPS guidance went from $1.70 to $2.70 in January to a loss of $1.60 to $1.00 in October.
- FY2025 net interest expense of $1,716 million was larger than operating income of $1,467 million.
10What to watch next
What should you watch next at American Airlines?
Next event
Q4 FY2026 results
Date not announced yet.
Fuel price per gallon
$3.85 in Q3 FY2026, up from $2.37 a year earlier. American's Oct 22, 2026 guidance assumes about $4.70 in Q4.
Fourth-quarter revenue
Q3 FY2026 revenue rose 19.3%. American guided Q4 FY2026 revenue up 19.5% to 22.5% on Oct 22, 2026.
Total debt
$36,366 million on Sep 30, 2026, on American's own measure. On Jan 27, 2026 it aimed for below $35 billion in 2026.
Cost savings
American said on Oct 22, 2026 it expects nearly $1 billion of annual run-rate savings by the end of 2026.
Net income
A net loss of $269 million in Q3 FY2026 and $580 million in the first nine months.
11Key facts
Key facts about American Airlines
- What does American Airlines do?
- American Airlines Group runs American Airlines, which boarded about 224 million passengers in 2025 and flies to over 350 destinations from nine US hubs. American Airlines Group's FY2025 revenue was $54,633 million.
- How does American Airlines make money, and what is its business model?
- American Airlines Group's business model is selling airline seats and AAdvantage miles. In FY2025, American Airlines Group's passenger revenue was $49,643 million of its $54,633 million total. Other revenue was $4,151 million, mostly $3,511 million of loyalty marketing services, and cargo was $839 million.
- Is American Airlines profitable?
- American Airlines Group's FY2025 net income was $111 million, down from $846 million in FY2024, on operating income of $1,467 million. American Airlines Group reported a net loss of $269 million in Q3 FY2026, against a $114 million loss a year earlier.
- What is American Airlines' revenue by segment?
- American Airlines Group reports a single operating segment. By region, American Airlines Group's FY2025 passenger revenue was $35,201 million domestic, $6,583 million Atlantic, $6,444 million Latin America and $1,415 million Pacific.
- Who are American Airlines' customers?
- American Airlines Group names no customer as a concentration of revenue. In FY2025, American Airlines Group's ticket sales were 83.5% of revenue, miles redeemed for travel 7.4%, loyalty marketing services 6.4%, cargo 1.5% and other revenue 1.2% (Cityfort calculation from the FY2025 10-K). Citi is its most significant mileage partner.
- Who owns American Airlines?
- American Airlines Group's largest reported holders are PRIMECAP Management with 10.46% (May 31, 2026), BlackRock with 9.4% (Sep 30, 2026) and Vanguard Capital Management with 5.11% (Mar 31, 2026). American Airlines Group's directors and executive officers as a group held 0.70% on Apr 13, 2026 (Cityfort calculation from the 2026 proxy statement).
- How does the American Airlines AAdvantage program make money?
- American Airlines Group sells AAdvantage miles to partners, chiefly Citi, its exclusive US co-brand card issuer from 2026. In FY2025, American Airlines Group booked $4,036 million of loyalty travel revenue and $3,511 million of loyalty marketing services revenue. Co-brand card and other partners paid it $6.2 billion in cash in 2025.
- How much does American Airlines earn from cargo?
- American Airlines Group's cargo revenue was $839 million in FY2025, up from $804 million in FY2024 and down from $1,314 million in FY2021. Cargo was 1.5% of American Airlines Group's FY2025 revenue (Cityfort calculation from the FY2025 10-K).
- How big is American Airlines?
- American Airlines Group had FY2025 revenue of $54,633 million. At Dec 31, 2025, American Airlines Group had 1,580 aircraft, including 567 regional aircraft, and about 139,100 full-time equivalent employees.
- How much debt does American Airlines have?
- American Airlines Group had $29,635 million of debt and finance leases and $8,287 million of cash and short-term investments on Sep 30, 2026. American Airlines Group's stockholders' deficit was $4,224 million on that date.
Sources (7)
- Form 10-K, fiscal year 2025 (ended Dec 31, 2025)
- Earnings release, Q3 FY2026 (Form 8-K Exhibit 99.1, Oct 22, 2026)
- Schedule 13G/A by PRIMECAP Management Company (event May 31, 2026)
- Schedule 13G/A by BlackRock, Inc. (event Sep 30, 2026)
- Schedule 13G by Vanguard Capital Management LLC (event Mar 31, 2026)
- 2026 proxy statement (DEF 14A)
- Form 10-K, fiscal year 2022 (ended Dec 31, 2022)
Terms on this page
- Capital expenditures (capex)
- Earnings per share (EPS)
- EBITDA
- Free cash flow
- Interest coverage
- Market cap
- Net debt
- Net margin
- Revenue vs net income
Each explains the term in plain English, with the same number from other companies on Cityfort.
Go deeper
More detail from the same filings. Open any section.
12What it sells
12What it sells
What does American Airlines sell?
Passenger tickets
Seats on American and American Eagle flights. Passenger travel revenue was $45,607 million in FY2025, against $45,743 million in FY2024.
Miles redeemed for travel
When AAdvantage members spend miles on flights, American books loyalty travel revenue: $4,036 million in FY2025, up from $3,843 million.
Loyalty marketing services
What American books for marketing services under its AAdvantage deals with Citi and other partners: $3,511 million in FY2025, up from $3,257 million.
Cargo
Freight and mail carried on passenger flights: $839 million in FY2025, up from $804 million.
Other revenue
Everything else: $640 million in FY2025, up from $564 million.
What it does
- Does: Flies to over 350 destinations from hubs in Charlotte, Chicago, Dallas/Fort Worth, Los Angeles, Miami, New York, Philadelphia, Phoenix and Washington, D.C.
- Does: Owns three regional airlines, Envoy, PSA and Piedmont, and buys flying from Republic and SkyWest under capacity purchase agreements.
- Does: Runs joint businesses with British Airways, Iberia, Aer Lingus and Finnair across the Atlantic, Japan Airlines across the Pacific, and Qantas.
- Does: Sells AAdvantage miles to Citi, its exclusive US co-brand credit card issuer from 2026 under a 10-year agreement.
What it does not do
- Does not: Hedge fuel: it had no fuel hedges at Dec 31, 2025 or Sep 30, 2026, and its policy is not to hedge.
- Does not: Pay a dividend: the last one was in 2020.
- Does not: Report profit for AAdvantage or any region: it has one operating segment.
- Does not: Have positive stockholders' equity: it reported a stockholders' deficit of $4,224 million on Sep 30, 2026.
13How the money flows
13How the money flows · FY2025
How does money flow through American Airlines?
Money in
- Passenger revenue$49.6B
- Other revenue, mostly loyalty marketing$4.2B
- Cargo$839M
- Interest income $357M and other income $82M$439M
The company
American Airlines
$55.1B came in
Money out
- Salaries, wages and benefits$17.6B
- Aircraft fuel and related taxes$10.7B
- Selling, depreciation, special items and other operating$10.9B
- Maintenance, airport rent, landing fees and aircraft rent$8.5B
- Regional airline expenses$5.4B
- Interest expense $1,716M and income tax $79M$1.8B
- Net income$111M
- Travelers, loyalty partners and cargo shippers paid American $54,633 million in FY2025.
- Staff cost $17,566 million and fuel $10,718 million.
- Regional airlines, maintenance, airports, aircraft and other costs took the rest, leaving operating income of $1,467 million.
- Interest income and other income of $439 million came in. Interest expense of $1,716 million and tax of $79 million went out.
- That left $111 million of net income.
14What it needs to run
14What it needs to run
What does American Airlines need to run?
Aircraft
1,013 mainline aircraft, averaging 14.3 years old, and 567 regional aircraft at Dec 31, 2025; 1,624 in all at Sep 30, 2026. Its Q3 FY2026 10-Q (Oct 22, 2026) listed 365 more on order, including five Airbus A320 Family options exercised in October 2026. Its FY2025 10-K (Feb 18, 2026) estimated about $17.5 billion of aircraft and engine purchase commitments for 2026 to 2030.
Jet fuel
American used 4,488 million gallons in FY2025 at $2.39 a gallon. It paid $3.85 a gallon in Q3 FY2026, up from $2.37 a year earlier.
People
About 139,100 full-time equivalent employees at Dec 31, 2025, about 86% of them in unions. Salaries, wages and benefits were 38% of 2025 operating expenses.
Hubs
Charlotte, Chicago, Dallas/Fort Worth, Los Angeles, Miami, New York, Philadelphia, Phoenix and Washington, D.C.
Regional airlines
Envoy, PSA and Piedmont, which American owns, plus Republic and SkyWest under contract. Regional expenses were $5,448 million in FY2025.
Partners
A founding member of the oneworld alliance, with joint businesses across the Atlantic and Pacific and alliances with Alaska Airlines and Qatar Airways.
15Where it sells
15Where it sells · FY2025
Where does American Airlines sell?
- Domestic (share of passenger revenue)71%
- Atlantic13%
- Latin America13%
- Pacific3%
16Competitors and what protects it
16Competitors and what protects it
Who does American Airlines compete with?
Delta Air Lines
NYSE: DAL
Named by American as a domestic competitor.
United Airlines
NASDAQ: UAL
Named by American as a domestic competitor. American said on Apr 17, 2026 that it is not interested in merger discussions with United.
Southwest Airlines
Named by American as a domestic competitor.
JetBlue Airways
Named by American as a domestic competitor; the two once ran the Northeast Alliance.
Alaska Airlines
Named by American as a domestic competitor, and also a strategic alliance partner.
What protects the business
Each strength is scored 1 (weak) to 5 (strong) for the business, with the reason. It is not a rating of the share.
- Hub network4 of 5
Nine US hubs feed over 350 destinations, and American boarded about 224 million passengers in 2025.
- AAdvantage and the Citi card4 of 5
Co-brand card and other partners paid $6.2 billion in cash in 2025. Loyalty lines were 13.8% of FY2025 revenue (Cityfort calculation from the FY2025 10-K).
- International partners3 of 5
A founding member of oneworld, with joint businesses with British Airways, Japan Airlines and Qantas. Atlantic and Pacific flights were 16.1% of FY2025 passenger revenue (Cityfort calculation from the FY2025 10-K).
Weak spot
Fuel price
American's policy is not to hedge fuel. Fuel cost $4,635 million in Q3 FY2026, up 67.5% from $2,767 million a year earlier.
Sources (5)
- Form 10-K, fiscal year 2025 (ended Dec 31, 2025)
- Form 8-K, Exhibit 99.1: statement on a possible United Airlines merger (Apr 17, 2026; filed Apr 20)
- Form 10-Q, Q3 FY2026 (quarter ended Sep 30, 2026)
- Earnings release, Q3 FY2026 (Form 8-K Exhibit 99.1, Oct 22, 2026)
- Earnings release, Q3 FY2025 (Form 8-K Exhibit 99.1, Oct 23, 2025)
17Where growth could come from
17Where growth could come from
Where could American Airlines' growth come from?
American said in its Oct 22, 2026 earnings release that it expects FY2026 adjusted EPS of a loss of $1.60 to $1.00, on its own definition, with Q4 revenue up 19.5% to 22.5% and fuel at about $4.70 a gallon. On Jan 27, 2026 it had said a profit of $1.70 to $2.70. Nine-month GAAP diluted EPS was a loss of $0.88.
Premium cabins
WorkingPremium revenue up 22.9%, Q3 FY2026
American said on Oct 22, 2026 that premium products are roughly half of ticket revenue on about 30% of seats. These are company statements.
Status: Working, on track against what the company said.
AAdvantage and the Citi card
Working$3,511M loyalty marketing revenue, FY2025
Up from $3,257 million in FY2024. AAdvantage enrollments rose 27.4% in Q3 FY2026, the company said.
Status: Working, on track against what the company said.
Corporate travel
WorkingManaged corporate revenue up 27.6%, Q3 FY2026
A company statement in the Oct 22, 2026 earnings release.
Status: Working, on track against what the company said.
Passing fuel costs into fares
MixedRevenue $16,335M, Q3 FY2026
Up 19.3% from $13,691 million a year earlier, while fuel rose 67.5% to $4,635 million. Operating income fell from $151 million to $115 million.
Status: Mixed, partly on track.
Paying down debt
Mixed$36,366M company total debt, Sep 30, 2026
On Jan 27, 2026 American aimed for total debt below $35 billion in 2026. It was $34,732 million on Mar 31, 2026. This total includes operating leases and pension.
Status: Mixed, partly on track.
Status compares progress with what the company itself said it would do: Working = on track against what the company said; Mixed = partly on track; Behind = behind the company's own plan; New = recently announced; Early = too early to judge.
Sources (6)
- Earnings release, Q3 FY2026 (Form 8-K Exhibit 99.1, Oct 22, 2026)
- Third-quarter 2026 financial results presentation (Form 8-K Exhibit 99.2, Oct 22, 2026)
- Earnings release, Q4 and full year FY2025 (Form 8-K Exhibit 99.1, Jan 27, 2026)
- Form 10-K, fiscal year 2025 (ended Dec 31, 2025)
- Earnings release, Q3 FY2025 (Form 8-K Exhibit 99.1, Oct 23, 2025)
- Earnings release, Q1 FY2026 (Form 8-K Exhibit 99.1, Apr 23, 2026)
18The company's own measures (non-GAAP)
18The company's own measures · FY2024 to Q3 FY2026, as each row says
What do American Airlines' own measures show?
Official (GAAP): Net income, FY2025
$111M
Company's own measure: Net income excluding net special items, FY2025
$237M
Leaves out $162 million of pre-tax special items, including litigation reserve changes, severance and labor contract costs.
Official (GAAP): Net income, FY2024
$846M
Company's own measure: Net income excluding net special items, FY2024
$1.4B
Leaves out $667 million of pre-tax special items, mostly $605 million of labor contract costs.
Official (GAAP): Diluted EPS, FY2025
$0.17
Company's own measure: Adjusted EPS, FY2025
$0.36
Excludes net special items.
Official (GAAP): Diluted EPS, Q3 FY2026
−$0.41
Company's own measure: Adjusted EPS, Q3 FY2026
−$0.28
Leaves out $87 million of net special items after tax.
Official (GAAP): Pre-tax income, Q3 FY2026
−$334M
Company's own measure: Pre-tax income excluding net special items, Q3 FY2026
−$222M
A smaller loss once special items are taken out.
Official (GAAP): Cost per available seat mile, Q3 FY2026
$20.1M
Company's own measure: Unit cost excluding special items and fuel, Q3 FY2026
14.3 cents per available seat mile
Leaves fuel and special items out of costs, before dividing by seat miles flown.
Official (GAAP): Operating cash flow, FY2025
$3.1B
Company's own measure: American's free cash flow, FY2025
−$83M
Operating cash flow less investing cash flow, adjusted for short-term investments and restricted cash, so it counts sale-leaseback proceeds. Operating cash flow minus capital spending, as this page calculates it, was negative $680 million.
Official (GAAP): Debt and finance leases, Sep 30, 2026
$29.6B
Company's own measure: Total debt, Sep 30, 2026
$36.4B
Adds $6,639 million of operating lease liabilities and $92 million of pension obligations.
Official (GAAP): Debt and finance leases, Sep 30, 2026
$29.6B
Company's own measure: Net debt, Sep 30, 2026
$28.1B
American's total debt above, minus $8,287 million of unrestricted cash and short-term investments.
Official (GAAP): Cash and short-term investments, Sep 30, 2026
$8.3B
Company's own measure: Total available liquidity, Sep 30, 2026
$11.8B
Adds $3.5 billion of undrawn credit facilities to unrestricted cash and short-term investments.
Official (GAAP): Loyalty revenue, marketing services, FY2025
$3.5B
Company's own measure: Cash from co-brand card and other partners, FY2025
$6.2B
Cash received in the year, as the FY2025 10-K states it; it is not a revenue line.
These are the company's own measures, defined by the company. They are not comparable across companies, and they are not added together. Each sits beside the nearest official (GAAP) figure.
Learn: Non-GAAP measures: what a company's "adjusted" numbers leave out
Sources (5)
19Financial strength and debt
19Financial strength · Sep 30, 2026
How much debt does American Airlines have?
- Total debt$29.6B
- Cash and investments$8.3B
- Net debt (debt minus cash)$21.3B
- Net worth (shareholders' money)−$4.2B
- Interest cover
- 0.9×
- how many times operating profit covers interest
- Net debt of $21,348 million is debt and finance leases minus cash and short-term investments (Cityfort calculation from the Q3 FY2026 earnings release). American's own total debt of $36,366 million adds operating leases and pension.
- Debt to equity is not shown: stockholders' equity was negative at every year end from FY2021 to FY2025 and on Sep 30, 2026. Interest cover of 0.9 is FY2025 operating income of $1,467 million ÷ net interest expense of $1,716 million (Cityfort calculation from the FY2025 10-K).
- Principal due was $3,641 million in 2026, $4,455 million in 2027 and $7,324 million in 2028, by the FY2025 10-K.
- In 2026, American prepaid $1.0 billion of 8.50% notes, repaid a $629 million short-term loan and extended $3.1 billion of revolving credit to March 2031.
- American also held $9,414 million for tickets sold but not yet flown on Sep 30, 2026.
- Total available liquidity was $11.8 billion on Sep 30, 2026, including $3.5 billion of undrawn credit, by American's Q3 FY2026 10-Q.
20Who owns it
20Who owns it · ownership as of Apr 13, 2026
Who owns American Airlines?
- Officers and directors (as a group), shares
- 0.7%
Share classes
Holders of 5% or more
From the company's proxy statement (DEF 14A), later Schedule 13G filings and the share counts on its latest annual or quarterly report. Each holder row shows the date of its own filing.
Insider trades · Form 4 data as of Nov 6, 2026
What did American Airlines' insiders report trading?
American Airlines' insiders made 44 Form 4A filing an insider must make within two business days of buying or selling the company's shares. Learn more filings in the 12 months to Nov 6, 2026.
They reported no purchases and 11 sales (443,146 shares) in the open market or privately (codes P and S).
4 of the 11 sales were on forms with the Rule 10b5-1 plan box checked.
The same filings report 44 other share transactions (F: 23, A: 21).
Insiders are a company's officers, directors and owners of more than 10% of a class of its shares. Most changes in their holdings must be reported to the SEC on a Form 4 within two business days. Source: SEC Form 4 filings on EDGAR.
- P
- a purchase in the open market or privately
- S
- a sale in the open market or privately
- A
- a grant, award or other acquisition from the company under Rule 16b-3
- F
- shares withheld or handed over to pay an exercise price or tax when an award is received, exercised or vests
Code meanings: General Instruction 8 of Form 4 (SEC).
The latest 25 of 55 transactions
Shares: A = acquired, D = disposed of. A price the filing gives only in a footnote shows as “See filing”. The 10b5-1 box is checked when at least one trade on the form was made under a Rule 10b5-1 plan. A Form 4/A replaces the form it amends. See all of American Airlines' Form 4 filings on EDGAR.
Learn: How to read a proxy statement (DEF 14A): Nvidia's 2026 proxy · Form 4 insider filings: who files, the codes and the footnotes · Rule 10b5-1 trading plans: how insiders pre-schedule their trades
Sources (6)
- Form 10-Q, Q3 FY2026 (quarter ended Sep 30, 2026)
- Schedule 13G/A by PRIMECAP Management Company (event May 31, 2026)
- 2026 proxy statement (DEF 14A)
- Schedule 13G/A by BlackRock, Inc. (event Sep 30, 2026)
- Schedule 13G by Vanguard Capital Management LLC (event Mar 31, 2026)
- Schedule 13G/A by The Vanguard Group (event Mar 13, 2026; 0 shares after realignment)
21What it does with profit
21What it does with profit
What does American Airlines do with its profit?
No buybacks or fund raises in the period covered.
22Governance signals
22Governance signals
What do American Airlines' governance filings show?
- Auditor
- KPMG LLP, since 2014
- Auditor changes
- None in the period covered
- Audit qualifications
- None reported
- Related-party dealings
- American held 20.8% of Republic Airways Holdings at Nov 25, 2025. Republic flies regional routes for American under a capacity purchase agreement. American recorded a $78 million impairment of that stake in Q3 FY2026.
- Credit rating
- Not checked for this page
Flags to know about
disclosure · Nov 6, 2026
Credit rating not named in the filings
None of the filings used here names an agency rating. American stated a goal of BB ratings on Jan 23, 2025, and its revolving credit margins depend on its public corporate credit rating. On Oct 22, 2026 it described a target of 3.0 times net debt to EBITDAR as "in line with BB credit metrics". S&P's ratings site needs a login, and Moody's and Fitch's could not be reached on Nov 6, 2026.
other
Northeast Alliance antitrust class actions
Private plaintiffs filed putative class action complaints from December 2022 alleging that AAG and JetBlue violated US antitrust law through the former Northeast Alliance; a class certification motion filed in July 2026 was opposed by AAG and JetBlue in October 2026, and AAG says the suits are without merit (Q3 FY2026 10-Q).
disclosure
Negative stockholders' equity
American reported a stockholders' deficit at every year end from FY2021 ($7,340 million) to FY2025 ($3,727 million), and $4,224 million on Sep 30, 2026.
disclosure
Two companies in one filing
American's 10-K and 10-Qs carry statements for both American Airlines Group and its subsidiary American Airlines, Inc. This page uses American Airlines Group's figures.
other · Apr 17, 2026
Statement on a United merger
On Apr 17, 2026, American said it "is not engaged with or interested in any discussions regarding a merger with United Airlines".
other · Jun 10, 2026
More shares for stock-based pay
Shareholders approved an amended 2023 Incentive Award Plan, adding 16.5 million shares, at the Jun 10, 2026 annual meeting.
Sources (10)
- 2026 proxy statement (DEF 14A)
- Schedule 13D by American Airlines Group on Republic Airways Holdings Inc. (event Nov 25, 2025)
- Form 10-K, fiscal year 2025 (ended Dec 31, 2025)
- Form 10-Q, Q3 FY2026 (quarter ended Sep 30, 2026)
- Earnings release, Q4 and full year FY2024 (Form 8-K Exhibit 99.1, Jan 23, 2025)
- Earnings release, Q3 FY2026 (Form 8-K Exhibit 99.1, Oct 22, 2026)
- EDGAR submissions index for American Airlines Group Inc. (CIK 0000006201)
- Form 10-K, fiscal year 2022 (ended Dec 31, 2022)
- Form 8-K, Exhibit 99.1: statement on a possible United Airlines merger (Apr 17, 2026; filed Apr 20)
- Form 8-K, Items 5.02 and 5.07: 2026 annual meeting results (Jun 10, 2026)
23What the market paid
23What the market paid · price as of Nov 5, 2026
What did the market pay for American Airlines on Nov 5, 2026?
Price as of Nov 5, 2026 (shown for education; prices change daily).
Price as of Nov 5, 2026: a $12.93 close, from Nasdaq's historical price table for AAL; American's shares are listed on Nasdaq. Market value = $12.93 × 662,618,434 shares (10-Q cover, Oct 16, 2026) = $8,568 million (Cityfort calculation from the Nov 5, 2026 Nasdaq closing price and the Q3 FY2026 10-Q). P/E (price ÷ earnings per share) is not shown: the last four quarters add to a net loss of $481 million (Cityfort calculation from the Q4 FY2025 to Q3 FY2026 earnings releases). Price to book is not shown because stockholders' equity was negative.
- Share price
- $12.93
- Market value (market cap)
- $8.6B
More price-based ratios · as of Nov 5, 2026
Each ratio divides a number from the company's filings by the market value or share price on Nov 5, 2026. Prices change daily, so these ratios do too.
Price to sales (P/S)
0.1×
$8.6B market value ÷ $61.0B revenue (four quarters to Sep 30, 2026) = 0.1×
Cityfort calculation from the Nov 5, 2026 closing price and the Q4 FY2025 to Q3 FY2026 earnings releases. Source: AAL historical prices, Oct 1 to Nov 5, 2026 (Nasdaq historical table; AAL is listed on Nasdaq; close of Nov 5, 2026: $12.93); Form 10-Q, Q3 FY2026 (quarter ended Sep 30, 2026); Earnings release, Q4 and full year FY2025 (Form 8-K Exhibit 99.1, Jan 27, 2026) and 3 more
How price ratios workFree cash flow yield
−7.9%
−$680M free cash flow (FY2025) ÷ $8.6B market value = −7.9%
Cityfort calculation from the FY2025 10-K and the Nov 5, 2026 closing price. Source: AAL historical prices, Oct 1 to Nov 5, 2026 (Nasdaq historical table; AAL is listed on Nasdaq; close of Nov 5, 2026: $12.93); Form 10-Q, Q3 FY2026 (quarter ended Sep 30, 2026); Earnings release, Q4 and full year FY2025 (Form 8-K Exhibit 99.1, Jan 27, 2026) and 4 more
What free cash flow means
Shares used for the market value: 662.62 million ($12.93 × 662.62 million shares ≈ $8.6B). Source: Form 10-Q, Q3 FY2026 (quarter ended Sep 30, 2026)
Source: AAL historical prices, Oct 1 to Nov 5, 2026 (Nasdaq historical table; AAL is listed on Nasdaq; close of Nov 5, 2026: $12.93); Form 10-Q, Q3 FY2026 (quarter ended Sep 30, 2026); Earnings release, Q4 and full year FY2025 (Form 8-K Exhibit 99.1, Jan 27, 2026) and 3 more
Sources (7)
- AAL historical prices, Oct 1 to Nov 5, 2026 (Nasdaq historical table; AAL is listed on Nasdaq; close of Nov 5, 2026: $12.93)
- Form 10-Q, Q3 FY2026 (quarter ended Sep 30, 2026)
- Earnings release, Q4 and full year FY2025 (Form 8-K Exhibit 99.1, Jan 27, 2026)
- Earnings release, Q1 FY2026 (Form 8-K Exhibit 99.1, Apr 23, 2026)
- Earnings release, Q2 FY2026 (Form 8-K Exhibit 99.1, Jul 23, 2026)
- Earnings release, Q3 FY2026 (Form 8-K Exhibit 99.1, Oct 22, 2026)
- Form 10-K, fiscal year 2025 (ended Dec 31, 2025)
24How it got here
24How it got here
How did American Airlines get here?
2021
Crisis
Government payroll support
FY2021 included $4,455 million of net operating special credits, mainly federal Payroll Support Program aid. American still lost $1,059 million at the operating level and $1,993 million overall.
2022
Milestone
Back to a profit
Revenue reached $48,971 million and net income was $127 million.
2024
Milestone
Flight attendant contract and Citi deal
A new flight attendant contract brought $516 million of one-time charges. In December, American announced a 10-year deal making Citi its exclusive US co-brand card issuer from 2026.
2025
Crisis
Accident and withdrawn guidance
The fatal American Eagle flight 5342 accident on Jan 29 cut Q1 revenue by about $200 million. On Apr 24, American withdrew its FY2025 guidance.
2025
Milestone
Notes settled and a Republic stake
American settled its 6.50% convertible notes in cash on Jul 1, 2025. It received a 20.8% stake in Republic Airways Holdings when Republic merged with Mesa on Nov 25, 2025.
2025
Crisis
Government shutdown
The Q4 FY2025 shutdown cut revenue by about $325 million. FY2025 net income was $111 million.
2026
Crisis
Fuel spike and guidance cuts
Fuel rose to $4.05 a gallon in Q2 and $3.85 in Q3. FY2026 adjusted EPS guidance went from $1.70 to $2.70 in January to a loss of $1.60 to $1.00 in October.
2026
Milestone
Azul stake
American reported a 7.9% stake in Azul S.A. after an Oct 20, 2026 event.
Sources (10)
- Form 10-K, fiscal year 2022 (ended Dec 31, 2022)
- Earnings release, Q3 FY2025 (Form 8-K Exhibit 99.1, Oct 23, 2025)
- Form 10-K, fiscal year 2025 (ended Dec 31, 2025)
- Earnings release, Q1 FY2025 (Form 8-K Exhibit 99.1, Apr 24, 2025)
- Form 10-Q, Q3 FY2026 (quarter ended Sep 30, 2026)
- Schedule 13D by American Airlines Group on Republic Airways Holdings Inc. (event Nov 25, 2025)
- Earnings release, Q4 and full year FY2025 (Form 8-K Exhibit 99.1, Jan 27, 2026)
- Earnings release, Q2 FY2026 (Form 8-K Exhibit 99.1, Jul 23, 2026)
- Earnings release, Q3 FY2026 (Form 8-K Exhibit 99.1, Oct 22, 2026)
- Schedule 13D by American Airlines Group on Azul S.A. (event Oct 20, 2026)
25Sources and changes
Where every number on this page comes from
Sources (29 documents)
- S1Form 10-K, fiscal year 2025 (ended Dec 31, 2025) · American Airlines Group Inc. (SEC EDGAR) · Tier 1: company or exchange filing · Feb 18, 2026
- S2Form 10-K, fiscal year 2024 (ended Dec 31, 2024) · American Airlines Group Inc. (SEC EDGAR) · Tier 1: company or exchange filing · Feb 19, 2025
- S3Form 10-K, fiscal year 2023 (ended Dec 31, 2023) · American Airlines Group Inc. (SEC EDGAR) · Tier 1: company or exchange filing · Feb 21, 2024
- S4Form 10-K, fiscal year 2022 (ended Dec 31, 2022) · American Airlines Group Inc. (SEC EDGAR) · Tier 1: company or exchange filing · Feb 22, 2023
- S5Form 10-Q, Q3 FY2026 (quarter ended Sep 30, 2026) · American Airlines Group Inc. (SEC EDGAR) · Tier 1: company or exchange filing · Oct 22, 2026
- S11Earnings release, Q3 FY2026 (Form 8-K Exhibit 99.1, Oct 22, 2026) · American Airlines Group Inc. (SEC EDGAR) · Tier 1: company or exchange filing · Oct 22, 2026
- S12Earnings release, Q2 FY2026 (Form 8-K Exhibit 99.1, Jul 23, 2026) · American Airlines Group Inc. (SEC EDGAR) · Tier 1: company or exchange filing · Jul 23, 2026
- S13Earnings release, Q1 FY2026 (Form 8-K Exhibit 99.1, Apr 23, 2026) · American Airlines Group Inc. (SEC EDGAR) · Tier 1: company or exchange filing · Apr 23, 2026
- S14Earnings release, Q4 and full year FY2025 (Form 8-K Exhibit 99.1, Jan 27, 2026) · American Airlines Group Inc. (SEC EDGAR) · Tier 1: company or exchange filing · Jan 27, 2026
- S15Earnings release, Q3 FY2025 (Form 8-K Exhibit 99.1, Oct 23, 2025) · American Airlines Group Inc. (SEC EDGAR) · Tier 1: company or exchange filing · Oct 23, 2025
- S16Earnings release, Q2 FY2025 (Form 8-K Exhibit 99.1, Jul 24, 2025) · American Airlines Group Inc. (SEC EDGAR) · Tier 1: company or exchange filing · Jul 24, 2025
- S17Earnings release, Q1 FY2025 (Form 8-K Exhibit 99.1, Apr 24, 2025) · American Airlines Group Inc. (SEC EDGAR) · Tier 1: company or exchange filing · Apr 24, 2025
- S18Earnings release, Q4 and full year FY2024 (Form 8-K Exhibit 99.1, Jan 23, 2025) · American Airlines Group Inc. (SEC EDGAR) · Tier 1: company or exchange filing · Jan 23, 2025
- S19Third-quarter 2026 financial results presentation (Form 8-K Exhibit 99.2, Oct 22, 2026) · American Airlines Group Inc. (SEC EDGAR) · Tier 1: company or exchange filing · Oct 22, 2026
- S202026 proxy statement (DEF 14A) · American Airlines Group Inc. (SEC EDGAR) · Tier 1: company or exchange filing · Apr 28, 2026
- S21Schedule 13G/A by PRIMECAP Management Company (event May 31, 2026) · PRIMECAP Management Company (SEC EDGAR) · Tier 1: company or exchange filing · Jun 5, 2026
- S22Schedule 13G/A by BlackRock, Inc. (event Sep 30, 2026) · BlackRock, Inc. (SEC EDGAR) · Tier 1: company or exchange filing · Oct 27, 2026
- S23Schedule 13G by Vanguard Capital Management LLC (event Mar 31, 2026) · Vanguard Capital Management LLC (SEC EDGAR) · Tier 1: company or exchange filing · Apr 29, 2026
- S24Schedule 13G/A by The Vanguard Group (event Mar 13, 2026; 0 shares after realignment) · The Vanguard Group (SEC EDGAR) · Tier 1: company or exchange filing · Mar 26, 2026
- S25Schedule 13D by American Airlines Group on Republic Airways Holdings Inc. (event Nov 25, 2025) · American Airlines Group Inc. (SEC EDGAR) · Tier 1: company or exchange filing · Dec 19, 2025
- S26Schedule 13D by American Airlines Group on Azul S.A. (event Oct 20, 2026) · American Airlines Group Inc. (SEC EDGAR) · Tier 1: company or exchange filing · Oct 26, 2026
- S27Form 8-K, Item 7.01: updated first-quarter 2026 guidance (Mar 17, 2026) · American Airlines Group Inc. (SEC EDGAR) · Tier 1: company or exchange filing · Mar 17, 2026
- S28Form 8-K, Exhibit 99.1: statement on a possible United Airlines merger (Apr 17, 2026; filed Apr 20) · American Airlines Group Inc. (SEC EDGAR) · Tier 1: company or exchange filing · Apr 20, 2026
- S29Form 8-K, Item 5.02: Mary N. Dillon elected to the board (Mar 24, 2026) · American Airlines Group Inc. (SEC EDGAR) · Tier 1: company or exchange filing · Mar 24, 2026
- S30Form 8-K, Items 5.02 and 5.07: 2026 annual meeting results (Jun 10, 2026) · American Airlines Group Inc. (SEC EDGAR) · Tier 1: company or exchange filing · Jun 10, 2026
- S31Form 8-K, Item 5.02: Vice Chair Stephen L. Johnson to retire at end of 2026 (Jun 16, 2026) · American Airlines Group Inc. (SEC EDGAR) · Tier 1: company or exchange filing · Jun 16, 2026
- S32Form 8-K, Item 5.02: John W. Dietrich elected to the board (Jul 15, 2026) · American Airlines Group Inc. (SEC EDGAR) · Tier 1: company or exchange filing · Jul 15, 2026
- S35AAL historical prices, Oct 1 to Nov 5, 2026 (Nasdaq historical table; AAL is listed on Nasdaq; close of Nov 5, 2026: $12.93) · Nasdaq, Inc. · Tier 1: company or exchange filing · Nov 5, 2026
- S36EDGAR submissions index for American Airlines Group Inc. (CIK 0000006201) · U.S. Securities and Exchange Commission · Tier 1: company or exchange filing · Nov 6, 2026
Changes to this page (v1 · Nov 6, 2026)
- v1 · Nov 6, 2026First version, through Q3 FY2026 (quarter ended Sep 30, 2026). (first version)
Numbers come only from tier 1 and tier 2 sources. Read how we research.
Disclaimer
For learning only. Cityfort is not a registered investment adviser or broker-dealer and does not recommend buying or selling any security. Prices shown are dated and may be out of date.
Investing in securities involves risk, including loss of capital. Before making any investment decision, do your own research and consider consulting a registered investment adviser or other qualified professional.
Cityfort, its owners and contributors may or may not hold securities of companies covered. Cityfort is not paid by any company it covers. Content is not an offer or solicitation to buy or sell any security, including in any initial public offering.
Read the positions policyRead the full disclaimerHide the full disclaimer
Cityfort publishes general educational content that explains how listed companies work. Cityfort is not registered with the US Securities and Exchange Commission or any state securities regulator as an investment adviser, and is not a broker-dealer or a member of FINRA. Cityfort does not provide investment, tax or legal advice, recommendations, ratings, price targets or any opinion on whether to buy, sell or hold any security. Nothing on the site is tailored to any person's circumstances.
All information is taken from publicly available sources, mainly company filings with the SEC, which are listed on each page with dates. We work to keep it accurate and correct errors publicly, but we do not guarantee that it is complete, accurate or up to date. Any market price or price-based ratio shown is dated, may be out of date by the time you read it, and is included only to explain concepts.
Statements by company management, including forward-looking statements and guidance, are reported as the company's statements, with their date and source; they are not our forecasts. Adjusted (non-GAAP) figures are the company's own measures and are shown next to the official (GAAP) figures.