Financials · NYSE: TRV
Travelers: how the business works
Travelers sells property and casualty insurance to US businesses and households, and earned $43.9 billion of insurance premiums in FY2025.
By Hardik Bhandare · Checked against filings: . Editorial policy. Corrections
Follow Travelers
Email me when Travelers's page is updated after earnings.
We'll send a confirmation email first. See our privacy policy.
The Travelers Companies, Inc. · New York, New York · Founded 1853
Updated for Q3 FY2026 · checked
- Revenue, FY2025
- $48.8B
- Net income, FY2025
- $6.3B
- Combined ratio, FY2025
- 89.9
- Employees, Dec 31, 2025
- About 34,000
- Roots
- 1853
The short version
Travelers in 5 points
1 · What it sells
Travelers sells property and casualty insurance, policies that pay when a building burns, a car crashes or a business is sued, and earned $43,914 million of premiums in FY2025.
2 · Who pays it
Of Travelers' FY2025 premiums earned, businesses and other organizations paid 51%, individuals and families 39.6% and buyers of Bond & Specialty coverage 9.4%.
3 · What it keeps from $100
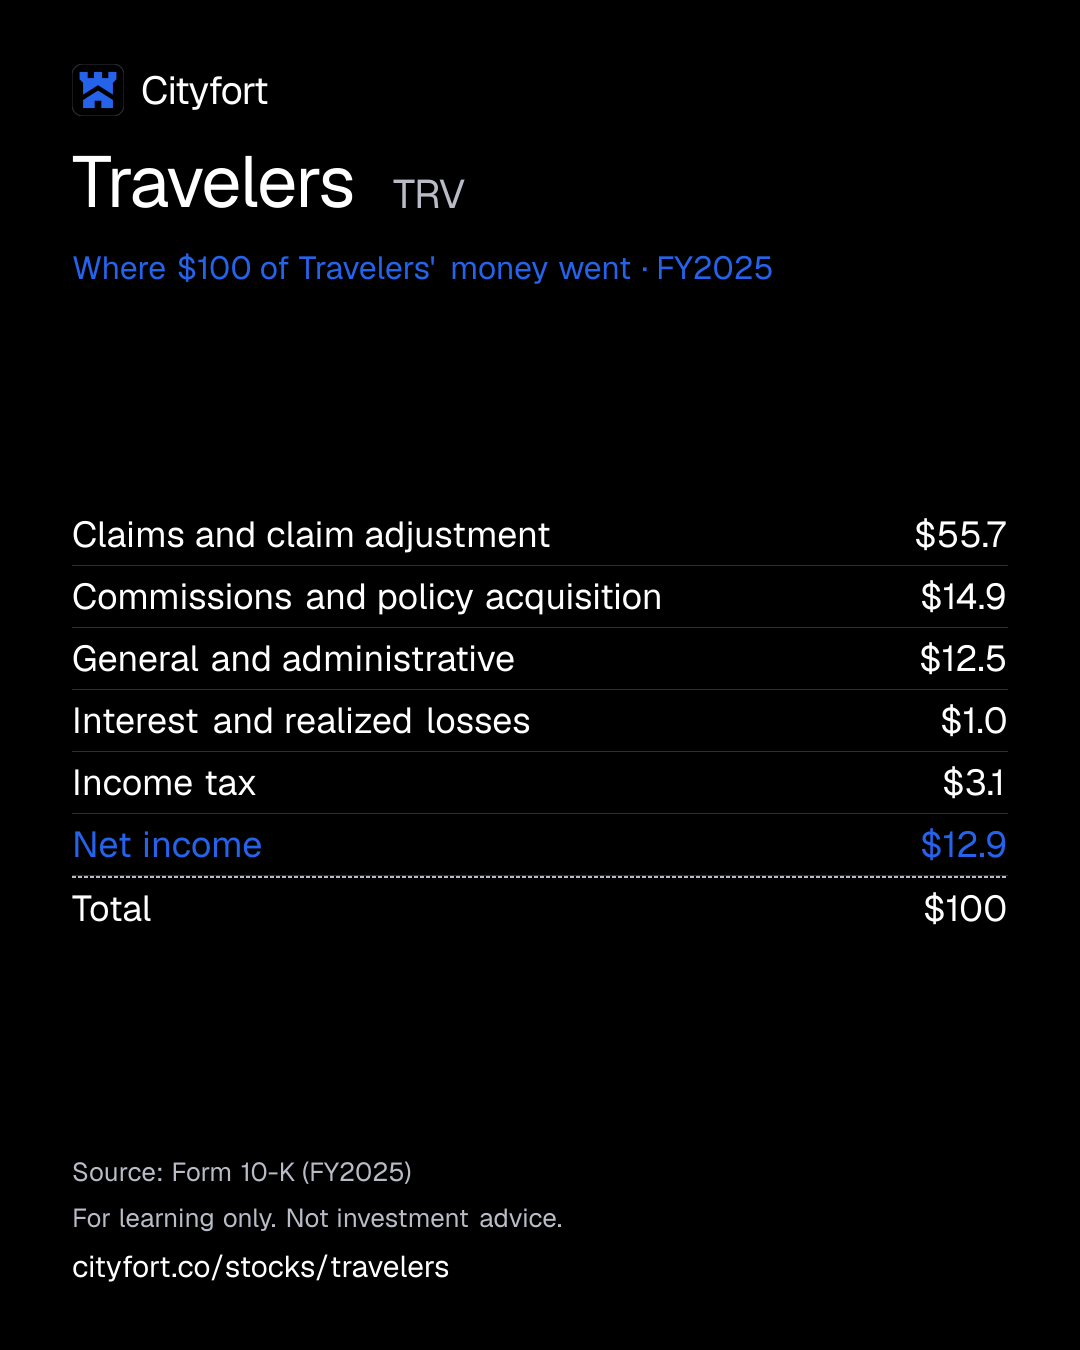
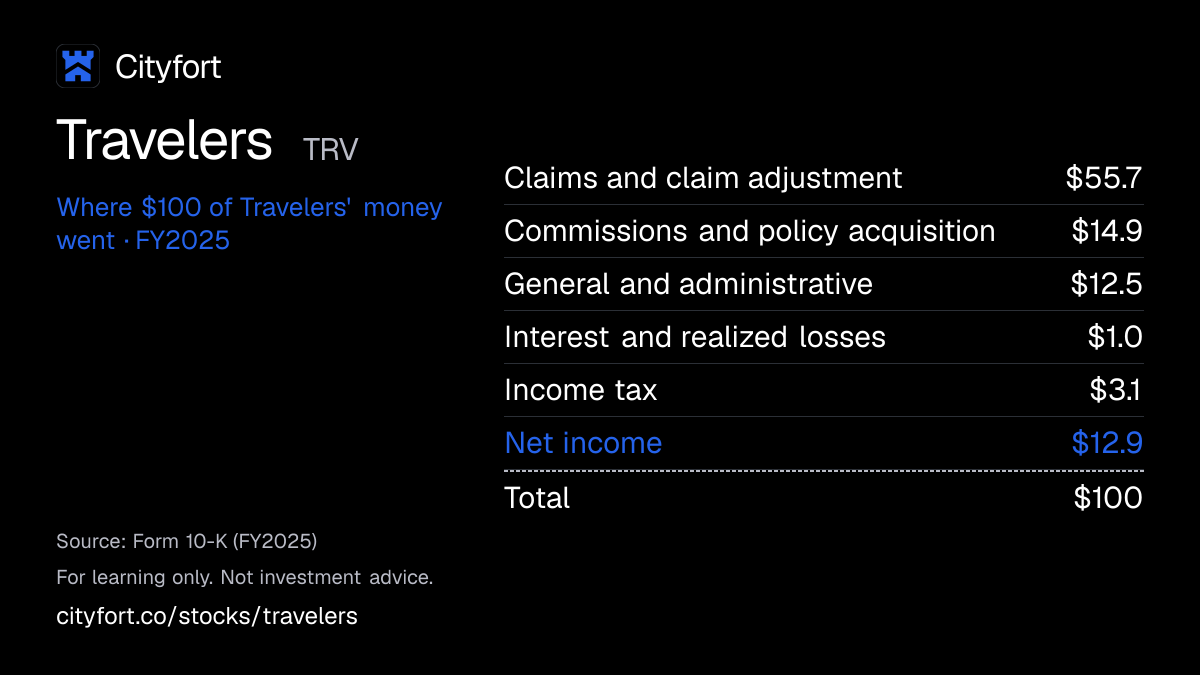
Of every $100 that came in during FY2025, Travelers paid $55.7 in claims and claim handling and kept $12.9 as net income, after $48 million of net realized investment losses; from insurance operations alone, its pre-tax underwriting gain was $4,265 million.
4 · Where the operating profit comes from
Business Insurance earned $3,695 million of segment income after tax in FY2025, Personal Insurance $2,053 million and Bond & Specialty Insurance $950 million.
5 · The one thing to watch
Travelers' pre-tax net unrealized investment losses were $8,049 million at Sep 30, 2026, against $1,862 million at Dec 31, 2025.
Sources: From Travelers' FY2025 10-K, Q4 FY2025 earnings release and Q3 FY2026 earnings release and financial supplement · checked
01Where $100 of an insurer's money goes · FY2025
Where does $100 of Travelers' money go?
Travelers · FY2025
Receipt for every $100
| Claims and claim adjustment | $55.7 |
|---|---|
| Commissions and policy acquisition | $14.9 |
| General and administrative | $12.5 |
| Interest and realized losses | $1.0 |
| Income tax | $3.1 |
| Net income | $12.9 |
| Total | $100 |
Each line = amount ÷ total money in × 100. Lines may not add to exactly $100 because of rounding.
How this is worked out
Cityfort calculation from the FY2025 10-K. Of every $100 that came in ($48,876 million: premiums earned, net investment income, fee income and other revenues): each line = line ÷ $48,876 million × 100. Interest and realized losses = $425 million of interest plus $48 million of net realized investment losses.
Save this receipt as an image
Embed this receipt or the key numbers
Paste this code into a blog or website to show the card you choose, with a link back to this page.
Each week: the next company due to report earnings, explained in 5 points.
No tips. Unsubscribe anytime.
We'll send a confirmation email. See our privacy policy.
02The business in one line
What does Travelers do?
Businesses and households pay Travelers premiums up front for coverage against fires, car crashes, storms and workplace accidents. Most of that money goes to pay claims, and Travelers invests it until the claims are paid.
- In FY2025, businesses paid 51% of Travelers' $43,914 million of premiums earned, households 39.6% and buyers of Bond & Specialty coverage 9.4% (Cityfort calculation from the FY2025 10-K).
- Of every $100 that came in during FY2025, $55.7 went on claims and claim handling and $12.9 was left as net income (Cityfort calculation from the FY2025 10-K).
03Who pays it
Who pays Travelers?
Businesses and other organizations
51%
of revenue
Companies from small shops (Select Accounts, under 50 employees) to large firms (National Accounts) pay for Business Insurance policies.
Individuals and families
39.6%
of revenue
Households pay for car and home coverage in Personal Insurance.
Companies, directors and contractors
9.4%
of revenue
Buyers of management liability coverage and surety bonds pay Bond & Specialty Insurance.
- Businesses and other organizations51%
- Individuals and families39.6%
- Companies, directors and contractors9.4%
How spread out the customers are
Shares are FY2025 premiums earned by segment out of $43,914 million (Cityfort calculation from the FY2025 10-K). Travelers does not disclose revenue by customer; it sells through independent agents and brokers.
Sources (1)
04How it makes money
How does Travelers make money?
Travelers earns twice: from pricing policies above their claims and costs, and from investing premiums before claims are paid.
The combined ratioAn insurer's claims plus underwriting costs, per $100 of premiums earned. Under 100% means premiums covered both. shows the first part: claims and costs per $100 of premiums, below 100 meaning an underwriting gain. Travelers reported 97.0 in FY2023 and 89.9 in FY2025. Net investment income adds the second part: $3,959 million in FY2025.
Combined ratio (claims and costs per $100 of premiums)
97.089.9
FY2023 to FY2025
- Customers pay premiums up front
- Travelers invests the money, mostly in bonds
- Claims are paid over months or years
- Prices are reset at renewal using claim experience
- A lower combined ratio and more investment income lift profit
↺ Step 5 feeds back into step 1.
05Business segments · FY2025
Which businesses make up Travelers?
Business Insurance
53.2%Insurance for companies of all sizes; segment income after tax was $3,695 million in FY2025, with a combined ratio of 91.7. Revenue shares are of the three segments' $48,876 million total (Cityfort calculation from the FY2025 10-K).
Revenue $26.0B ($26,018M)
Personal Insurance
37.4%Car and home insurance for individuals; segment income after tax was $2,053 million in FY2025, after a $128 million loss in FY2023.
Revenue $18.3B ($18,279M)
Bond & Specialty Insurance
9.4%Management liability and surety bonds; segment income after tax was $950 million in FY2025, with a combined ratio of 81.9.
Revenue $4.6B ($4,579M)
How the mix changed
- Business Insurance
- Personal Insurance
- Bond & Specialty Insurance
Revenue by segment, FY2023 to FY2025.
US$
See the numbers
Sources (1)
06The numbers · Consolidated · US$
How has Travelers done?
Premiums earned
$43.9BFY2025
Net premiums written rose every year, from $31,959 million in FY2021 to $44,387 million in FY2025.
US$ · net premiums earned: the part of premiums that covers the period, after reinsurance
See the yearly numbers
See the quarterly numbers
Combined ratio
89.9%FY2025
The combined ratio, claims and costs per $100 of premiums as Travelers reports it, peaked at 97.0 in FY2023 and was 89.9 in FY2025; below 100 means an underwriting gain.
Travelers calculates its loss and underwriting expense ratios on its own basis, so they differ from the claims and cost lines here divided by premiums earned; its underwriting gain counts fee income and only insurance-related expenses.
% of premiums earned · claims plus underwriting costs per $100 of premiums, as reported; under 100% means premiums covered both
See the yearly numbers
See the quarterly numbers
Net income
$6.3BFY2025
Net income rose to $6,288 million in FY2025, with a pre-tax underwriting gain of $4,265 million and $3,959 million of pre-tax net investment income.
US$ · after claims, costs, investment results and tax; the table shows where it came from
See the numbers
Catastrophe losses
$3.7BFY2025
Pre-tax catastrophe losses rose every year, from about $1,850 million in FY2021 to $3,690 million in FY2025.
US$ · claims from storms, wildfires and other events the company counts as catastrophes, as reported
See the numbers
See all yearly numbers
Loss ratio = losses and loss adjustment expenses ÷ net premiums earned. Expense ratio = underwriting costs ÷ net premiums earned. Combined ratio = loss ratio + expense ratio, as the company reports them. Net investment income is interest and dividends on the money the company holds before paying claims; realized and unrealized gains are shown apart because they move with markets. Net income is the amount for common stockholders. Fiscal years are the company's own (Fiscal year ends Dec 31 (calendar year)).
- Loss, underwriting expense and combined ratios are as Travelers reports them in its 10-Ks and earnings releases.
- Underwriting expenses here are amortization of deferred acquisition costs plus general and administrative expenses (Cityfort calculation from the FY2021 to FY2025 10-Ks); general and administrative expenses include some costs Travelers does not count as insurance-related.
- Realized gains are net realized investment gains (losses), which include fair-value changes on stocks still held ($50 million in FY2025). Price changes on bonds go to other comprehensive income, not net income.
- Fees and other are fee income plus other revenues. FY2021 and FY2022 catastrophe losses are stated in the 10-Ks as $1.85 billion and $1.88 billion. This page does not show the underwriting gain or return on equity for those two years.
- Quarterly net premiums written for 2024 come from the Q4 FY2024 supplement and for 2025 to 2026 from the Q3 FY2026 supplement; the two bases differ slightly.
- Travelers sold most of its Canadian business on Jan 2, 2026, so 2026 premiums exclude it. Excluding the sale, net written premiums grew 2% in Q3 FY2026 and in the first nine months, the company says.
- Book value per share was $141.48 at Sep 30, 2026. The company's adjusted book value per share, which excludes net unrealized investment losses, was $172.47.
Learn: What is the combined ratio? Claims plus costs, with real US insurers · How to read a US earnings release: Nvidia's Q2 fiscal 2027 · What is return on equity? Profit on equity, with real US companies · Fiscal years that don't end in December: Nvidia's FY2027 explained
Sources (10)
- Form 10-K for FY2021
- Form 10-K for FY2023
- Form 10-K for FY2022
- Q4 FY2024 earnings release (8-K Ex. 99.1)
- Form 10-K for FY2024
- Form 10-K for FY2025
- Q4 FY2025 earnings release (8-K Ex. 99.1)
- Q4 FY2024 financial supplement (8-K Ex. 99.2)
- Q3 FY2026 financial supplement (8-K Ex. 99.2)
- Q4 FY2025 financial supplement (8-K Ex. 99.2)
07Who runs it
Who runs Travelers, and did they deliver?
Alan D. Schnitzer
Chairman and Chief Executive Officer · since 2015
CEO since Dec 2015 and Chairman since Aug 2017.
Daniel S. Frey
Executive Vice President and Chief Financial Officer · since 2018
CFO since Sep 2018.
Gregory C. Toczydlowski
President, Business Insurance · since 2016
Runs the largest segment, since Jun 2016.
Michael F. Klein
President, Personal Insurance
Runs car and home insurance.
Jeffrey P. Klenk
President, Bond & Specialty Insurance
Runs management liability and surety.
What they said, and what happened
1 delivered · 1 too early to tell
Said on Oct 16, 2025
Travelers said on Oct 16, 2025 that it had agreed on May 27, 2025 to sell its Canadian personal and most of its commercial insurance business to Definity Financial for about US$2.4 billion.
DeliveredWhat happened
The sale closed on Jan 2, 2026, with proceeds of $2,384 million in the Q1 FY2026 cash flow statement; Travelers kept its Canadian surety business.
Said on Feb 12, 2026
In the FY2025 10-K, Travelers said it expects after-tax income from its fixed income portfolio of about $800 million in Q1 2026, rising to about $870 million in Q4 2026.
Too early to tellWhat happened
In the Q3 FY2026 10-Q it put the Q4 2026 figure at about $875 million. Q4 FY2026 results are not out yet.
08What could go wrong
What could go wrong for Travelers?
- Other
Catastrophes
Natural and other disasters cost Travelers $2,266 million before tax in Q1 FY2025, when net income fell to $395 million. Catastrophe losses rose every year from FY2021 to FY2025.
Watch Catastrophe losses in each quarterly release; Q2 has carried about 37% of annual catastrophe losses over ten years, the company says.
- Legal
Reserves for old and emerging claims
Travelers added $295 million to asbestos reserves in Q3 FY2026. Its 10-K says more aggressive attorney involvement in claims continues to affect the combined ratio.
Watch Prior-year reserve development and asbestos charges in each quarter.
- Other
Interest rates and the bond portfolio
Pre-tax net unrealized investment losses were $8,049 million at Sep 30, 2026, up from $1,862 million at Dec 31, 2025. Shareholders' equity fell to $28,995 million from $32,894 million.
Watch Net unrealized investment losses and book value per share each quarter.
- Competition
Competition for each policy
Independent agents offer rival policies and use comparison tools that quote many insurers at once. In its Q3 FY2026 10-Q (Oct 16, 2026), Travelers said it expects new-business conditions to stay competitive.
Watch Retention and renewal premium change in each earnings release.
- Regulation
State rate approvals and dividend limits
Each US state regulates the rates Travelers can charge. State rules also limit dividends its insurance companies can pay to the parent without approval.
Watch Rate approvals in large states such as California, which was 10.6% of FY2025 direct written premiums.
09Supporters vs. critics
What do supporters and critics point to?
What supporters point to
- Travelers' combined ratio improved from 97.0 in FY2023 to 89.9 in FY2025, and net income rose from $2,991 million to $6,288 million.
- Net investment income was $1,098 million in Q3 FY2026, against $1,033 million in Q3 FY2025, and the book yield on its bonds rose to 4.02% from 3.86% at Dec 31, 2025.
- As of Feb 12, 2026, A.M. Best rated Travelers' main insurance companies A++, its top grade, the FY2025 10-K states.
- The dividend per share rose every year from $3.49 in FY2021 to $4.35 in FY2025, and Travelers bought back 14.3 million shares for $4,600 million under its board authorization in the first nine months of FY2026, the Q3 FY2026 financial supplement states.
What critics point to
- Catastrophe losses rose every year from FY2021 to FY2025, reaching $3,690 million; in Q1 FY2025 they were $2,266 million and net income fell to $395 million.
- Pre-tax net unrealized investment losses were $8,049 million at Sep 30, 2026, up from $1,862 million at Dec 31, 2025, and shareholders' equity fell to $28,995 million from $32,894 million.
- Travelers added $295 million to asbestos reserves in Q3 FY2026, and its FY2025 10-K says more aggressive attorney involvement in claims continues to affect the combined ratio.
- Auto policies in force in Personal Insurance fell from 3,050 thousand at Sep 30, 2025 to 2,769 thousand at Sep 30, 2026, and total company net written premiums grew 2% excluding Canada in Q3 FY2026.
10What to watch next
What should you watch next at Travelers?
Next event
Q4 FY2026 results
Date not announced yet.
Catastrophe losses
Catastrophes cost Travelers $538 million in Q3 FY2026 and $2,266 million in Q1 FY2025, the quarter net income fell to $395 million.
Unrealized losses and book value
Pre-tax net unrealized investment losses were $8,049 million at Sep 30, 2026. Book value per share was $141.48, or $172.47 on the company's adjusted basis, which excludes those losses.
Investment income against the company's estimate
In its Q3 FY2026 10-Q, filed Oct 16, 2026, Travelers said it expects about $875 million of after-tax income from its fixed income portfolio in Q4 2026.
11Key facts
Key facts about Travelers
- What does Travelers do?
- The Travelers Companies, Inc. sells property and casualty insurance, mainly to US businesses and households, through independent agents and brokers. It reported revenue of $48,828 million in FY2025.
- How does Travelers make money?
- Travelers earns from pricing policies above claims and costs, and from investing premiums before claims are paid. In FY2025 it reported a combined ratio of 89.9, a pre-tax underwriting gain of $4,265 million and net investment income of $3,959 million.
- Who are Travelers' customers?
- In FY2025, businesses and other organizations paid 51% of Travelers' $43,914 million of premiums earned, individuals and families 39.6% and buyers of Bond & Specialty coverage 9.4% (Cityfort calculation from the FY2025 10-K).
- How big is Travelers?
- Travelers reported revenue of $48,828 million and net income of $6,288 million in FY2025, up from $46,423 million and $4,999 million in FY2024.
- What is Travelers' largest business?
- Business Insurance, which covers companies of all sizes, was Travelers' largest segment in FY2025, with revenue of $26,018 million and segment income after tax of $3,695 million.
- Where does Travelers sell insurance?
- Travelers wrote 95.2% of its FY2025 direct written premiums in the US. California was the largest state at 10.6%, followed by Texas and New York at 8.3% each.
- Who owns Travelers?
- Travelers has one class of common stock and no controlling holder. Its 2026 proxy lists Vanguard at 10.43%, BlackRock at 8.10% and State Street at 7.44%, each from its latest Schedule 13GA filing by anyone who owns more than 5% of a company's shares and does not seek control. Learn more. Directors and executive officers as a group owned about 1.38%.
Terms on this page
Each explains the term in plain English, with the same number from other companies on Cityfort.
Go deeper
More detail from the same filings. Open any section.
12What it sells
12What it sells
What does Travelers sell?
Business Insurance
Workers' compensation, commercial auto, property, general liability and package policies for small, mid-sized and large companies. It was $22,412 million of FY2025 premiums earned.
Bond & Specialty Insurance
Management liability coverage, which protects directors and officers from lawsuits, and surety bonds, which guarantee a contractor finishes a job. It was $4,107 million of FY2025 premiums earned.
Personal Insurance
Car and home insurance for individuals, sold through independent agents and brokers. It was $17,395 million of FY2025 premiums earned.
International
Business in the UK, Ireland and at Lloyd's of London through Syndicate 5000, where Travelers provides all the capital. It owns 49.5% of Junto, a surety insurer in Brazil.
What it does
- Does: Collects premiums up front and pays claims later, sometimes years later
- Does: Invests the money in between, mostly in bonds: $89.4 billion at Sep 30, 2026
- Does: Sells mainly through independent agents and brokers
What it does not do
- Does not: Keep all of its own risk: it buys reinsurance to cover part of large losses
- Does not: Sell personal or most commercial insurance in Canada: it sold those businesses on Jan 2, 2026, keeping surety
- Does not: Sell mostly outside the US: 95.2% of FY2025 direct written premiums were domestic
13How the money flows
13How the money flows · FY2025
How does money flow through Travelers?
Money in
- Insurance premiums earned$43.9B
- Net investment income$4.0B
- Fee income and other revenues$1.0B
The company
Travelers
$48.9B came in
Money out
- Claims and claim adjustment expenses$27.2B
- Commissions and other policy acquisition costs (amortized)$7.3B
- General and administrative expenses$6.1B
- Interest expense and net realized investment losses$473M
- Income tax$1.5B
- Net income$6.3B
- Businesses and households pay premiums for policies; Travelers counts them as revenue over each policy term.
- It invests the money until claims are paid, mostly in bonds, and earned $3,959 million of investment income in FY2025.
- Claims and the cost of settling them took $27,221 million, the largest share.
- Agent commissions, running costs, interest and tax took most of the rest.
- What was left was net income: $6,288 million in FY2025.
Sources (1)
14What it needs to run
14What it needs to run
What does Travelers need to run?
Capital and ratings
Agents and buyers look at an insurer's ability to pay. A.M. Best rated Travelers' main insurance companies A++, its top grade of 16, as of Feb 12, 2026.
Claims staff
About 12,300 of its roughly 34,000 employees worked in Claims Services at Dec 31, 2025, handling and settling claims.
Independent agents and brokers
Most policies are sold by agents and brokers who also offer other insurers' policies, so Travelers competes for each sale.
Reinsurance
Travelers buys insurance for itself against big events. For example, its Northeast catastrophe treaty renewed on Jul 1, 2026 gives up to $1.00 billion of coverage above $2.75 billion of losses.
Sources (2)
15Where it sells
15Where it sells · FY2025
Where does Travelers sell?
- California10.6%
- Texas8.3%
- New York8.3%
- Pennsylvania4.2%
- Florida4.1%
- Illinois3.8%
- New Jersey3.7%
- Georgia3.7%
- Massachusetts3.3%
- All other US states45.2%
- Outside the US (100% minus 95.2% domestic; Cityfort calculation from the FY2025 10-K)4.8%
Sources (1)
16Where growth could come from
16Where growth could come from
Where could Travelers' growth come from?
In its Q3 FY2026 10-Q, filed Oct 16, 2026, Travelers said it expects after-tax income from its fixed income portfolio of about $875 million in Q4 2026, growing to about $965 million in Q4 2027. It also said it expects retention to stay strong and new business to stay competitive.
Business Insurance pricing
WorkingRenewal premium change 4.1%, retention 86%, Q3 FY2026
Travelers reported $699 million of new business in Business Insurance in Q3 FY2026, up 4%, which it called a third-quarter record.
Status: Working, on track against what the company said.
Investment income
Working$1,033M → $1,098M, Q3 FY2025 to Q3 FY2026
The book yield on its bonds was 4.02% at Sep 30, 2026, against 3.86% at Dec 31, 2025.
Status: Working, on track against what the company said.
Bond & Specialty growth
WorkingSurety premiums +21%, Q3 FY2026
Management liability new business rose 18% and retention was 89% in Q3 FY2026, the company reported.
Status: Working, on track against what the company said.
Personal Insurance policy count
MixedAuto policies 3,050k → 2,769k, Sep 2025 to Sep 2026
The count fell most in Q1 FY2026, when the Canadian sale closed; the supplement does not split out Canada. The combined ratio was 83.5 in Q3 FY2026.
Status: Mixed, partly on track.
Premium growth after Canada
MixedNet written premiums +2% ex-Canada, Q3 FY2026
Reported net written premiums include Canada in 2025 ($240 million in Q3 FY2025) but not in 2026, the company says.
Status: Mixed, partly on track.
Status compares progress with what the company itself said it would do: Working = on track against what the company said; Mixed = partly on track; Behind = behind the company's own plan; New = recently announced; Early = too early to judge.
17The company's own measures (non-GAAP)
17The company's own measures · FY2025
What do Travelers' own measures show?
Official (GAAP): Income before income taxes, FY2025
$7.8B
Company's own measure: Underwriting gain, FY2025 (pre-tax)
$4.3B
Premiums earned and fee income minus claims, claim adjustment and insurance-related expenses, as Travelers defines it. It leaves out investment income and interest.
Official (GAAP): Combined ratio, FY2025
89.9%
Company's own measure: Underlying combined ratio, FY2025
83.9%
The combined ratio without catastrophe losses and prior-year reserve changes, as the company reports it. Catastrophes added 8.4 points in FY2025.
These are the company's own measures, defined by the company. They are not comparable across companies, and they are not added together. Each sits beside the nearest official (GAAP) figure.
Learn: Non-GAAP measures: what a company's "adjusted" numbers leave out
18Financial strength: investments, debt, capital
18Financial strength · Sep 30, 2026
How strong is Travelers' balance sheet?
What the premiums are invested in
- Bonds (fixed maturities)$89.4B
88.8% of the investments listed
- Short-term securities$5.6B
5.5% of the investments listed
- Other investments$4.1B
4.1% of the investments listed
- Real estate$883M
0.9% of the investments listed
- Equity securities (stocks)$640M
0.6% of the investments listed
Shares of the portfolio: Cityfort calculation from the Q3 FY2026 10-Q, each type ÷ the total listed.
- Book value per share
- $151.21
- shareholders' equity per share at the end of FY2025, as reported
- Return on equity
- 21.0%
- net income as % of average shareholders' equity, as reported
- Investments
- $100.6B
- money held in bonds, stocks and cash until claims are paid
- Debt
- $9.8B
- borrowings on the balance sheet
- Shareholders' equity
- $29.0B
- what the company owns minus what it owes
- Debt to capital
- 25.3%
- debt ÷ (debt + equity), as reported by the company
Travelers reported statutory capital and surplus of $31,596 million at Sep 30, 2026. It put debt-to-capital at 21.7% excluding after-tax net unrealized investment losses, within its target range of 15% to 25%.
Figures at Sep 30, 2026, consolidated, as reported by the company in its 10-K and earnings release; see the dates on each source.
19Who owns it
19Who owns it · ownership as of Mar 23, 2026
Who owns Travelers?
- Officers and directors (as a group), shares
- 1.4%
Share classes
Holders of 5% or more
From the company's proxy statement (DEF 14A), later Schedule 13G filings and the share counts on its latest annual or quarterly report. Each holder row shows the date of its own filing.
Learn: How to read a proxy statement (DEF 14A): Nvidia's 2026 proxy · Form 4 insider filings: who files, the codes and the footnotes
20What it does with profit
20What it does with profit
What does Travelers do with its profit?
Dividend per share
$4.35FY2025
Dividend paid for each share, by financial year.
$ per share
See the numbers
Buyback · Sep 30, 2026
Shares bought back under the authorization in the first nine months of FY2026: 14.3 million shares for $4,600 million, as Travelers reports it in its Q3 FY2026 financial supplement.
$4.6B
Buyback · Dec 31, 2025
Shares bought back under the authorization in FY2025: 10.9 million shares for $3,025 million, as Travelers reports it in its Q4 FY2025 financial supplement.
$3.0B
Money raised · Jul 24, 2026
Issued $750 million of 4.95% senior notes due Jul 24, 2031; $200 million of 7.75% notes were repaid on Apr 15, 2026.
$750M
21Governance signals
21Governance signals
What do Travelers' governance filings show?
- Auditor
- KPMG LLP, since 1994
- Auditor changes
- None in the period covered
- Audit qualifications
- None reported
- Related-party dealings
- The 2026 proxy lists ordinary-course dealings with large holders: in 2025 BlackRock paid about $1.94 million and Fidelity about $1.40 million in premiums for Travelers policies, and Travelers paid a BlackRock unit about $325,800 for a software license.
- Credit rating
- A.M. Best, Moody's, S&P and Fitch (as stated in the FY2025 10-K) Main insurance companies (claims-paying): A++ (A.M. Best), Aa2 (Moody's), AA (S&P), AA (Fitch); senior debt: a+, A2, A, A (outlook Stable for A.M. Best (affirmed Aug 21, 2026), Moody's (affirmed Apr 24, 2026) and Fitch (affirmed Oct 24, 2025); not stated for S&P), Feb 12, 2026
A credit rating describes the company's ability to repay debt. It is not a rating of the share.
22How it got here
22How it got here
How did Travelers get here?
1853
Milestone
Roots in 1853
The 10-K calls Travelers one of the oldest US insurance organizations, dating back to 1853.
2015
Milestone
Alan Schnitzer becomes CEO
He became CEO in Dec 2015 and Chairman in Aug 2017.
2023
Crisis
Personal Insurance loses money
Personal Insurance had a combined ratio of 104.8 and a $128 million loss after tax; its catastrophe losses were $2,116 million (company total $2,991 million).
2025
Business-model change
Agrees to sell most of Canada
On May 27, 2025 it agreed to sell its Canadian personal and most commercial business to Definity Financial for about US$2.4 billion.
2025
Milestone
Net income of $6,288 million
FY2025 net income rose from $4,999 million in FY2024, with a combined ratio of 89.9.
2026
Business-model change
Canada sale closes, buybacks expand
The sale closed on Jan 2, 2026. On Jan 21, 2026 the board added $5.0 billion of buyback authority.
23Sources and changes
Where every number on this page comes from
Sources (21 documents)
- S1Form 10-Q for Q3 FY2026 · SEC EDGAR · Tier 1: company or exchange filing · Oct 16, 2026
- S2Form 10-Q for Q2 FY2026 · SEC EDGAR · Tier 1: company or exchange filing · Jul 17, 2026
- S3Form 10-Q for Q1 FY2026 · SEC EDGAR · Tier 1: company or exchange filing · Apr 16, 2026
- S4Form 10-K for FY2025 · SEC EDGAR · Tier 1: company or exchange filing · Feb 12, 2026
- S5Form 10-Q for Q3 FY2025 · SEC EDGAR · Tier 1: company or exchange filing · Oct 16, 2025
- S6Form 10-Q for Q2 FY2025 · SEC EDGAR · Tier 1: company or exchange filing · Jul 17, 2025
- S7Form 10-Q for Q1 FY2025 · SEC EDGAR · Tier 1: company or exchange filing · Apr 16, 2025
- S8Form 10-K for FY2024 · SEC EDGAR · Tier 1: company or exchange filing · Feb 13, 2025
- S9Form 10-Q for Q3 FY2024 · SEC EDGAR · Tier 1: company or exchange filing · Oct 17, 2024
- S10Form 10-Q for Q2 FY2024 · SEC EDGAR · Tier 1: company or exchange filing · Jul 19, 2024
- S11Form 10-Q for Q1 FY2024 · SEC EDGAR · Tier 1: company or exchange filing · Apr 17, 2024
- S12Form 10-K for FY2023 · SEC EDGAR · Tier 1: company or exchange filing · Feb 15, 2024
- S13Form 10-K for FY2022 · SEC EDGAR · Tier 1: company or exchange filing · Feb 16, 2023
- S14Form 10-K for FY2021 · SEC EDGAR · Tier 1: company or exchange filing · Feb 17, 2022
- S152026 proxy statement (DEF 14A) · SEC EDGAR · Tier 1: company or exchange filing · Apr 7, 2026
- S16Q3 FY2026 earnings release (8-K Ex. 99.1) · SEC EDGAR · Tier 1: company or exchange filing · Oct 16, 2026
- S17Q3 FY2026 financial supplement (8-K Ex. 99.2) · SEC EDGAR · Tier 1: company or exchange filing · Oct 16, 2026
- S18Q4 FY2025 earnings release (8-K Ex. 99.1) · SEC EDGAR · Tier 1: company or exchange filing · Jan 21, 2026
- S19Q4 FY2025 financial supplement (8-K Ex. 99.2) · SEC EDGAR · Tier 1: company or exchange filing · Jan 21, 2026
- S20Q4 FY2024 earnings release (8-K Ex. 99.1) · SEC EDGAR · Tier 1: company or exchange filing · Jan 22, 2025
- S21Q4 FY2024 financial supplement (8-K Ex. 99.2) · SEC EDGAR · Tier 1: company or exchange filing · Jan 22, 2025
Changes to this page (v1 · Nov 20, 2026)
- v1 · Nov 20, 2026First version. (first version)
Numbers come only from tier 1 and tier 2 sources. Read how we research.
Disclaimer
For learning only. Cityfort is not a registered investment adviser or broker-dealer and does not recommend buying or selling any security. Prices shown are dated and may be out of date.
Investing in securities involves risk, including loss of capital. Before making any investment decision, do your own research and consider consulting a registered investment adviser or other qualified professional.
Cityfort, its owners and contributors may or may not hold securities of companies covered. Cityfort is not paid by any company it covers. Content is not an offer or solicitation to buy or sell any security, including in any initial public offering.
Read the positions policyRead the full disclaimerHide the full disclaimer
Cityfort publishes general educational content that explains how listed companies work. Cityfort is not registered with the US Securities and Exchange Commission or any state securities regulator as an investment adviser, and is not a broker-dealer or a member of FINRA. Cityfort does not provide investment, tax or legal advice, recommendations, ratings, price targets or any opinion on whether to buy, sell or hold any security. Nothing on the site is tailored to any person's circumstances.
All information is taken from publicly available sources, mainly company filings with the SEC, which are listed on each page with dates. We work to keep it accurate and correct errors publicly, but we do not guarantee that it is complete, accurate or up to date. Any market price or price-based ratio shown is dated, may be out of date by the time you read it, and is included only to explain concepts.
Statements by company management, including forward-looking statements and guidance, are reported as the company's statements, with their date and source; they are not our forecasts. Adjusted (non-GAAP) figures are the company's own measures and are shown next to the official (GAAP) figures.