Technology · NYSE: TOST
Toast: how the business works
Toast sells restaurants the software, card payment processing and devices to run their business, with $6,153 million of revenue in FY2025.
By Hardik Bhandare · Checked against filings: . Editorial policy. Corrections
Follow Toast
Email me when Toast's page is updated after earnings.
We'll send a confirmation email first. See our privacy policy.
Toast, Inc. · Boston, Massachusetts · Founded 2011
Updated for Q3 FY2026 · checked
- Revenue, FY2025
- $6.15B
- Net income, FY2025
- $342M
- Locations using Toast, Sep 30, 2026
- ~189,000
- Employees, Dec 31, 2025
- ~6,500
- Officers' and directors' share of votes, Mar 31, 2026
- 40.6%
The short version
Toast in 5 points
1 · What it sells
Toast sells restaurants a cloud system for the point of sale, kitchen screens, online ordering and payroll, processes their card payments and sells the terminals, with revenue of $6,153 million in FY2025.
2 · Who pays it
In FY2025, restaurants paying on card sales and Toast Capital loans brought in 81.9% of revenue, monthly software fees 15.2%, and devices and setup 2.9%.
3 · What it keeps from $100
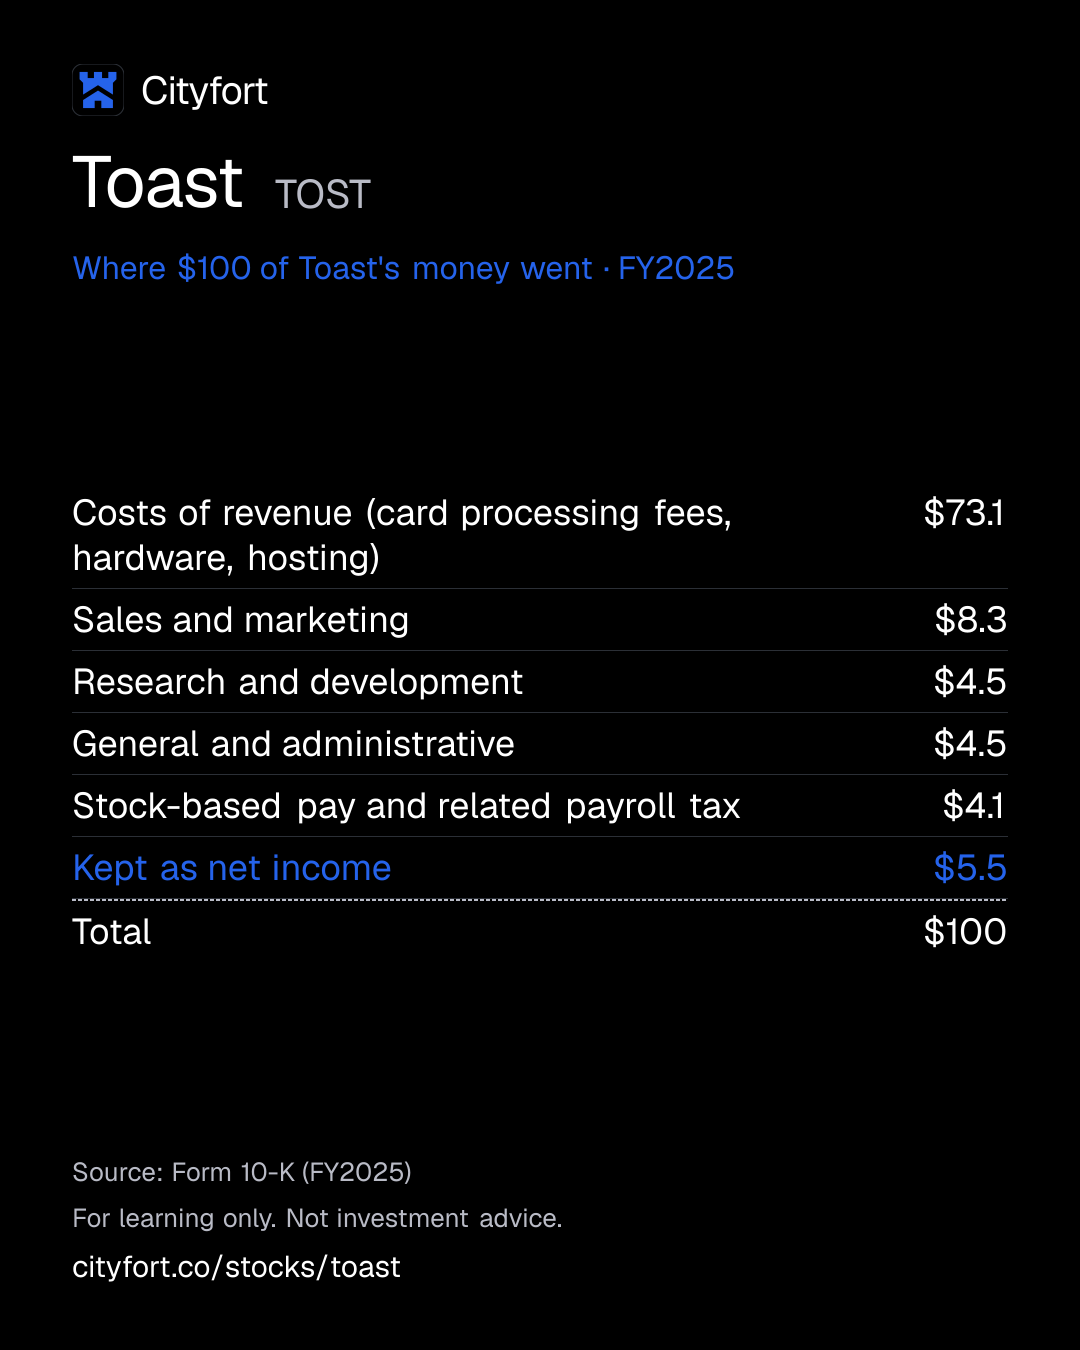
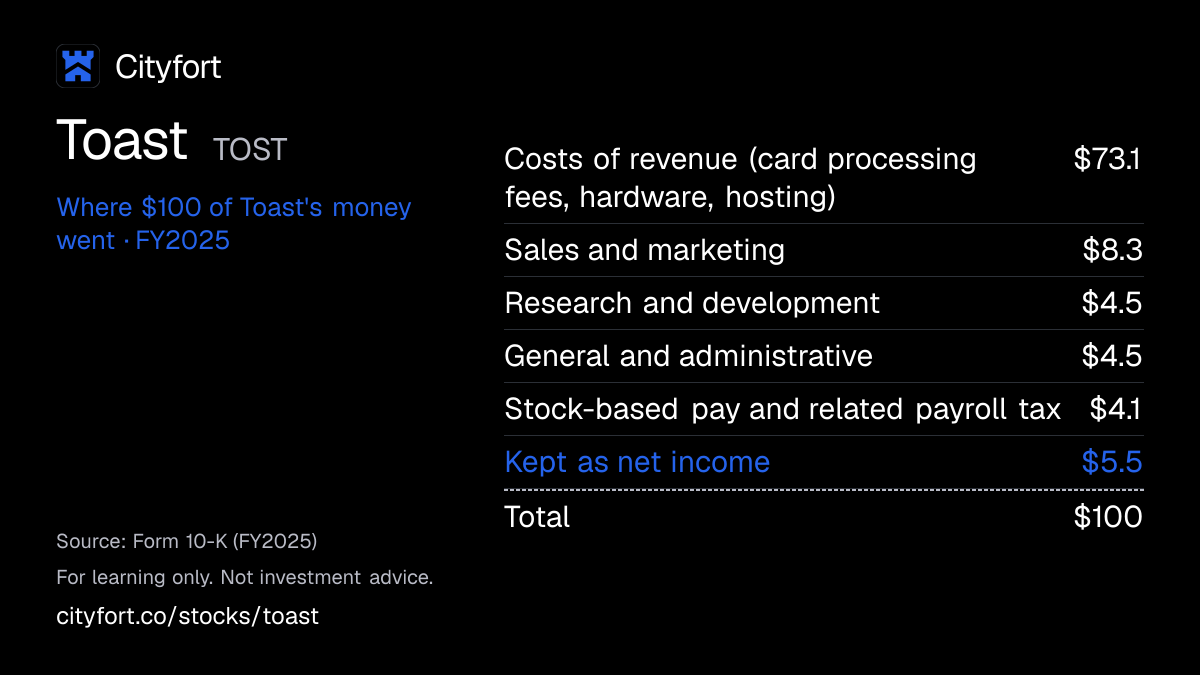
Of every $100 that came in during FY2025, $73.1 went on costs of revenue such as card processing fees, and $5.5 was kept as net income, which includes interest on its cash; GAAP income from operations was $292 million.
4 · Where the operating profit comes from
Toast reports one segment; in FY2025 payments kept $1,146 million of gross profit and subscriptions $672 million, while hardware and installation cost $400 million to deliver against $180 million of revenue.
5 · The one thing to watch
About 189,000 locations used Toast at Sep 30, 2026, up 21%, and gross payment volume was $61.8 billion in Q3 FY2026, up 20%.
Sources: From Toast's FY2025 10-K, Q3 FY2026 10-Q and the Q4 2025 (Feb 12, 2026) and Q3 2026 (Nov 3, 2026) earnings releases · checked
01Where the money goes · FY2025
Where does $100 of Toast's money go?
Toast · FY2025
Receipt for every $100
| Costs of revenue (card processing fees, hardware, hosting) | $73.1 |
|---|---|
| Sales and marketing | $8.3 |
| Research and development | $4.5 |
| General and administrative | $4.5 |
| Stock-based pay and related payroll tax | $4.1 |
| Kept as net income | $5.5 |
| Total | $100 |
Each line = amount ÷ total money in × 100. Lines may not add to exactly $100 because of rounding.
How this is worked out
Cityfort calculation from the FY2025 10-K. Of every $100 that came in during FY2025 (revenue plus $38 million of interest income and other items, net): each line = line ÷ $6,191 million × 100, rounded so the lines add to $100. The 10-K shows stock-based pay as its own line, so the other cost lines exclude it.
Save this receipt as an image
Embed this receipt or the key numbers
Paste this code into a blog or website to show the card you choose, with a link back to this page.
Each week: the next company due to report earnings, explained in 5 points.
No tips. Unsubscribe anytime.
We'll send a confirmation email. See our privacy policy.
02The business in one line
What does Toast do?
Restaurants pay Toast a cut of every card payment their guests make, plus monthly software fees; most of that money goes on card network and processing fees, and $5.5 of every $100 was left as net income in FY2025.
- Payments brought in 81.9% of FY2025 revenue, software subscriptions 15.2%, and devices and setup 2.9%.
- Costs of revenue, such as card processing fees, hardware and hosting, took $73.1 of every $100 that came in during FY2025.
03Who pays it
Who pays Toast?
Restaurants paying on card sales
81.9%
of revenue
A percentage of each card payment plus a per-transaction fee, and fees on Toast Capital loans (financial technology solutions revenue, $5,037 million in FY2025).
Restaurants paying monthly software fees
15.2%
of revenue
Subscription fees per location, which depend on the products, hardware and number of employees ($936 million in FY2025).
Restaurants buying devices and setup
2.9%
of revenue
Hardware and installation services ($180 million in FY2025).
- Restaurants paying on card sales81.9%
- Restaurants paying monthly software fees15.2%
- Restaurants buying devices and setup2.9%
How spread out the customers are
No single customer was 10% or more of revenue in FY2023, FY2024 or FY2025. Toast had about 164,000 restaurant and retail locations at Dec 31, 2025, and the 10-K says most customers are small and mid-sized businesses. Revenue shares are a Cityfort calculation from the FY2025 10-K.
04How it makes money
How does Toast make money?
Devices and setup cost Toast more than it charges; software and payments carry the profit
In FY2025 hardware and installation brought in $180 million and cost $400 million to deliver. Subscriptions kept $672 million of $936 million after direct costs, and payments kept $1,146 million of $5,037 million. Revenue minus costs of revenue (before stock-based payPay given as shares instead of cash, which spreads ownership more thinly. Learn more) grew 32% in FY2025 while sales, product and admin costs grew 17% (Cityfort calculations from the FY2025 and FY2024 10-Ks).
Net income per $100 of revenue
−$28.6$5.6
FY2021 to FY2025
- A restaurant buys terminals and setup
- It signs a 12 to 36 month software subscription per location
- Every card payment runs through Toast, which keeps a percentage
- Locations and payment volume grow ($195.1 billion processed in FY2025)
- Gross profit grows faster than selling and admin costs
↺ Step 5 feeds back into step 1.
05Business segments · FY2025
Which businesses make up Toast?
Financial technology solutions
81.9%Card payment processing and Toast Capital fees. Toast reports one business segment; this and the next two rows are its revenue lines.
Revenue $5.0B ($5,037M)
Subscription services
15.2%Monthly software fees per location.
Revenue $936M
Hardware and professional services
2.9%Terminals and installation, which cost $400 million to deliver in FY2025.
Revenue $180M
How the mix changed
- Financial technology solutions
- Subscription services
- Hardware and professional services
Revenue by segment, FY2021 to FY2025.
US$
See the numbers
06The numbers · Consolidated · US$
How has Toast done?
Revenue
$6.2BFY2025
Revenue rose every year, from $1,705 million in FY2021 to $6,153 million in FY2025, and payment processing made up $5,037 million of FY2025.
US$
See the numbers
Net income
$342MFY2025
Toast had net losses in FY2021 to FY2023, earned $19 million in FY2024 and $342 million in FY2025, after $242 million of stock-based pay that year.
US$
See the numbers
Net income for every $100 of revenue
$5.6FY2025
Toast kept $5.6 of net income per $100 of revenue in FY2025, against a loss of $28.6 per $100 in FY2021.
Net margin: $ of net income per $100 of revenue
See the numbers
Free cash flow
$608MFY2025
Free cash flow (operating cash flow minus capital expenditures) was $608 million in FY2025, up from $306 million in FY2024, after negative years in FY2021 and FY2022.
US$ · cash from operations minus spending on plants and equipment
See the numbers
See all yearly numbers
EBITDA here = operating income plus depreciation and amortization (from the cash flow statement). Fiscal years are the company's own: Fiscal year ends Dec 31. Net income is the share belonging to the company's owners.
Learn: Fiscal years that don't end in December: Nvidia's FY2027 explained · Stock-based compensation and dilution: pay that becomes shares
Sources (22)
- Form 10-K for FY2021
- Form 10-K for FY2022
- Form 10-K for FY2023
- Form 10-K for FY2024
- Form 10-K for FY2025
- Form 10-Q for Q1 FY2024
- Q1 2025 earnings release (Form 8-K, Exhibit 99.1)
- Form 10-Q for Q2 FY2024
- Q2 2025 earnings release (Form 8-K, Exhibit 99.1)
- Form 10-Q for Q3 FY2024
- Q3 2025 earnings release (Form 8-K, Exhibit 99.1)
- Q4 2024 earnings release (Form 8-K, Exhibit 99.1)
- Form 10-Q for Q1 FY2025
- Form 10-Q for Q2 FY2025
- Form 10-Q for Q3 FY2025
- Q4 2025 earnings release (Form 8-K, Exhibit 99.1)
- Form 10-Q for Q1 FY2026
- Q1 2026 earnings release (Form 8-K, Exhibit 99.1)
- Form 10-Q for Q2 FY2026
- Q2 2026 earnings release (Form 8-K, Exhibit 99.1)
- Form 10-Q for Q3 FY2026
- Q3 2026 earnings release (Form 8-K, Exhibit 99.1)
07Who runs it
Who runs Toast, and did they deliver?
Aman Narang
Chief Executive Officer, co-founder and director · since 2024
CEO since January 2024; co-president from December 2012 to December 2023.
Stephen Fredette
President, co-founder and director · since 2024
President since January 2024; CEO from December 2011 to February 2015, then co-president from December 2015 to December 2023.
Elena Gomez
President and Chief Financial Officer · since 2021
CFO since May 2021. Steps away at the end of 2026 and stays as a non-executive adviser until Jul 2, 2027.
Michael Senno
Chief Financial Officer from Jan 1, 2027 · since 2027
Senior vice president of finance before the change, per the Q3 2026 release.
Mark Hawkins
Chair of the board · since 2024
Chair since January 2024 and a director since April 2020; former President and CFO of Salesforce.
What they said, and what happened
3 delivered · 1 too early to tell
Said on Feb 12, 2026
Toast said it expected Q1 2026 Adjusted EBITDAOperating profit before wear-and-tear charges (depreciation and amortization). As a margin: per $100 of sales. of $160 to $170 million.
DeliveredWhat happened
Reported $179 million.
Said on May 7, 2026
Toast said it expected Q2 2026 Adjusted EBITDA of $185 to $195 million.
DeliveredWhat happened
Reported $221 million, which included about $10 million of one-time tariff refunds.
Said on Aug 4, 2026
Toast said it expected Q3 2026 Adjusted EBITDA of $210 to $220 million and non-GAAPThe company's own "adjusted" numbers, not the official (GAAP) ones. Always read them next to the official figure. Learn more subscription and fintech gross profit of $615 to $625 million.
DeliveredWhat happened
Reported $240 million and $642 million.
Said on Feb 12, 2026
Toast said it expected FY2026 Adjusted EBITDA of $775 to $795 million.
Too early to tellWhat happened
Raised to $840 to $850 million on Nov 3, 2026; nine-month Adjusted EBITDA was $640 million.
08What could go wrong
What could go wrong for Toast?
- Competition
Intense competition
The 10-K calls its markets intensely competitive, with cloud point-of-sale rivals, older payment providers and single-purpose tools all selling to restaurants.
Watch Net new locations each quarter (about 8,500 in Q3 2026).
- Concentration
Most revenue is low-margin payments
Payments were 81.9% of FY2025 revenue (Cityfort calculation from the FY2025 10-K) but kept $1,146 million of $5,037 million after direct costs, against $672 million of $936 million for subscriptions (Q4 2025 release). Toast also relies on third-party processors to settle those payments.
Watch Payments revenue and gross profit in each earnings release.
- Demand
Small restaurants and the economy
Most customers are small and mid-sized businesses, which the 10-K says are harder to keep and more exposed to economic swings. Weaker restaurant spending would cut payment volume.
Watch Gross payment volume growth ($61.8 billion in Q3 2026, +20%).
- Legal
FTC and state lawsuit
A complaint filed Oct 29, 2026 alleges that Toast violated the FTC Act, the Restore Online Shoppers' Confidence Act and state laws, and seeks an injunction, money and civil penalties. Toast disputes it.
Watch Court filings and the Legal Proceedings note in each 10-Q.
- Governance
Founders control the vote
Class B shares carry 10 votes each. Officers and directors held 40.6% of the votes on Mar 31, 2026, so Class A holders have limited say until Class B converts, by Sep 24, 2028 at the latest.
Watch Class B share count on each 10-Q cover (62 million on Oct 30, 2026).
- Execution
Hardware supply
Third parties make Toast's devices, and it lacks long-term agreements with all of them. It had $191 million of purchase obligations to hardware suppliers at Sep 30, 2026.
Watch Hardware and professional services gross loss in each release.
09Supporters vs. critics
What do supporters and critics point to?
What supporters point to
- Revenue rose every year, from $1,705 million in FY2021 to $6,153 million in FY2025.
- Toast moved from net losses in FY2021 to FY2023 to net income of $342 million in FY2025 and $169 million in Q3 FY2026.
- About 189,000 locations used Toast at Sep 30, 2026, up 21%, and gross payment volume was $61.8 billion in Q3 FY2026, up 20%.
- Toast had no borrowings at Sep 30, 2026 and held $1,885 million of cash and marketable securities.
- Reported Adjusted EBITDA was above the range Toast had given for each of Q1, Q2 and Q3 2026.
What critics point to
- Payments were 81.9% of FY2025 revenue but kept $1,146 million of $5,037 million after direct costs.
- Hardware and installation cost $400 million to deliver in FY2025 against $180 million of revenue.
- Stock-based pay was $242 million in FY2025, against net income of $342 million.
- The FTC, seven states and two California local governments sued Toast on Oct 29, 2026, alleging violations of the FTC Act and the Restore Online Shoppers' Confidence Act; Toast says it strongly disagrees.
- Class B shares carry 10 votes each, and officers and directors held 40.6% of the votes on Mar 31, 2026.
10What to watch next
What should you watch next at Toast?
Next event
Q4 FY2026 results
Date not announced yet.
The FTC lawsuit
The complaint filed Oct 29, 2026 seeks an injunction, monetary relief and civil penalties; Toast says it will vigorously defend its interests. Court filings and each 10-Q's Legal Proceedings note will show its progress.
FY2026 Adjusted EBITDA against Toast's range
Toast said on Nov 3, 2026 that it expects FY2026 Adjusted EBITDA of $840 to $850 million; nine-month Adjusted EBITDA was $640 million.
Location and payment growth
Toast added about 8,500 net locations in Q3 2026, and gross payment volume was $61.8 billion, up 20%.
A new CFO
Elena Gomez hands the CFO role to Michael Senno on Jan 1, 2027, per the Q3 2026 earnings release.
11Key dates
What are the key dates for Toast?
| Event | Date | Source |
|---|---|---|
| Elena Gomez hands the CFO role to Michael Senno | Q3 2026 earnings release (Form 8-K, Exhibit 99.1) | |
| Latest date for all Class B shares to convert to Class AEarlier if holders of two-thirds of Class B shares elect it. | Form 10-K for FY2025 | |
| Revolving credit facility ($350 million, undrawn) matures | Form 10-K for FY2025 |
Learn: Dual-class shares: when votes and ownership don't match
12Key facts
Key facts about Toast
- What does Toast do?
- Toast, Inc. sells restaurants a cloud system for the point of sale, kitchen screens, online ordering, payroll and card payments, plus the terminals it runs on. About 189,000 restaurant and retail locations used Toast at Sep 30, 2026.
- How does Toast make money?
- Toast makes most of its money by processing card payments: financial technology solutions brought in $5,037 million, or 81.9% of Toast's $6,153 million of revenue in FY2025. Subscription fees were $936 million and hardware and professional services $180 million.
- Who are Toast's customers?
- Toast's customers are restaurants and food and drink retailers, mostly small and mid-sized businesses, with about 164,000 locations at Dec 31, 2025. No single customer was 10% or more of Toast's revenue in FY2023, FY2024 or FY2025.
- How big is Toast?
- Toast had revenue of $6,153 million and net income of $342 million in FY2025, up from $4,960 million and $19 million in FY2024. Toast's GAAP income from operations was $292 million in FY2025, and it had about 6,500 employees at Dec 31, 2025.
- Is Toast profitable?
- Toast reported net losses from FY2021 to FY2023, then net income of $19 million in FY2024 and $342 million in FY2025. Toast's net income was $169 million in Q3 FY2026, against $105 million in Q3 FY2025.
- Which part of Toast keeps the most profit?
- In FY2025, Toast's payments business kept $1,146 million of gross profit on $5,037 million of revenue, and subscriptions kept $672 million on $936 million. Toast's hardware and installation brought in $180 million and cost $400 million to deliver.
- Does Toast have debt?
- Toast had no borrowings at Sep 30, 2026 and held $1,885 million of cash and marketable securities. Toast's $350 million revolving credit line, which runs to May 2030, was undrawn at Dec 31, 2025.
- Who owns Toast?
- Toast has two share classes, and Class B shares carry 10 votes each. On Mar 31, 2026 Toast's officers and directors held 40.6% of the votes with about 10% of all shares (a Cityfort calculation from the 2026 proxy statementThe yearly filing about shareholder votes, the board and executive pay. Learn more).
- Does Toast pay a dividend?
- Toast has never paid a cash dividend and said in its FY2025 10-K that it has no current plans to. Toast bought back $107 million of Class A stock in FY2025 and $486 million in the first nine months of 2026.
Terms on this page
- Annual recurring revenue (ARR)
- Capital expenditures (capex)
- Debt-to-equity
- Earnings per share (EPS)
- EBITDA
- Free cash flow
- Net debt
- Net margin
- Remaining performance obligations (RPO)
- Revenue vs net income
Each explains the term in plain English, with the same number from other companies on Cityfort.
Go deeper
More detail from the same filings. Open any section.
13What it sells
13What it sells
What does Toast sell?
Software subscriptions
Monthly fees per restaurant location for the point of sale, kitchen display, online ordering, marketing, payroll and supplier invoices (xtraCHEF), plus the Toast IQ AI assistant. Contracts usually run 12 to 36 months.
Payments and other financial services
Toast processes the card payments guests make and keeps a percentage of each sale plus a per-transaction fee. It also services Toast Capital loans to restaurants, which a third-party bank issues.
Hardware
Restaurant-grade Android terminals, handheld ordering devices and kitchen screens, sold to customers.
Installation and setup
Professional services to install the system and train staff, on site, remotely or through self-service setup.
What it does
- Does: Runs on Amazon Web Services as one shared cloud system for all customers
- Does: Connects to more than 200 partner apps (reservations, accounting, delivery)
- Does: Serves food and drink retailers as well as restaurants
What it does not do
- Does not: Issue Toast Capital loans itself: a third-party bank issues them and Toast services them
- Does not: Earn material revenue outside the US (none in FY2023 to FY2025, per the 10-K)
- Does not: Run restaurants itself
Sources (2)
14How the money flows
14How the money flows · FY2025
How does money flow through Toast?
Money in
- Revenue (payments, subscriptions, hardware and services)$6.2B
- Interest income and other items, net of restructuring and income tax$38M
The company
Toast
$6.2B came in
Money out
- Costs of revenue (card processing fees, hardware, hosting), before stock-based pay$4.5B
- Sales and marketing$511M
- Research and development$280M
- General and administrative$281M
- Stock-based pay and related payroll tax$255M
- Net income$342M
- Customers paid Toast $6,153 million in FY2025, most of it as a share of the card payments their guests made.
- Costs of revenue took $4,522 million: card network and processing fees, hardware and hosting.
- Selling, product development and running the company took $1,072 million, and stock-based pay $255 million more.
- Interest on its cash and other items added a net $38 million, leaving $342 million of net income.
Sources (1)
15What it needs to run
15What it needs to run
What does Toast need to run?
Card payment processors
Toast relies on third-party processors to process and settle the payments guests make; the 10-K lists this among its principal risks.
Hardware makers
Third parties build its terminals, without long-term agreements with all of them. Toast had $191 million of non-cancellable purchase obligations to hardware suppliers at Sep 30, 2026, all due within 12 months.
Cloud computing
The platform runs on Amazon Web Services. Commitments to cloud providers and other vendors were $95 million at Sep 30, 2026.
People
About 6,500 employees at Dec 31, 2025, with significant operations in the US, Ireland and India, and a direct sales force.
Sources (2)
16Where growth could come from
16Where growth could come from
Where could Toast's growth come from?
In its Q3 2026 earnings release of Nov 3, 2026, Toast said it expects FY2026 non-GAAP subscription and financial technology gross profit of $2,375 to $2,385 million (26% growth, up from 23% to 25%). It also expects Adjusted EBITDA of $840 to $850 million (up from $805 to $825 million).
More restaurant locations
Working~189,000 locations, Sep 30, 2026 (+21%)
Toast added about 8,500 net locations in Q3 2026 and a record 30,000 in 2025, by its own count.
Status: Working, on track against what the company said.
More payment volume
Working$61.8 billion in Q3 2026 (+20%)
Gross payment volume is the dollar value of card payments run through Toast; payments revenue was $1,619 million in Q3 2026.
Status: Working, on track against what the company said.
More software per location
WorkingSubscription revenue $317 million in Q3 2026
Up from $244 million in Q3 2025 (a Cityfort calculation of 30% from the two releases). Annualized recurring run-rate reached $2.5 billion (+24%), by Toast's own measure.
Status: Working, on track against what the company said.
Large chains, retail and other countries
Early10,000+ live locations, Q2 2025
Toast said these newer areas passed 10,000 live locations in Q2 2025 and Australia was its fourth international market. Named 2026 wins include BWH Hotels (Best Western) and an expanded TGI Fridays deal in the UK.
Status: Early, too early to judge.
AI tools and new products
New20+ updates in the Fall 2026 release
The Q3 2026 release added Toast IQ Grow features, Toast IQ Team for staff scheduling, and Toast Fuel for independent fuel and convenience stores.
Status: New, recently announced.
Status compares progress with what the company itself said it would do: Working = on track against what the company said; Mixed = partly on track; Behind = behind the company's own plan; New = recently announced; Early = too early to judge.
17The company's own measures (non-GAAP)
17The company's own measures · Q3 FY2026
What do Toast's own measures show?
Official (GAAP): Net income, Q3 FY2026
$169M
Company's own measure: Adjusted EBITDA, Q3 FY2026
$240M
Net income before stock-based pay and its payroll tax, depreciation and amortization, interest income, warrant value changes, restructuring and income tax.
Official (GAAP): Subscription and fintech gross profit, Q3 FY2026
$630M
Company's own measure: Non-GAAP subscription and fintech gross profit, Q3 FY2026
$642M
Toast calls this recurring gross profit. It leaves out stock-based pay, related payroll tax, and depreciation and amortization inside costs of revenue.
Official (GAAP): Cash from operations, Q3 FY2026
$198M
Company's own measure: Free cash flow (Toast's measure), Q3 FY2026
$181M
Cash from operations minus capital expenditures, which Toast defines as equipment purchases plus capitalized software. The page's free cash flowCash from operations minus spending on buildings and equipment. Learn more uses the same line for FY2023–FY2025; FY2021–FY2022 subtract equipment purchases only.
Official (GAAP): Remaining performance obligations, Sep 30, 2026
$1.2B
Company's own measure: Annualized recurring run-rate (ARR), Sep 30, 2026
$2.5B
ARR is 12 times monthly subscription fees plus 4 times the last three months of payment fees, net of estimated processing costs. It is an operating measure, not revenue.
Official (GAAP): Financial technology solutions revenue, Q3 FY2026
$1.6B
Company's own measure: Gross payment volume, Q3 FY2026 ($ million)
61,800 US$ million
The dollar value of card payments processed on Toast's platform in the quarter ($61.8 billion, +20%).
These are the company's own measures, defined by the company. They are not comparable across companies, and they are not added together. Each sits beside the nearest official (GAAP) figure.
Learn: Non-GAAP measures: what a company's "adjusted" numbers leave out · Stock-based compensation and dilution: pay that becomes shares
18Financial strength and debt
18Financial strength · Sep 30, 2026
How much debt does Toast have?
- Total debt$0M
- Cash and investments$1.9B
- Net cash (cash minus debt)$1.9B
- Net worth (shareholders' money)$2.3B
- Debt to equity
- 0×
- $ of debt for every $1 of shareholders' money
- Net cash of $1,885 million is a Cityfort calculation from the Q3 FY2026 10-Q: cash and marketable securities minus zero borrowings. It leaves out $154 million of cash held for customers and $76 million of restricted cash.
- Toast has a $350 million revolving credit line, renewed in May 2025 to May 2030; it was undrawn at Dec 31, 2025, with $347 million available after letters of credit.
Sources (2)
19Who owns it
19Who owns it · ownership as of Mar 31, 2026
Who owns Toast?
- Officers and directors (as a group), shares
- 10.0%
- Officers and directors (as a group), votes
- 40.6%
Shares vs votes by class
Toast has more than one class of shares, and the classes carry different votes. The share of votes a class holds can differ a lot from its share of the shares.
- Class A common stock: share of all votes45.6%
- Class B common stock: share of all votes54.4%
Each class's part of all votes = its shares outstanding × votes per share ÷ the total for all classes.
Share classes
Holders of 5% or more
From the company's proxy statement (DEF 14A), later Schedule 13G filings and the share counts on its latest annual or quarterly report. Each holder row shows the date of its own filing.
Learn: Dual-class shares: when votes and ownership don't match · How to read a proxy statement (DEF 14A): Nvidia's 2026 proxy · Form 4 insider filings: who files, the codes and the footnotes
20What it does with profit
20What it does with profit
What does Toast do with its profit?
Buyback · Dec 31, 2025
FY2025 repurchases of Class A stock under a program first authorized in February 2024.
$107M
Buyback · Sep 30, 2026
First nine months of 2026: 19 million shares, none in Q3. The board added $500 million to the program on Feb 10, 2026; about $100 million was left at Sep 30, 2026.
$486M
21Governance signals
21Governance signals
What do Toast's governance filings show?
- Auditor
- Ernst & Young LLP, since 2019
- Auditor changes
- None in the period covered
- Audit qualifications
- None reported
- Related-party dealings
- The 2026 proxy statement describes no related-party transactions beyond executive and director pay and indemnification agreements with directors and officers. The audit committee reviews and approves any such transactions.
- Credit rating
- No public credit rating found in a search of rating agency sites on Nov 20, 2026
Flags to know about
regulatory · Oct 29, 2026
FTC lawsuit
On Oct 29, 2026 the FTC, seven states and two California local governments sued Toast in federal court in Northern California. The complaint alleges violations of Section 5 of the FTC Act, the Restore Online Shoppers' Confidence Act and similar state laws, and seeks an injunction, monetary relief of an unspecified amount and civil penalties. Toast says it strongly disagrees and will vigorously defend its interests.
22How it got here
22How it got here
How did Toast get here?
2011
Milestone
Founded as Opti Systems
Incorporated in Delaware in December 2011; renamed Toast, Inc. in May 2012.
2021
Milestone
Listed on the NYSE
Initial public offering in September 2021; FY2021 net loss was $487 million.
2022
Crisis
Cash outflow year
Net loss of $275 million and operating cash outflow of $156 million in FY2022.
2024
Business-model change
Co-founders take the CEO and President roles; cost cuts
Aman Narang became CEO and Stephen Fredette President in January 2024. A February 2024 restructuring plan cut about 550 jobs.
2024
Milestone
First full-year profit
Net income of $19 million in FY2024, after a $246 million loss in FY2023. Toast called FY2024 its first year of GAAP profitability (Q4 2024 release).
2025
Milestone
30,000 net new locations
A record by Toast's count, reaching about 164,000 locations; FY2025 net income was $342 million.
2026
Crisis
FTC lawsuit filed
The FTC and several states sued Toast on Oct 29, 2026, alleging violations of the FTC Act, the Restore Online Shoppers' Confidence Act and similar state laws; Toast says it strongly disagrees.
23Sources and changes
Where every number on this page comes from
Sources (23 documents)
- S1Form 10-Q for Q3 FY2026 · SEC EDGAR · Tier 1: company or exchange filing · Nov 4, 2026
- S2Form 10-Q for Q2 FY2026 · SEC EDGAR · Tier 1: company or exchange filing · Aug 5, 2026
- S3Form 10-Q for Q1 FY2026 · SEC EDGAR · Tier 1: company or exchange filing · May 8, 2026
- S4Form 10-K for FY2025 · SEC EDGAR · Tier 1: company or exchange filing · Feb 18, 2026
- S5Form 10-Q for Q3 FY2025 · SEC EDGAR · Tier 1: company or exchange filing · Nov 5, 2025
- S6Form 10-Q for Q2 FY2025 · SEC EDGAR · Tier 1: company or exchange filing · Aug 6, 2025
- S7Form 10-Q for Q1 FY2025 · SEC EDGAR · Tier 1: company or exchange filing · May 9, 2025
- S8Form 10-K for FY2024 · SEC EDGAR · Tier 1: company or exchange filing · Feb 26, 2025
- S9Form 10-Q for Q3 FY2024 · SEC EDGAR · Tier 1: company or exchange filing · Nov 8, 2024
- S10Form 10-Q for Q2 FY2024 · SEC EDGAR · Tier 1: company or exchange filing · Aug 7, 2024
- S11Form 10-Q for Q1 FY2024 · SEC EDGAR · Tier 1: company or exchange filing · May 8, 2024
- S12Form 10-K for FY2023 · SEC EDGAR · Tier 1: company or exchange filing · Feb 27, 2024
- S13Form 10-K for FY2022 · SEC EDGAR · Tier 1: company or exchange filing · Mar 1, 2023
- S14Form 10-K for FY2021 · SEC EDGAR · Tier 1: company or exchange filing · Mar 1, 2022
- S15Q3 2026 earnings release (Form 8-K, Exhibit 99.1) · SEC EDGAR · Tier 1: company or exchange filing · Nov 3, 2026
- S16Q2 2026 earnings release (Form 8-K, Exhibit 99.1) · SEC EDGAR · Tier 1: company or exchange filing · Aug 4, 2026
- S17Q1 2026 earnings release (Form 8-K, Exhibit 99.1) · SEC EDGAR · Tier 1: company or exchange filing · May 7, 2026
- S18Q4 2025 earnings release (Form 8-K, Exhibit 99.1) · SEC EDGAR · Tier 1: company or exchange filing · Feb 12, 2026
- S19Q3 2025 earnings release (Form 8-K, Exhibit 99.1) · SEC EDGAR · Tier 1: company or exchange filing · Nov 4, 2025
- S20Q2 2025 earnings release (Form 8-K, Exhibit 99.1) · SEC EDGAR · Tier 1: company or exchange filing · Aug 5, 2025
- S21Q1 2025 earnings release (Form 8-K, Exhibit 99.1) · SEC EDGAR · Tier 1: company or exchange filing · May 8, 2025
- S22Q4 2024 earnings release (Form 8-K, Exhibit 99.1) · SEC EDGAR · Tier 1: company or exchange filing · Feb 19, 2025
- S232026 proxy statement (DEF 14A) · SEC EDGAR · Tier 1: company or exchange filing · Apr 23, 2026
Changes to this page (v1 · Nov 20, 2026)
- v1 · Nov 20, 2026First version. (first version)
Numbers come only from tier 1 and tier 2 sources. Read how we research.
Disclaimer
For learning only. Cityfort is not a registered investment adviser or broker-dealer and does not recommend buying or selling any security. Prices shown are dated and may be out of date.
Investing in securities involves risk, including loss of capital. Before making any investment decision, do your own research and consider consulting a registered investment adviser or other qualified professional.
Cityfort, its owners and contributors may or may not hold securities of companies covered. Cityfort is not paid by any company it covers. Content is not an offer or solicitation to buy or sell any security, including in any initial public offering.
Read the positions policyRead the full disclaimerHide the full disclaimer
Cityfort publishes general educational content that explains how listed companies work. Cityfort is not registered with the US Securities and Exchange Commission or any state securities regulator as an investment adviser, and is not a broker-dealer or a member of FINRA. Cityfort does not provide investment, tax or legal advice, recommendations, ratings, price targets or any opinion on whether to buy, sell or hold any security. Nothing on the site is tailored to any person's circumstances.
All information is taken from publicly available sources, mainly company filings with the SEC, which are listed on each page with dates. We work to keep it accurate and correct errors publicly, but we do not guarantee that it is complete, accurate or up to date. Any market price or price-based ratio shown is dated, may be out of date by the time you read it, and is included only to explain concepts.
Statements by company management, including forward-looking statements and guidance, are reported as the company's statements, with their date and source; they are not our forecasts. Adjusted (non-GAAP) figures are the company's own measures and are shown next to the official (GAAP) figures.