Technology · NYSE: WIT
Wipro: how the business works
Wipro, an Indian company founded in 1945, builds and runs technology systems for large businesses, mostly in the Americas and Europe, with revenue of INR 926,240 million in FY2026 (year ended Mar 31, 2026).
By Hardik Bhandare · Checked against filings: . Editorial policy. Corrections
Follow Wipro
Email me when Wipro's page is updated after earnings.
We'll send a confirmation email first. See our privacy policy.
Wipro Limited · Bengaluru, India · Founded 1945
Updated for Q2 FY2027 · checked
- Revenue, FY2026
- INR 926,240 million
- Net profit, FY2026
- INR 131,974 million
- Revenue, Q2 FY2027 (INR 226,973 million a year earlier)
- INR 247,527 million
- Employees, Sep 30, 2026
- 236,328
- Held by the Premji family and its entities, Jun 25, 2026
- 72.59%
The short version
Wipro in 5 points
1 · What it sells
Wipro sells IT services, building and running technology for 1,229 active clients at Sep 30, 2026, and earned INR 926,240 million of revenue in FY2026, 52.0% of it from fixed-price and volume-based contracts.
2 · Who pays it
Banks, insurers and other financial firms paid 34.1% of Wipro's FY2026 IT Services revenue, consumer businesses 18.4%, energy, manufacturing and resources firms 17.0%, technology and communications firms 16.0% and health firms 14.5%.
3 · What it keeps from INR 100
Of every INR 100 that came in during FY2026, including INR 38,601 million of finance and other income, Wipro kept INR 13.7 as net profit, while its operating profit was INR 16.3 per INR 100 of revenue.
4 · Where the operating profit comes from
Americas 1 earned INR 69,852 million of Wipro's FY2026 IT Services segment result of INR 158,646 million, Americas 2 INR 46,182 million and Europe INR 31,083 million, on the grouping used from Apr 1, 2026.
5 · The one thing to watch
On Oct 15, 2026 Wipro guided Q3 FY2027 IT Services revenue of 2,571 million to 2,625 million US dollars; large deal bookings were 674 million US dollars in Q2 FY2027, down from 1,626 million US dollars in Q1.
Sources: From Wipro's Form 20-Fs for FY2022 to FY2026 and its Form 6-K results · checked
01Where the money goes · FY2026
Where does INR 100 of Wipro's money go?
Wipro · FY2026
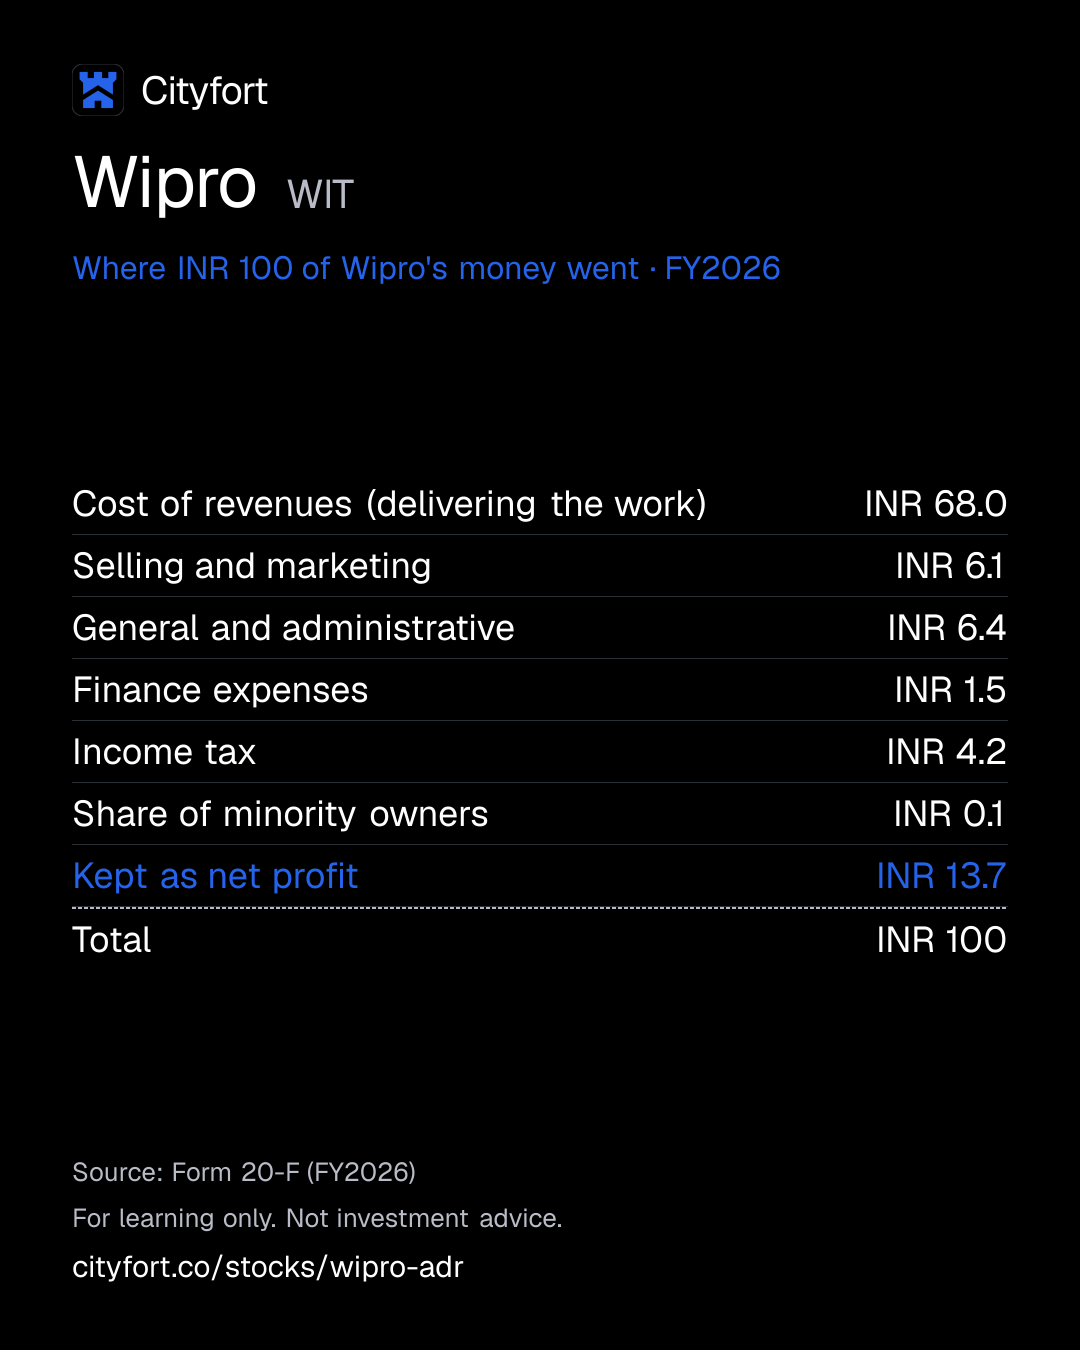
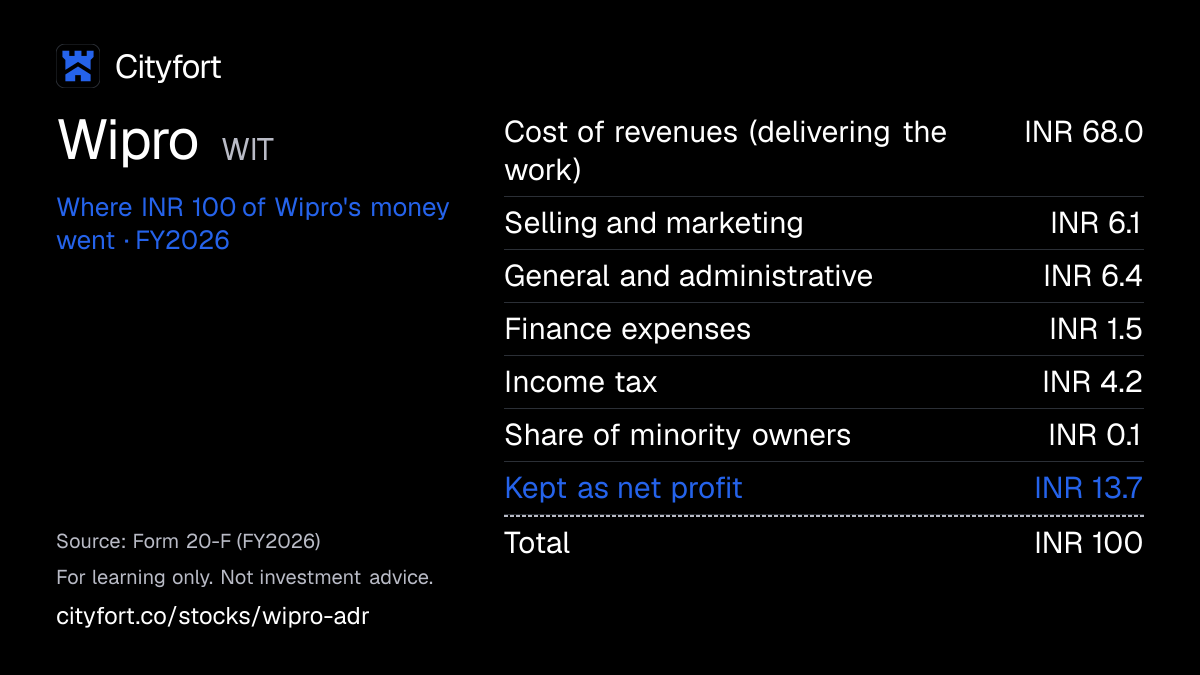
Receipt for every INR 100
| Cost of revenues (delivering the work) | INR 68.0 |
|---|---|
| Selling and marketing | INR 6.1 |
| General and administrative | INR 6.4 |
| Finance expenses | INR 1.5 |
| Income tax | INR 4.2 |
| Share of minority owners | INR 0.1 |
| Kept as net profit | INR 13.7 |
| Total | INR 100 |
Each line = amount ÷ total money in × 100. Lines may not add to exactly INR 100 because of rounding.
How this is worked out
Cityfort calculation from the FY2026 20-F. Of every INR 100 that came in during FY2026 (revenue of INR 926,240 million plus INR 38,601 million of finance and other income, foreign exchange gains and share of associates' profit): each line = line ÷ INR 964,841 million × 100.
Save this receipt as an image
Embed this receipt or the key numbers
Paste this code into a blog or website to show the card you choose, with a link back to this page.
Each week: the next company due to report earnings, explained in 5 points.
No tips. Unsubscribe anytime.
We'll send a confirmation email. See our privacy policy.
02The business in one line
What does Wipro do?
Large companies pay Wipro to build and run their technology; most of that money goes to delivering the work, and in FY2026 Wipro kept INR 13.7 of every INR 100 that came in as net profit.
- Clients in the Americas paid about 62% of FY2026 IT Services revenue and clients in Europe about 27%, the 20-F says.
- Revenue grew 4.0% to INR 926,240 million in FY2026, and net profit rose from INR 131,354 million to INR 131,974 million.
03Who pays it
Who pays Wipro?
Banks, insurers and other financial firms
34.1%
of revenue
The largest client group by industry. Revenue from it grew 0.8% year on year in US dollars in Q2 FY2027.
Consumer businesses
18.4%
of revenue
Revenue from consumer clients grew 5.7% year on year in US dollars in Q2 FY2027.
Energy, manufacturing and resources firms
17%
of revenue
Revenue from this group fell 6.5% year on year in US dollars in Q2 FY2027.
Technology and communications firms
16%
of revenue
Revenue from this group grew 6.6% year on year in US dollars in Q2 FY2027.
Health firms
14.5%
of revenue
Revenue from health clients fell 6.5% year on year in US dollars in Q2 FY2027.
- Banks, insurers and other financial firms34.1%
- Consumer businesses18.4%
- Energy, manufacturing and resources firms17%
- Technology and communications firms16%
- Health firms14.5%
How spread out the customers are
Shares are of FY2026 IT Services revenue, as Wipro's data sheet shows them. No client paid more than 10% of revenue in FY2024, FY2025 or FY2026. The five largest paid 14.3% of FY2026 revenue and the ten largest about 23.7%. The Q2 FY2027 data sheet gives 4.5%, 14.9% and 23.9%, with 1,229 active clients at Sep 30, 2026.
- Largest customer
- 5%
- Top 5 customers
- 14%
- Top 10 customers
- 24%
04How it makes money
How does Wipro make money?
Wipro bills clients abroad, mostly in US dollars, for work largely done in India, and kept between INR 15.2 and INR 17.7 of operating profit per INR 100 of revenue from FY2022 to FY2026.
Delivering the work took INR 70.8 of every INR 100 of FY2026 revenue. Wipro's four market units earned INR 162,072 million of segment result in FY2026, and IT Services as a whole INR 158,646 million after unallocated costs. With IT Products' INR 559 million and INR 7,954 million of reconciling items, operating profit was INR 151,251 million.
Operating profit per INR 100 of revenue
INR 17.7INR 16.3
FY2022 to FY2026
- Clients sign contracts; Wipro booked 16,449 million US dollars of total contract value in FY2026
- Staff deliver the work, with 62.2% of services revenue delivered offshore in Q2 FY2027
- 59% of IT Services revenue was billed in US dollars in Q2 FY2027, while the 20-F says Indian wages are lower than US and European ones
- Operating profit was INR 16.3 per INR 100 of revenue in FY2026
- Cash from operations, INR 149,316 million in FY2026, pays for dividends, buybacks and acquisitions
↺ Step 5 feeds back into step 1.
05Business segments · FY2026
Which businesses make up Wipro?
Americas 1
35.4%Communications, technology, health and consumer clients across the US, Latin America and Canada, at a 21.3% segment margin. Revenue fell 3.1% year on year in US dollars in Q2 FY2027.
Revenue INR 328,118M · Operating profit INR 69,852M
Americas 2
26.6%Banking, insurance, capital markets, energy and manufacturing clients across the Americas, at an 18.7% segment margin. Revenue fell 5.0% year on year in US dollars in Q2 FY2027.
Revenue INR 246,530M · Operating profit INR 46,182M
Europe
26.3%Clients in the UK, Ireland, Switzerland, Germany and Western Europe, at a 12.7% segment margin. Revenue grew 4.5% year on year in US dollars in Q2 FY2027.
Revenue INR 244,165M · Operating profit INR 31,083M
Asia Pacific, Middle East and Africa
11%Clients in Australia, New Zealand, Southeast Asia, Japan, India, the Middle East and Africa, at a 14.6% segment margin. Revenue grew 13.9% year on year in US dollars in Q2 FY2027.
Revenue INR 102,340M · Operating profit INR 14,955M
IT Products
0.7%Resale of other brands' hardware and software, at an 8.1% segment margin.
Revenue INR 6,940M · Operating profit INR 559M
06The numbers · Consolidated · INR million
How has Wipro done?
Wipro files a Form 20-FThe annual report a foreign company listed in the US files with the SEC, in place of a 10-K. Learn more each year and furnishes quarterly results on Form 6-KHow a foreign company listed in the US furnishes the SEC with reports it publishes at home, such as quarterly results. It is not a 10-Q. Learn more, as a foreign private issuerA non-US company that the SEC lets file a 20-F instead of a 10-K. It files no US proxy statement. Learn more. Its financial statements follow IFRSInternational Financial Reporting Standards: accounting rules set by the International Accounting Standards Board. The SEC accepts them from foreign companies in place of US GAAP. (International Financial Reporting Standards, as issued by the IASB) and are reported in Indian rupees, shown here as filed in INR million (not converted to dollars). Quarterly figures: IFRS as issued by the IASB, in INR, from the audited quarterly results furnished on Form 6-K, audited under Indian auditing standards.
Wipro's 20-F uses IFRS as issued by the IASB, in Indian rupees, so amounts show in INR million as filed, never converted. EPS reflects the 1:1 bonus issue of December 2024; no comparable FY2022 EPS is filed, so that year is blank.
Revenue
INR 926,240MFY2026
Revenue rose from INR 790,934 million in FY2022 to INR 926,240 million in FY2026, dipping in FY2024 and FY2025; Q2 FY2027 revenue was 9.1% above a year earlier.
INR million
See the numbers
Net income
INR 131,974MFY2026
Net profit for shareholders was INR 131,974 million in FY2026; at INR 31,190 million, Q3 FY2026 was the lowest of the eight quarters shown and included restructuring and labor code charges.
INR million
See the numbers
Net income for every INR 100 of revenue
INR 14.2FY2026
EBITDA per INR 100 of revenue moved between INR 19.0 and INR 21.6 from FY2022 to FY2026; EBITDA is a Cityfort calculation from the Form 20-Fs (operating profit plus depreciation, amortization and impairment), as Wipro reports none.
Net margin: INR of net income per INR 100 of revenue
See the numbers
Free cash flow
INR 133,713MFY2026
Free cash flow (cash from operations minus spending on property and equipment) was INR 133,713 million in FY2026, about 1.01 times net profit.
INR million · cash from operations minus spending on plants and equipment
See the numbers
See all yearly numbers
EBITDA here = operating income plus depreciation and amortization (from the cash flow statement). Fiscal years are the company's own: Mar 31 (fiscal 2026 = Apr 1, 2025 to Mar 31, 2026). EPS is per equity share, as filed. One American depositary share (ADS) represents one equity share. JPMorgan Chase Bank, N.A. is the depositary, and the ADSs trade on the New York Stock Exchange. So earnings per ADS equal earnings per share. Net income is the share belonging to the company's owners.
Learn: Fiscal years that don't end in December: Nvidia's FY2027 explained
Sources (8)
- Form 20-F for FY2022 (year ended March 31, 2022)
- Form 20-F for FY2023 (year ended March 31, 2023)
- Form 20-F for FY2025 (year ended March 31, 2025)
- Form 20-F for FY2026 (year ended March 31, 2026)
- Form 6-K: Q3 FY2026 audited consolidated results under IFRS (IASB) (Exhibit 99.4)
- Form 6-K: Q4 FY2026 audited consolidated results under IFRS (IASB) (Exhibit 99.4)
- Form 6-K: Q2 FY2026 audited consolidated results under IFRS (IASB) (Exhibit 99.4)
- Form 6-K: Q2 FY2027 audited consolidated results under IFRS (IASB) (Exhibit 99.4)
07Who runs it
Who runs Wipro, and did they deliver?
Rishad A. Premji
Executive Chairman
Son of Azim H. Premji. He and the CEO are entitled to a commission of 0.35% on the increase in consolidated net profit over the previous fiscal yearThe company's own 12-month year, which may not end in December. Learn more.
Azim H. Premji
Founder Chairman (non-executive director)
Led the company from the late 1960s and was chairman until Jul 30, 2019. He has been the non-executive Founder Chairman since Jul 31, 2019.
Srinivas Pallia
Chief Executive Officer and Managing Director · since 2024
CEO since Apr 7, 2024, after more than three decades at Wipro, including as CEO of the Americas 1 market unit.
Aparna C. Iyer
Chief Financial Officer · since 2023
CFO since Sep 22, 2023. She has held finance roles at Wipro since 2003.
What they said, and what happened
3 delivered · 1 too early to tell
Said on Jan 16, 2026
Wipro guided Q4 FY2026 IT Services revenue of 2,635 million to 2,688 million US dollars, 0% to 2.0% growth from Q3 in constant currency.
DeliveredWhat happened
IT Services revenue was 2,651.0 million US dollars, up 0.2% in constant currency, inside the range.
Said on Apr 16, 2026
Wipro guided Q1 FY2027 IT Services revenue of 2,597 million to 2,651 million US dollars, -2.0% to 0% from Q4 in constant currency.
DeliveredWhat happened
IT Services revenue was 2,614.5 million US dollars, down 1.2% in constant currency, inside the range.
Said on Jul 16, 2026
Wipro guided Q2 FY2027 IT Services revenue of 2,574 million to 2,627 million US dollars, -1.5% to +0.5% from Q1 in constant currency, in its Q1 FY2027 results of Jul 16, 2026 (furnished on Form 6-K on Jul 22, 2026).
DeliveredWhat happened
IT Services revenue was 2,611.5 million US dollars, flat in constant currency, inside the range.
Said on Oct 15, 2026
Wipro guided Q3 FY2027 IT Services revenue of 2,571 million to 2,625 million US dollars, -1.5% to +0.5% from Q2 in constant currency.
Too early to tellWhat happened
The quarter ends Dec 31, 2026; Wipro has not announced its results date.
Sources (5)
08What could go wrong
What could go wrong for Wipro?
- Concentration
A few large clients matter
The five largest clients paid 14.3% of FY2026 revenue and the ten largest about 23.7%. The 20-F says losing a significant client could have a material adverse effect, though none paid more than 10%.
Watch The top-ten client share in each quarter's data sheet: 23.9% in Q2 FY2027.
- Competition
AI and new rivals
The 20-F names AI-native companies and clients' in-house IT units among Wipro's competitors. It says AI-driven automation may reduce demand for some services and pressure prices.
Watch IT Services revenue growth in constant currency: flat from Q1 to Q2 FY2027.
- Demand
Clients in the Americas are spending less
Revenue from Americas 1 fell 3.1% and from Americas 2 5.0% year on year in US dollars in Q2 FY2027. Health clients and energy, manufacturing and resources clients each fell 6.5%.
Watch Growth by market unit and industry in each quarter's data sheet.
- Currency
Rupee and dollar swings
Wipro reports in rupees, but 59% of Q2 FY2027 IT Services revenue was in US dollars, 13% in pounds and 8% in euros. The 20-F says the ADSA certificate a US bank (the depositary) issues for shares of a foreign company that it holds. It trades in US dollars on a US exchange, and one may stand for more than one share. Learn more price and the US-dollar value of dividends may be hurt by swings in the dollar-rupee rate.
Watch Reported growth against constant-currency growth each quarter.
- Execution
Restructuring and margins
Wipro booked INR 5,139 million of restructuring in FY2026, and the 20-F says its cost programs may not bring the expected benefits. The CFO said in the Q1 FY2027 results (furnished Jul 22, 2026) that investments "may create some near-term margin volatility".
Watch The IT Services operating margin: 16.5% in Q2 FY2027, against 17.2% in FY2026.
- Regulation
Work visa rules
The 20-F says changes to immigration laws, fewer work visas or higher visa fees in key markets, including the US, may delay staffing of projects and reduce profit.
Watch Changes to US work visa rules and Wipro's comments on them in its 6-K results.
- Governance
ADS holders vote through a bank
ADS holders vote through the depositary, and shares with no voting instructions are not voted, the 20-F says. ADSs were 2.48% of shares at Mar 31, 2026; the Premji family and its entities held 72.59% on Jun 25, 2026.
Watch The family's holding in Wipro's shareholding filings.
- Legal
Tax claims in India
The 20-F lists income tax claims of INR 104,613 million that Wipro does not acknowledge as debt, at Mar 31, 2026. It also says Wipro is not party to any pending legal proceedings whose resolution could have a material impact on its financial position.
Watch The size of the claims in the next 20-F.
Sources (6)
- Form 20-F for FY2026 (year ended March 31, 2026)
- Form 6-K: Q2 FY2027 highlights and IT Services data sheet (Exhibit 99.5)
- Form 6-K: Q2 FY2027 results press release (Exhibit 99.1)
- Form 6-K: Q4 FY2026 audited consolidated results under IFRS (IASB) (Exhibit 99.4)
- Form 6-K: Q1 FY2027 results press release (Exhibit 99.1)
- Form 6-K: completion of extinguishment of 600,000,000 bought-back shares, with pre- and post-buyback shareholding (Exhibit 99.1)
09Supporters vs. critics
What do supporters and critics point to?
What supporters point to
- Wipro was profitable in every year from FY2022 to FY2026, with net profit of INR 131,974 million in FY2026.
- Free cash flow was INR 133,713 million in FY2026, about the same as net profit.
- At Sep 30, 2026, cash and current investments of INR 436,543 million were more than borrowings of INR 185,021 million.
- Reported IT Services revenue landed inside Wipro's guidance range in Q4 FY2026, Q1 FY2027 and Q2 FY2027.
- Large deal bookings rose 45.4% to 7,829 million US dollars in FY2026, by the company's count.
What critics point to
- IT Services revenue in US dollars fell 0.3% in FY2026, and 1.6% in constant currency, by Wipro's own measures.
- Large deal bookings were 674 million US dollars in Q2 FY2027, down 58.6% from Q1 in constant currency.
- Revenue from Americas 1 and Americas 2 clients fell 3.1% and 5.0% year on year in US dollars in Q2 FY2027.
- Operating profit per INR 100 of revenue was INR 16.3 in FY2026, down from INR 17.7 in FY2022.
- Wipro's cash measure was INR 543,235 million at Mar 31, 2026; on the same method it was INR 436,543 million at Sep 30, 2026, a half in which Wipro paid INR 150,508 million for a buyback.
10What to watch next
What should you watch next at Wipro?
Next event
Q3 FY2027 results (quarter ending Dec 31, 2026)
Date not announced yet.
Q3 FY2027 against Wipro's range
Wipro said on Oct 15, 2026 that it expects Q3 FY2027 IT Services revenue of 2,571 million to 2,625 million US dollars. Q2 FY2027 revenue was 2,611.5 million US dollars.
Large deal bookings
Large deals were 674 million US dollars in Q2 FY2027, after 1,626 million US dollars in Q1 FY2027 and 7,829 million US dollars in FY2026.
Margins while Wipro invests
The company's IT Services operating margin was 16.5% in Q2 FY2027 and 17.2% in FY2026. The CFO said in July 2026 that investments may cause some near-term margin volatility.
11Key dates
What are the key dates for Wipro?
| Event | Date | Source |
|---|---|---|
| Fiscal 2027 endsWipro's fiscal year runs from Apr 1 to Mar 31. | Form 20-F for FY2026 (year ended March 31, 2026) |
Learn: Fiscal years that don't end in December: Nvidia's FY2027 explained
12Key facts
Key facts about Wipro
- What does Wipro do?
- Wipro is an Indian IT services and consulting company based in Bengaluru. It builds, updates and runs software and technology systems for large businesses, and had 236,328 employees at Sep 30, 2026.
- How does Wipro make money?
- Wipro charges clients for its staff's work. In FY2026, fixed-price and volume-based contracts brought in 52.0% of its revenue of INR 926,240 million and time-and-materials contracts 47.2% (Cityfort calculation from the FY2026 20-F).
- Who are Wipro's customers?
- Wipro's customers are large businesses. In FY2026 banks, insurers and other financial firms paid 34.1% of Wipro's IT Services revenue, consumer businesses 18.4%, energy, manufacturing and resources firms 17.0%, technology and communications firms 16.0% and health firms 14.5%.
- How big is Wipro?
- Wipro had revenue of INR 926,240 million and net profit of INR 131,974 million in FY2026 (year ended Mar 31, 2026), with 242,156 employees at Mar 31, 2026.
- Is Wipro profitable?
- Yes. Wipro's net profit was INR 131,974 million in FY2026, INR 14.2 for every INR 100 of revenue, and Wipro was profitable in every year from FY2022 to FY2026.
- What is a Wipro ADS?
- A Wipro American depositary share (ADS) trades on the New York Stock Exchange under the ticker WIT. Each ADS represents one Wipro equity share, held by the depositary, JPMorgan Chase Bank, N.A., according to Wipro's FY2026 20-F.
- Who owns Wipro?
- The Premji family and the entities it controls held 72.59% of Wipro's equity shares on Jun 25, 2026, after Wipro's share buyback, according to a Wipro Form 6-K filed on Jul 2, 2026. Azim H. Premji is Wipro's founder chairman.
- Does Wipro have debt?
- Wipro had borrowings of INR 185,021 million at Sep 30, 2026, against cash and current investments of INR 436,543 million (Cityfort calculation from Wipro's Q2 FY2027 Form 6-K).
- What were Wipro's latest quarterly results?
- In Q2 FY2027 (quarter ended Sep 30, 2026), Wipro's revenue was INR 247,527 million, up 9.1% from INR 226,973 million a year earlier, and net profit was INR 32,006 million, down from INR 32,462 million.
- Does Wipro pay dividends?
- Yes. Wipro paid dividends of INR 11 per equity share in FY2026: INR 5 declared on Jul 17, 2025 and INR 6 declared on Jan 16, 2026. One Wipro ADS represents one share, and the depositary converts dividends into US dollars for ADS holders.
Sources (7)
- Form 20-F for FY2026 (year ended March 31, 2026)
- Form 6-K: Q2 FY2027 highlights and IT Services data sheet (Exhibit 99.5)
- Form 6-K: Q4 FY2026 highlights (Exhibit 99.5)
- Form 20-F for FY2023 (year ended March 31, 2023)
- Form 20-F for FY2022 (year ended March 31, 2022)
- Form 6-K: completion of extinguishment of 600,000,000 bought-back shares, with pre- and post-buyback shareholding (Exhibit 99.1)
- Form 6-K: Q2 FY2027 audited consolidated results under IFRS (IASB) (Exhibit 99.4)
Go deeper
More detail from the same filings. Open any section.
13What it sells
13What it sells
What does Wipro sell?
IT Services, sold through four market units
Two units serve the Americas by client industry; the others are Europe and Asia Pacific, Middle East and Africa. IT Services brought in INR 921,153 million of FY2026 segment revenue.
Consulting, engineering and business process work
In FY2026 its four global business lines were Technology Services, Business Process Services, Consulting Services and Engineering.
AI platforms and services
Wipro sells AI work under the Wipro Intelligence name, including WEGA, which it calls its agentic platform. On Apr 16, 2026 the CEO said Wipro was pivoting to "a services-as-a-software model" through its AI Native Business & Platforms unit.
Acquired IT services firms
Wipro bought Harman's Digital Transformation Solutions unit for INR 34,044 million in cash, closing on Dec 1, 2025. It bought Mindsprint, the Olam Group's IT services arm, for INR 35,150 million, closing on May 15, 2026.
IT Products
Resale of security, packaged and software-as-a-service products from other brands: INR 6,940 million, 0.7% of FY2026 revenue.
Think of it like this
Like a large contractor that companies hire to build and look after their technology, paid by the project or for the time worked.
What it does
- Does: Builds, updates and runs software for clients
- Does: Delivers 62.2% of its services revenue offshore (Q2 FY2027)
- Does: Takes fixed-price and volume-based contracts, 52.0% of FY2026 revenue
What it does not do
- Does not: Depend on one client for more than 10% of revenue (none in FY2024 to FY2026)
- Does not: Earn much in India: 97.5% of FY2026 segment revenue came from customers outside India
- Does not: Report in US dollars: its 20-F figures are in Indian rupees
14How the money flows
14How the money flows · FY2026
How does money flow through Wipro?
Money in
- Revenue from clientsINR 926,240M
- Finance and other income, foreign exchange gains and share of associates' profitINR 38,601M
The company
Wipro
INR 964,841M came in
Money out
- Cost of revenues (delivering the work)INR 656,192M
- Selling and marketingINR 59,216M
- General and administrativeINR 61,434M
- Finance expensesINR 14,577M
- Income taxINR 40,767M
- Share of minority ownersINR 681M
- Net profit attributable to Wipro's shareholdersINR 131,974M
- Clients paid Wipro INR 926,240 million in FY2026 for technology services and products.
- Delivering the work cost INR 656,192 million.
- Selling and marketing took INR 59,216 million and administration INR 61,434 million. With INR 1,853 million of foreign exchange gains, operating profit was INR 151,251 million.
- Finance and other income added INR 36,491 million. Finance expenses took INR 14,577 million and income tax INR 40,767 million.
- What was left for Wipro's shareholders, INR 131,974 million, was net profit.
15What it needs to run
15What it needs to run
What does Wipro need to run?
People
236,328 employees at Sep 30, 2026. Utilization, the share of staff time billed to clients excluding trainees, was 83.4% in Q2 FY2027. Voluntary attrition was 13.8% over the last 12 months.
A sales force close to clients
15,016 sales and support staff in IT Services at Sep 30, 2026. The 20-F says customer-facing teams in each market unit are mostly hired locally.
Offices and delivery centers
Capital spending was INR 15,603 million in FY2026, mainly on software development facilities in India and IT assets. A further INR 9,416 million was committed at Mar 31, 2026.
Technology partners
A significant portion of Wipro's services is based on technology or software from alliance partners, the 20-F says. Most of those alliances are not exclusive.
16Where growth could come from
16Where growth could come from
Where could Wipro's growth come from?
Wipro gives guidance one quarter at a time, for IT Services revenue in US dollars. It said on Oct 15, 2026 that it expects 2,571 million to 2,625 million US dollars for Q3 FY2027 (quarter ending Dec 31, 2026), a change of -1.5% to +0.5% from Q2 FY2027 in constant currency.
Large deals
Mixed674 million US dollars in Q2 FY2027, after 1,626 million US dollars in Q1
Large deals are contracts worth 30 million US dollars or more in total. Wipro booked 7,829 million US dollars of them in FY2026, up 45.4%. In Q2 FY2027 they fell 58.6% from Q1 in constant currency.
Status: Mixed, partly on track.
Acquisitions
NewINR 32,971 million spent in the half to Sep 30, 2026
Wipro bought Harman's Digital Transformation Solutions unit (Dec 1, 2025) and Mindsprint (May 15, 2026). On Apr 16, 2026 the CEO called the deal with the Olam Group, Mindsprint's seller, strategic.
Status: New, recently announced.
AI services
EarlyNo separate AI revenue figure is reported
The CEO said on Oct 15, 2026: "The strategic investments we have been making are beginning to deliver results." On Apr 16, 2026 the CEO named the AI Native Business & Platforms unit as the vehicle for a services-as-a-software model.
Status: Early, too early to judge.
Europe and Asia Pacific clients
Working+4.5% and +13.9% year on year, Q2 FY2027
IT Services revenue from Europe and from Asia Pacific, Middle East and Africa grew year on year in US dollars in Q2 FY2027.
Status: Working, on track against what the company said.
Clients in the Americas
Behind-3.1% and -5.0% year on year, Q2 FY2027
Revenue from Americas 1 and Americas 2, which brought in 60.0% of Q2 FY2027 IT Services revenue, fell year on year in US dollars.
Status: Behind, behind the company's own plan.
Status compares progress with what the company itself said it would do: Working = on track against what the company said; Mixed = partly on track; Behind = behind the company's own plan; New = recently announced; Early = too early to judge.
Sources (6)
- Form 6-K: Q2 FY2027 results press release (Exhibit 99.1)
- Form 6-K: Q4 and FY2026 results press release (Exhibit 99.1)
- Form 6-K: Q2 FY2027 highlights and IT Services data sheet (Exhibit 99.5)
- Form 20-F for FY2026 (year ended March 31, 2026)
- Form 6-K: Q2 FY2027 interim condensed consolidated financial statements under IFRS (Exhibit 99.3)
- Form 6-K: Q2 FY2027 audited consolidated results under IFRS (IASB) (Exhibit 99.4)
17The company's own measures (non-GAAP)
17The company's own measures · FY2026 (year ended Mar 31, 2026), unless stated
What do Wipro's own measures show?
Official (IFRS): Operating margin on total revenue (IFRS), Q2 FY2027
16.4%
Company's own measure: IT Services operating margin, Q2 FY2027
16.5%
Wipro's measure divides the IT Services segment result by IT Services segment revenue, so IT Products and reconciling items, such as restructuring, sit outside it. The IFRS margin is a Cityfort calculation from the Q2 FY2027 Form 6-K: operating profit of INR 40,645 million ÷ revenue of INR 247,527 million.
Official (IFRS): Operating margin on total revenue (IFRS), Q3 FY2026
15.2%
Company's own measure: IT Services operating margin, Q3 FY2026
17.6%
Operating profit that quarter included INR 2,629 million of restructuring, an INR 3,028 million charge for India's new labor codes and an INR 841 million impairment. The IFRS margin is a Cityfort calculation from the Q3 FY2026 Form 6-K.
Official (IFRS): Operating margin on total revenue (IFRS), FY2026
16.3%
Company's own measure: IT Services operating margin, FY2026
17.2%
Same definition for the full year; FY2026 restructuring costs totaled INR 5,139 million. The IFRS margin is a Cityfort calculation from the FY2026 20-F.
Official (IFRS): Net profit attributable to shareholders (IFRS), FY2026
INR 131,974M
Company's own measure: Adjusted net income, FY2026
INR 134,255M
Wipro leaves out only the effect of India's new labor codes. Restructuring costs stay in.
Official (IFRS): Net cash from operating activities (IFRS), FY2026
INR 149,316M
Company's own measure: Free cash flow (Wipro's definition), FY2026
INR 134,471M
Wipro subtracts INR 15,603 million of spending on property, plant and equipment and adds INR 758 million of proceeds from selling such assets. "The numbers" shows INR 133,713 million, which leaves out the proceeds.
Official (IFRS): Revenue (IFRS), FY2026
INR 926,240M
Company's own measure: IT Services revenue in US dollars, FY2026
10,478.1 US$ million
Wipro's own reporting line for its services business, down 0.3% from 10,511.5 million US dollars in FY2025, and down 1.6% in constant currency (at the previous year's exchange rates). Its guidance uses this measure. It is never added to the IFRS figure.
Official (IFRS)
No official figure measures this; it is the company's own operating measure.
Company's own measure: Total bookings, FY2026
16,449 US$ million
The total contract value of orders booked in the year, including renewals; it is not revenue. Up 14.0% from FY2025. Large deals, those worth 30 million US dollars or more each, made up 7,829 million US dollars.
Official (IFRS): Cash and cash equivalents (IFRS), Mar 31, 2026
INR 105,555M
Company's own measure: Cash and short-term investments (Wipro's measure), Mar 31, 2026
INR 543,235M
Wipro adds current investments to cash, and leaves out non-current investments of INR 28,053 million and lease liabilities. Net of borrowings, its measure was INR 375,361 million.
These are the company's own measures, defined by the company. They are not comparable across companies, and they are not added together. Each sits beside the nearest official (IFRS) figure.
Learn: Non-GAAP measures: what a company's "adjusted" numbers leave out
Sources (9)
- Form 6-K: Q2 FY2027 results press release (Exhibit 99.1)
- Form 6-K: Q2 FY2027 audited consolidated results under IFRS (IASB) (Exhibit 99.4)
- Form 6-K: Q3 FY2026 results press release (Exhibit 99.1)
- Form 6-K: Q3 FY2026 audited consolidated results under IFRS (IASB) (Exhibit 99.4)
- Form 6-K: Q2 FY2027 highlights and IT Services data sheet (Exhibit 99.5)
- Form 20-F for FY2026 (year ended March 31, 2026)
- Form 6-K: Q4 FY2026 audited consolidated results under IFRS (IASB) (Exhibit 99.4)
- Form 6-K: Q4 and FY2026 results press release (Exhibit 99.1)
- Form 6-K: Q4 FY2026 highlights (Exhibit 99.5)
18Financial strength and debt
18Financial strength · Sep 30, 2026
How much debt does Wipro have?
- Total debtINR 185,021M
- Cash and investmentsINR 436,543M
- Net cash (cash minus debt)INR 251,522M
- Net worth (shareholders' money)INR 794,829M
- Debt to equity
- 0.23×
- INR of debt for every INR 1 of shareholders' money
- Cash and current investments is a Cityfort calculation from the Q2 FY2027 Form 6-K: cash and cash equivalents of INR 95,016 million plus current investments of INR 341,527 million, the same method as Wipro's own liquidity measure. Non-current investments of INR 27,727 million are left out.
- Wipro's own measure, "cash and cash equivalent and short-term investments", was INR 543,235 million at Mar 31, 2026, or INR 375,361 million net of borrowings. Between Mar 31 and Sep 30, 2026, Wipro paid INR 150,508 million for its buyback and INR 32,971 million for acquisitions.
- All borrowings were due within a year at Sep 30, 2026. Wipro's 750 million US dollars of 1.50% notes, issued on Jun 23, 2021, matured and were fully repaid on Jun 23, 2026.
- Lease liabilities of INR 36,044 million are not counted as debt here. Goodwill was INR 409,181 million and equity attributable to shareholders INR 794,829 million at Sep 30, 2026.
- The FY2026 20-F lists income tax claims of INR 104,613 million that Wipro does not acknowledge as debt, and other disputed demands of INR 20,733 million, at Mar 31, 2026. Wipro says it expects its position on the tax claims will likely be upheld.
19Who owns it
19Who owns it · ownership as of Jun 25, 2026
Who owns Wipro?
Share classes
Holders of 5% or more
One American depositary share (ADS) represents one equity share. JPMorgan Chase Bank, N.A. is the depositary, and the ADSs trade on the New York Stock Exchange. Each ADS holder owns the shares through the depositary, so the ADSs are not a separate share class.
From the company's annual report on Form 20-F (Items 6.E and 7.A), later Schedule 13G filings and the share count in that report. Each holder row shows the date of its own filing.
Insider trades · Form 4 data as of Nov 17, 2026
What did Wipro's insiders report trading?
Wipro's insiders made 3 Form 4A filing an insider must make within two business days of buying or selling the company's shares. Learn more filings in the 12 months to Nov 17, 2026.
They reported no purchases and 4 sales (540,707 shares) in the open market or privately (codes P and S).
None of the sales were on forms with the Rule 10b5-1 plan box checked.
The same filings report 2 other share transactions (A: 2).
Insiders are a company's officers, directors and owners of more than 10% of a class of its shares. Most changes in their holdings must be reported to the SEC on a Form 4 within two business days. Source: SEC Form 4 filings on EDGAR.
- P
- a purchase in the open market or privately
- S
- a sale in the open market or privately
- A
- a grant, award or other acquisition from the company under Rule 16b-3
Code meanings: General Instruction 8 of Form 4 (SEC).
All 6 transactions
Shares: A = acquired, D = disposed of. A price the filing gives only in a footnote shows as “See filing”. The 10b5-1 box is checked when at least one trade on the form was made under a Rule 10b5-1 plan. A Form 4/A replaces the form it amends. See all of Wipro's Form 4 filings on EDGAR.
Learn: Form 4 insider filings: who files, the codes and the footnotes · Rule 10b5-1 trading plans: how insiders pre-schedule their trades
20What it does with profit
20What it does with profit
What does Wipro do with its profit?
Dividend per share
INR 11.00FY2026
Dividend paid for each share, by financial year.
INR per share
See the numbers
Buyback · Apr 27, 2023
A share buyback approved by the Board on Apr 27, 2023 and completed in FY2024. Wipro paid INR 145,173 million for it in FY2024, including INR 24,783 million of buyback tax (cash flow statement).
INR 145,173M
Buyback · Jun 25, 2026
Bought back 600 million shares for INR 150,000 million through a tender offer held Jun 11 to 17, 2026, 5.72% of paid-up shares. The shares were cancelled on Jun 25, 2026. The outflow, including costs, was INR 150,508 million. The Premji family's entities sold 428,045,126 shares into the buyback (Cityfort calculation from the FY2026 20-F and the Form 6-K of Jul 2, 2026).
INR 150,508M
Sources (4)
- Form 20-F for FY2026 (year ended March 31, 2026)
- Form 6-K: public announcement of the 2026 buyback (Exhibit 99.1)
- Form 6-K: completion of extinguishment of 600,000,000 bought-back shares, with pre- and post-buyback shareholding (Exhibit 99.1)
- Form 6-K: Q2 FY2027 audited consolidated results under IFRS (IASB) (Exhibit 99.4)
21Governance signals
21Governance signals
What do Wipro's governance filings show?
- Auditor
- Deloitte Haskins & Sells LLP
- Auditor changes
- None in the period covered
- Audit qualifications
- None reported
- Related-party dealings
- This page does not summarize related-party transactions; Note 31 of the FY2026 20-F lists them. The 20-F says material related-party transactions need approval from non-controlling shareholders when the controlling shareholders are related parties.
- Credit rating
- Not checked for this page
Flags to know about
other
One family holds most of the shares
Azim H. Premji's beneficial ownership was 72.62% of shares at Mar 31, 2026, and the Premji family and its entities held 72.59% after the June 2026 buyback. His son, Rishad A. Premji, is Executive Chairman.
other
Disputed income tax claims
The FY2026 20-F reports income tax claims of INR 104,613 million that Wipro does not acknowledge as debt, mainly over deductions on profits from its software technology park and special economic zone units. Wipro says it expects its position will likely be upheld.
22What the market paid
22What the market paid · price as of Nov 16, 2026
What did the market pay for Wipro on Nov 16, 2026?
Price as of Nov 16, 2026 (shown for education; prices change daily).
ADS price (NYSE) as of Nov 16, 2026: $2.11, the closing price in Nasdaq.com's historical price table for WIT; the ADSs are listed on the New York Stock Exchange. One ADS represents one equity share, so with 9,893,340,252 shares outstanding at Sep 30, 2026 (net of treasury shares), the market value is about $20,875 million (Cityfort calculation from the Nov 16, 2026 closing price and the Q2 FY2027 Form 6-K). No P/E, P/B or EV/EBITDA is shown: Wipro reports earnings and equity in Indian rupees, so dividing them into a US-dollar price would mix two currencies.
- ADS price (NYSE)
- $2.11
- Market value (market cap)
- $20.9B
Source: WIT historical daily prices, Nov 2 to Nov 16, 2026 (Nasdaq.com table for the NYSE-listed ADS; close of Nov 16, 2026: $2.11); Form 6-K: Q2 FY2027 interim condensed consolidated financial statements under IFRS (Exhibit 99.3)
23How it got here
23How it got here
How did Wipro get here?
1945
Milestone
Founded as a vegetable oil maker
Incorporated on Dec 29, 1945 as Western India Vegetable Products Limited, making vegetable oil in Amalner, Maharashtra.
1985
Business-model change
Into computers, then software
Began selling personal computers in India in 1985; in the 1990s it started offering software services to clients worldwide.
2000
Milestone
ADSs listed in New York
Its ADSs began trading on the New York Stock Exchange on Oct 19, 2000, after its US public offering.
2019
Milestone
Founder steps back
Azim H. Premji was chairman until Jul 30, 2019 and became the non-executive Founder Chairman. His son, Rishad A. Premji, is Executive Chairman.
2023
Milestone
A buyback
A share buyback approved by the Board on Apr 27, 2023 was completed in FY2024. Wipro paid INR 145,173 million for it, including INR 24,783 million of buyback tax.
2024
Milestone
New CEO and a bonus issue
Srinivas Pallia became CEO on Apr 7, 2024. A 1:1 bonus issue, with a record date of Dec 3, 2024, gave holders one new share for each share held, ADS holders included.
2025
Milestone
Harman unit bought; one-off charges
Bought Harman's Digital Transformation Solutions unit on Dec 1, 2025. In Q3 FY2026 Wipro booked restructuring costs and a charge for India's new labor codes.
2026
Milestone
Mindsprint and a second buyback
Bought Mindsprint on May 15, 2026, then bought back 600 million shares for INR 150,000 million, cancelled on Jun 25, 2026.
Sources (4)
- Form 20-F for FY2026 (year ended March 31, 2026)
- Form 6-K: Q3 FY2026 audited consolidated results under IFRS (IASB) (Exhibit 99.4)
- Form 6-K: Q2 FY2027 interim condensed consolidated financial statements under IFRS (Exhibit 99.3)
- Form 6-K: completion of extinguishment of 600,000,000 bought-back shares, with pre- and post-buyback shareholding (Exhibit 99.1)
24Sources and changes
Where every number on this page comes from
Sources (19 documents)
- S1Form 20-F for FY2026 (year ended March 31, 2026) · Wipro Limited (SEC EDGAR) · Tier 1: company or exchange filing · Jun 2, 2026
- S2Form 20-F for FY2025 (year ended March 31, 2025) · Wipro Limited (SEC EDGAR) · Tier 1: company or exchange filing · May 22, 2025
- S4Form 20-F for FY2023 (year ended March 31, 2023) · Wipro Limited (SEC EDGAR) · Tier 1: company or exchange filing · May 24, 2023
- S5Form 20-F for FY2022 (year ended March 31, 2022) · Wipro Limited (SEC EDGAR) · Tier 1: company or exchange filing · Jun 9, 2022
- S6Form 6-K: Q2 FY2027 results press release (Exhibit 99.1) · Wipro Limited (SEC EDGAR) · Tier 1: company or exchange filing · Oct 20, 2026
- S7Form 6-K: Q2 FY2027 audited consolidated results under IFRS (IASB) (Exhibit 99.4) · Wipro Limited (SEC EDGAR) · Tier 1: company or exchange filing · Oct 20, 2026
- S8Form 6-K: Q2 FY2027 interim condensed consolidated financial statements under IFRS (Exhibit 99.3) · Wipro Limited (SEC EDGAR) · Tier 1: company or exchange filing · Oct 20, 2026
- S9Form 6-K: Q2 FY2027 highlights and IT Services data sheet (Exhibit 99.5) · Wipro Limited (SEC EDGAR) · Tier 1: company or exchange filing · Oct 20, 2026
- S10Form 6-K: Q1 FY2027 results press release (Exhibit 99.1) · Wipro Limited (SEC EDGAR) · Tier 1: company or exchange filing · Jul 22, 2026
- S12Form 6-K: Q4 and FY2026 results press release (Exhibit 99.1) · Wipro Limited (SEC EDGAR) · Tier 1: company or exchange filing · Apr 17, 2026
- S13Form 6-K: Q4 FY2026 audited consolidated results under IFRS (IASB) (Exhibit 99.4) · Wipro Limited (SEC EDGAR) · Tier 1: company or exchange filing · Apr 17, 2026
- S14Form 6-K: Q3 FY2026 results press release (Exhibit 99.1) · Wipro Limited (SEC EDGAR) · Tier 1: company or exchange filing · Jan 21, 2026
- S15Form 6-K: Q3 FY2026 audited consolidated results under IFRS (IASB) (Exhibit 99.4) · Wipro Limited (SEC EDGAR) · Tier 1: company or exchange filing · Jan 21, 2026
- S16Form 6-K: Q2 FY2026 audited consolidated results under IFRS (IASB) (Exhibit 99.4) · Wipro Limited (SEC EDGAR) · Tier 1: company or exchange filing · Oct 21, 2025
- S18Form 6-K: public announcement of the 2026 buyback (Exhibit 99.1) · Wipro Limited (SEC EDGAR) · Tier 1: company or exchange filing · May 26, 2026
- S19Form 6-K: completion of extinguishment of 600,000,000 bought-back shares, with pre- and post-buyback shareholding (Exhibit 99.1) · Wipro Limited (SEC EDGAR) · Tier 1: company or exchange filing · Jul 2, 2026
- S20Schedule 13G/A (Amendment No. 7) filed by Azim H. Premji and related entities · Azim H. Premji et al. (SEC EDGAR) · Tier 1: company or exchange filing · Feb 6, 2024
- S21WIT historical daily prices, Nov 2 to Nov 16, 2026 (Nasdaq.com table for the NYSE-listed ADS; close of Nov 16, 2026: $2.11) · Nasdaq, Inc. · Tier 1: company or exchange filing · Nov 17, 2026
- S23Form 6-K: Q4 FY2026 highlights (Exhibit 99.5) · Wipro Limited (SEC EDGAR) · Tier 1: company or exchange filing · Apr 17, 2026
Changes to this page (v1 · Nov 17, 2026)
- v1 · Nov 17, 2026First version. (first version)
Numbers come only from tier 1 and tier 2 sources. Read how we research.
Disclaimer
For learning only. Cityfort is not a registered investment adviser or broker-dealer and does not recommend buying or selling any security. Prices shown are dated and may be out of date.
Investing in securities involves risk, including loss of capital. Before making any investment decision, do your own research and consider consulting a registered investment adviser or other qualified professional.
Cityfort, its owners and contributors may or may not hold securities of companies covered. Cityfort is not paid by any company it covers. Content is not an offer or solicitation to buy or sell any security, including in any initial public offering.
Read the positions policyRead the full disclaimerHide the full disclaimer
Cityfort publishes general educational content that explains how listed companies work. Cityfort is not registered with the US Securities and Exchange Commission or any state securities regulator as an investment adviser, and is not a broker-dealer or a member of FINRA. Cityfort does not provide investment, tax or legal advice, recommendations, ratings, price targets or any opinion on whether to buy, sell or hold any security. Nothing on the site is tailored to any person's circumstances.
All information is taken from publicly available sources, mainly company filings with the SEC, which are listed on each page with dates. We work to keep it accurate and correct errors publicly, but we do not guarantee that it is complete, accurate or up to date. Any market price or price-based ratio shown is dated, may be out of date by the time you read it, and is included only to explain concepts.
Statements by company management, including forward-looking statements and guidance, are reported as the company's statements, with their date and source; they are not our forecasts. Adjusted (non-GAAP) figures are the company's own measures and are shown next to the official (GAAP) figures.