Technology · NASDAQ: MPWR
MPS: how the business works
MPS designs chips that manage electric power inside servers, cars and devices, and had revenue of $2,790.5 million in FY2025.
By Hardik Bhandare · Checked against filings: . Editorial policy. Corrections
Follow MPS
Email me when MPS's page is updated after earnings.
We'll send a confirmation email first. See our privacy policy.
Monolithic Power Systems, Inc. · West Palm Beach, Florida (address on SEC filings) · Founded 1997
Updated for Q3 FY2026 · checked
- Revenue, FY2025
- $2,790.5M
- Net income, FY2025
- $621.5M
- Revenue, Q3 FY2026
- $1,202.4M
- Employees, FY2025 10-K
- Over 4,500
- Founded
- 1997
The short version
MPS in 5 points
1 · What it sells
MPS designs chips that manage electric power inside servers, cars and devices; outside foundries make them, and FY2025 revenue was $2,790.5 million.
2 · Who pays it
In FY2025 electronics distributors handled 85% of MPS's revenue, and equipment makers buying directly paid the other 15%.
3 · What it keeps from $100
Of every $100 that came in during FY2025, MPS kept $22.0 as net income, which includes $37.6 million of other income; operating income was $29.7 per $100 of revenue in Q3 FY2026.
4 · Where the operating profit comes from
MPS reports one segment and no profit by end market; in FY2025 its chips earned $1,539.7 million of gross profit on $2,790.5 million of revenue.
5 · The one thing to watch
Enterprise Data was 42.1% of MPS's Q3 FY2026 revenue, up from 26.0% a year earlier, after it fell 2.0% in FY2025.
Sources: From MPS's FY2025 10-K, Q3 FY2026 10-Q and Q3 2026 earnings commentary · checked
01Where the money goes · FY2025
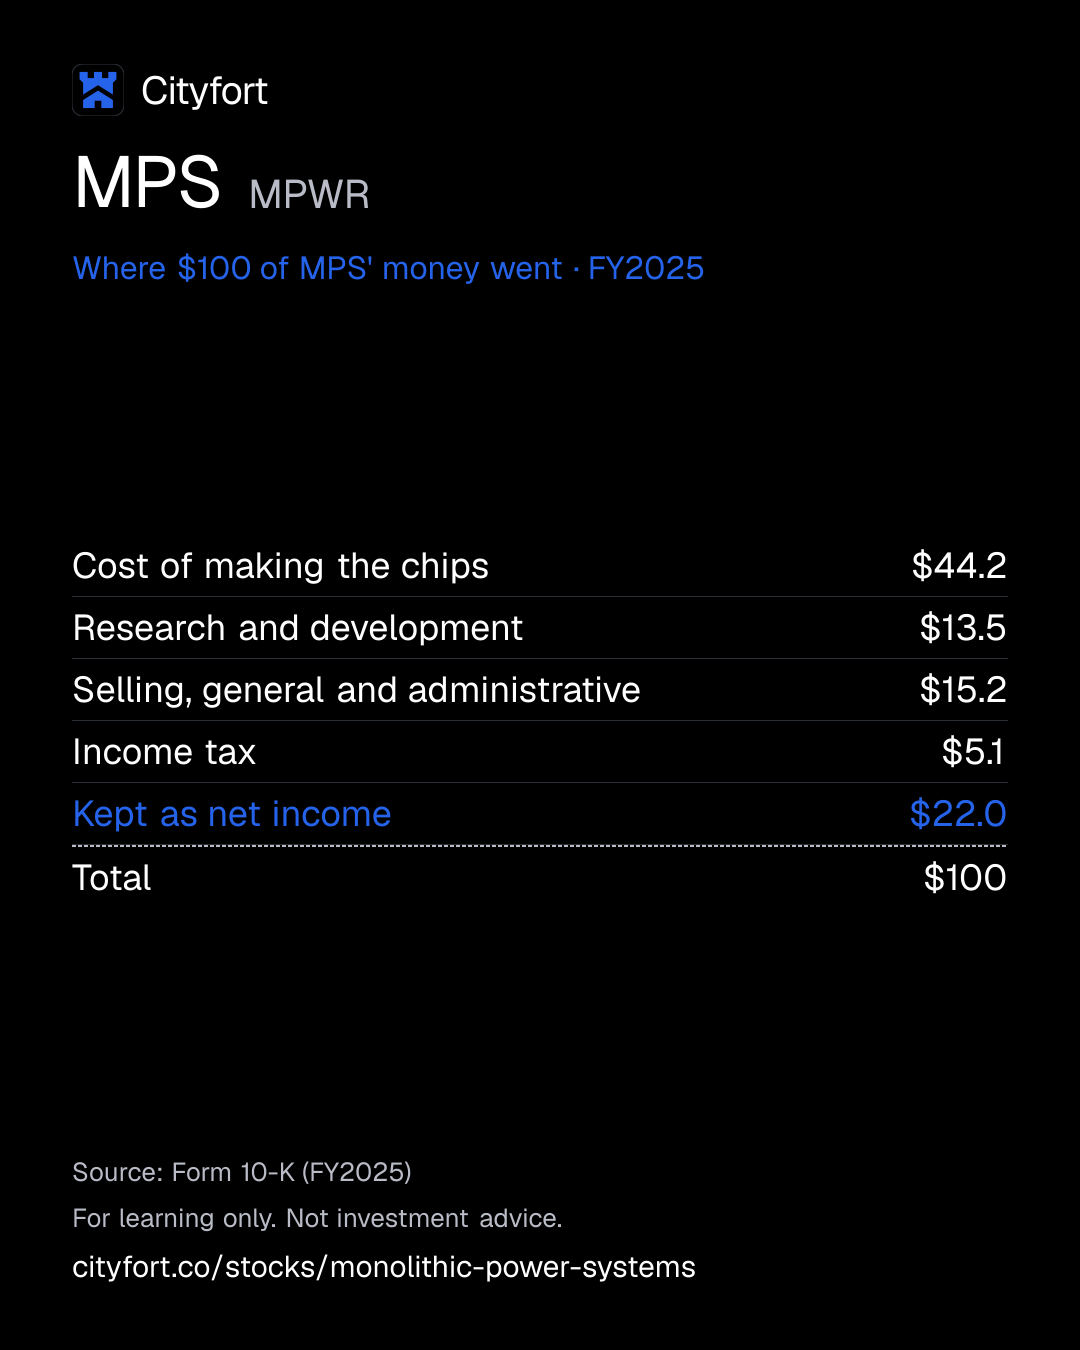
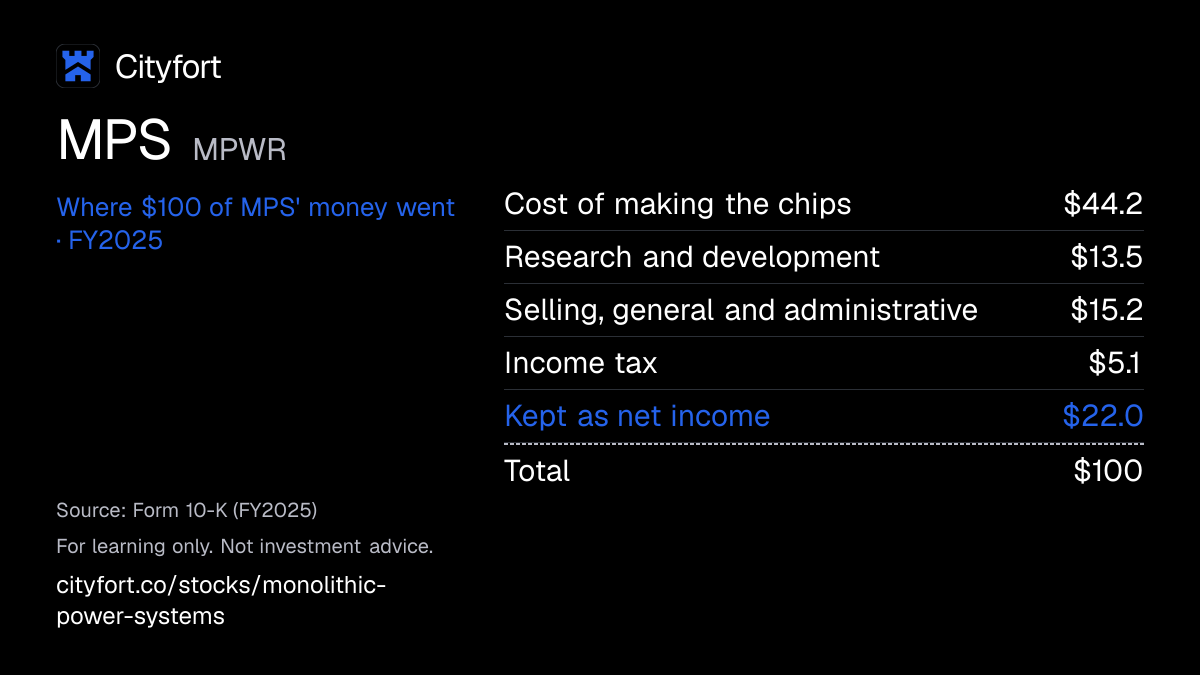
Where does $100 of MPS' money go?
MPS · FY2025
Receipt for every $100
| Cost of making the chips | $44.2 |
|---|---|
| Research and development | $13.5 |
| Selling, general and administrative | $15.2 |
| Income tax | $5.1 |
| Kept as net income | $22.0 |
| Total | $100 |
Each line = amount ÷ total money in × 100. Lines may not add to exactly $100 because of rounding.
How this is worked out
Cityfort calculation from the FY2025 10-K. Of every $100 that came in during FY2025 (revenue of $2,790.5 million plus $37.6 million of other income): each line = line ÷ $2,828.0 million × 100.
Save this receipt as an image
Embed this receipt or the key numbers
Paste this code into a blog or website to show the card you choose, with a link back to this page.
Each week: the next company due to report earnings, explained in 5 points.
No tips. Unsubscribe anytime.
We'll send a confirmation email. See our privacy policy.
02The business in one line
What does MPS do?
Electronics distributors and equipment makers pay MPS for power chips that outside foundries make. Making them took $44.2 of every $100 in FY2025, and $22.0 was left as net income.
- Distributors handled 85% of FY2025 revenue and direct customers the other 15%; the largest distributor took 26%.
- After the chips were made, research and development took $13.5 and selling and administration $15.2 of every $100 in FY2025.
03Who pays it
Who pays MPS?
Electronics distributors
85%
of revenue
Distributors buy MPS chips and resell them to device makers. They handled 85% of FY2025 revenue and 91% in Q3 FY2026.
Direct customers
15%
of revenue
Equipment makers that buy from MPS without a distributor: the remaining 15% of FY2025 revenue. MPS names none of them.
- Electronics distributors85%
- Direct customers15%
Customer concentration
Three unnamed distributors took 26%, 18% and 10% of FY2025 revenue. In Q3 FY2026 the largest took 32%. MPS states that it could use other distributors and that ending one agreement would not have a material adverse effect.
- Largest customer
- 26%
04How it makes money
How does MPS make money?
MPS keeps about $55 of each $100 of sales after making its chips, so profit depends on other costs growing more slowly than sales.
From Q1 FY2024 to Q3 FY2026, gross margin stayed between 55.1% and 55.4% each quarter. Over the same period, operating costs grew more slowly than revenue. Operating income per $100 of revenue rose from $20.9 to $29.7.
Operating income per $100 of revenue
$20.9$29.7
Q1 FY2024 to Q3 FY2026
- MPS designs a power chip using its own process technology
- Partner foundries make it, so MPS needs no wafer factories of its own
- Distributors and direct buyers place it in servers, cars and devices
- Each extra sale adds about $55 of gross profit per $100
- Spending on design and sales grew more slowly than revenue
- Operating income per $100 of revenue rises
↺ Step 6 feeds back into step 1.
05Business segments · FY2025
Which businesses make up MPS?
Storage and Computing
26.3%Power chips for memory, storage, notebooks and graphics cards. Revenue rose 46.0% in FY2025; the 10-K credits sales of those products.
Revenue $733M
Enterprise Data
25.2%Power chips for enterprise data systems. Revenue fell 2.0% in FY2025, then reached $506.7 million in Q3 FY2026, 42.1% of that quarter's revenue.
Revenue $702M
Automotive
21.2%Chips for driver-assistance and infotainment systems, among others. Revenue rose 43.1% in FY2025.
Revenue $593M
Communications
11.1%Power chips for optical modules and routers. Revenue rose 36.8% in FY2025.
Revenue $309M
Consumer
9.1%Chips for consumer electronics. Revenue rose 26.3% in FY2025.
Revenue $255M
Industrial
7.1%Chips for industrial equipment. Revenue rose 35.3% in FY2025.
Revenue $199M
How the mix changed
- Storage and Computing
- Enterprise Data
- Automotive
- Communications
- Consumer
- Industrial
Revenue by segment, FY2023 to FY2025.
US$
See the numbers
06The numbers · Consolidated · US$
How has MPS done?
Revenue
$2.8BFY2025
Revenue rose every year from $1,207.8 million in FY2021 to $2,790.5 million in FY2025, and was $1,202.4 million in Q3 FY2026 alone.
US$
See the numbers
Net income
$622MFY2025
Restated FY2024 net income of $1,592.1 million includes a one-time deferred tax benefit of about $1.1 billion; FY2025 net income was $621.5 million.
US$
See the numbers
Net income for every $100 of revenue
$22.3FY2025
Net income per $100 of revenue was $20.0 in FY2021 and $22.3 in FY2025; the FY2024 figure of $72.1 includes the one-time tax benefit.
Net margin: $ of net income per $100 of revenue
See the numbers
Free cash flow
$666MFY2025
Free cash flow was $666.2 million in FY2025 after $172.0 million of capital spending, up from $225.6 million in FY2021.
US$ · cash from operations minus spending on plants and equipment
See the numbers
See all yearly numbers
EBITDA here = operating income plus depreciation and amortization (from the cash flow statement). Fiscal years are the company's own: Fiscal year ends Dec 31. Net income is the share belonging to the company's owners.
Learn: Fiscal years that don't end in December: Nvidia's FY2027 explained · Stock-based compensation and dilution: pay that becomes shares
Sources (14)
- Form 10-K for FY2021
- Form 10-K for FY2022
- Form 10-K for FY2023
- Form 10-K for FY2024
- Form 10-K for FY2025
- Form 10-Q for Q1 FY2024
- Form 10-Q for Q2 FY2024
- Form 10-Q for Q3 FY2024
- Form 10-Q for Q1 FY2025
- Form 10-Q for Q1 FY2026
- Form 10-Q for Q2 FY2025
- Form 10-Q for Q2 FY2026
- Form 10-Q for Q3 FY2025
- Form 10-Q for Q3 FY2026
07Who runs it
Who runs MPS, and did they deliver?
Michael Hsing
Founder, President, CEO and Chairman · since 1997
Founded MPS in 1997 and took it public in 2004.
Tony Balow
Vice President, Chief Financial Officer · since 2026
Signed the Q3 FY2026 10-Q as CFO. Rob Dean was interim CFO after Bernie Blegen stepped down on Feb 27, 2026.
Deming Xiao
Executive Vice President, Global Operations · since 2001
Joined MPS in May 2001; earlier ran its Asia operations.
Maurice Sciammas
Executive Vice President, Worldwide Sales and Marketing · since 1999
Joined MPS in July 1999.
Herbert Chang
Lead Independent Director · since 1999
Director since September 1999; the CEO also chairs the board.
What they said, and what happened
3 delivered · 3 too early to tell
Said on Feb 5, 2026
Q1 FY2026 revenue of $770 million to $790 million.
DeliveredWhat happened
Reported $804.2 million, above the top of the range.
Said on Apr 30, 2026
Q2 FY2026 revenue of $890 million to $910 million.
DeliveredWhat happened
Reported $980.6 million, above the top of the range.
Said on Jul 30, 2026
Q3 FY2026 revenue of $1,140 million to $1,160 million.
DeliveredWhat happened
Reported $1,202.4 million, above the top of the range.
Said on Oct 29, 2026
Q4 FY2026 revenue of $1,315 million to $1,385 million.
Too early to tellWhat happened
Results for Q4 FY2026 are not yet reported.
Said on Nov 3, 2026
Fix the material weakness in tax accounting controls by the end of FY2026, with no assurance on timing.
Too early to tellWhat happened
Not remediated at Sep 30, 2026.
Said on Oct 29, 2026
Have $8 billion of annual revenue capacity in place by the second half of 2027.
Too early to tellWhat happened
MPS said capacity passed $6 billion in Q3 FY2026.
Sources (9)
- Form 10-K for FY2025
- DEF 14A proxy statement 2026 (filed Apr 30, 2026)
- Form 10-Q for Q3 FY2026
- Form 10-Q for Q2 FY2026
- Form 8-K Ex. 99.1: Q4 2025 earnings release
- Form 10-Q for Q1 FY2026
- Form 8-K Ex. 99.1: Q1 2026 earnings commentary
- Form 8-K Ex. 99.1: Q2 2026 earnings commentary
- Form 8-K Ex. 99.1: Q3 2026 earnings commentary
08What could go wrong
What could go wrong for MPS?
- Governance
Restated results and an open control weakness
MPS restated FY2024 and its 2025 quarters in February 2026 over deferred tax accounting. The control weakness behind it was not fixed at Sep 30, 2026.
Watch Whether the FY2026 10-K reports the material weakness as remediated.
- Concentration
Most sales run through a few distributors
Distributors handled 91% of Q3 FY2026 revenue. The largest, which MPS does not name, took 32%.
Watch The largest distributor's share of revenue in each 10-Q.
- Regulation
Most chips ship to Asia, where trade rules shift
Customers in China took 55.3% of FY2025 revenue by ship-to location. The Q3 FY2026 10-Q lists tariffs, export controls and retaliatory measures among the uncertainties MPS faces.
Watch China's share of revenue and any new trade rules MPS reports.
- Execution
Outside foundries make every chip
Contract foundries in China, Taiwan, South Korea and Singapore make its wafers. The 10-K says a lack of foundry capacity has at times constrained its product sales and revenue growth.
Watch The capacity MPS reports against its stated $8 billion goal for the second half of 2027.
- Demand
Growth leans on Enterprise Data
Enterprise Data was 42.1% of Q3 FY2026 revenue, up from 26.0% a year earlier. In FY2025 the same market fell 2.0%.
Watch Enterprise Data revenue in each quarterly release.
- Regulation
A tax incentive could change
The 10-K says OECD guidance from January 2025, if adopted by the country behind its tax incentive, may materially impact its global tax provision. Deferred tax assets were $1,183.0 million at Sep 30, 2026.
Watch Changes in the tax rate or deferred tax assets in the 10-K.
- Demand
A cyclical industry, with 130 days of inventory
The Q3 FY2026 10-Q says MPS operates in the cyclical chip industry. Internal inventories were $764.9 million at Sep 30, 2026, or 130 days by the company's measure.
Watch Inventory days in each earnings commentary.
09Supporters vs. critics
What do supporters and critics point to?
What supporters point to
- Revenue rose every year from $1,207.8 million in FY2021 to $2,790.5 million in FY2025, and was $1,202.4 million in Q3 FY2026 alone.
- Reported revenue was above the top of MPS's own forecast range in each of Q1, Q2 and Q3 FY2026.
- Gross margin stayed between 55.1% and 55.4% each quarter from Q1 FY2024 to Q3 FY2026, while operating income per $100 of revenue rose from $20.9 to $29.7.
- MPS had no borrowings at Sep 30, 2026 and held $1,091.2 million in cash and short-term investments.
- Free cash flow was $666.2 million in FY2025, and dividends declared rose from $4.00 per share in FY2023 to $6.24 in FY2025.
What critics point to
- MPS restated FY2024 and its three 2025 quarters over deferred tax accounting, and the control weakness behind it was not remediated at Sep 30, 2026.
- Distributors handled 91% of Q3 FY2026 revenue, and the largest one, which MPS does not name, took 32%.
- Customers in China took 55.3% of FY2025 revenue by ship-to location, and the Q3 FY2026 10-Q lists tariffs and export controls among the uncertainties MPS faces.
- Enterprise Data was 42.1% of Q3 FY2026 revenue, up from 26.0% a year earlier, yet the same market fell 2.0% in FY2025.
- Internal inventories were $764.9 million at Sep 30, 2026, or 130 days by the company's measure.
10What to watch next
What should you watch next at MPS?
Next event
Q4 FY2026 results
Date not announced yet.
Revenue against the company's forecast
MPS said in its Q3 2026 earnings commentary (Oct 29, 2026) that it forecasts Q4 FY2026 revenue of $1,315 million to $1,385 million, with GAAP gross margin of 55.2% to 55.8%.
The tax-accounting control weakness
The Q3 FY2026 10-Q says MPS aims to fix the material weakness by the end of FY2026, with no assurance on timing. The FY2026 10-K will say whether it was remediated.
The largest distributor's share
The largest distributor took 26% of FY2025 revenue and 32% of Q3 FY2026 revenue.
Manufacturing capacity
MPS said in its Q3 2026 earnings commentary (Oct 29, 2026) that capacity passed $6 billion of annual revenue support, and that it expects $8 billion by the second half of 2027.
11Key facts
Key facts about MPS
- What does MPS do?
- Monolithic Power Systems (MPS, NASDAQ: MPWR) designs chips that convert incoming power into the exact voltages that processors, memory and other parts need. Contract foundries make the chips, and MPS had revenue of $2,790.5 million in FY2025.
- How does MPS make money?
- MPS sells power chips used in servers, cars, storage, communications gear and consumer devices. In FY2025 MPS kept $621.5 million of net income from $2,790.5 million of revenue.
- Who are MPS's customers?
- Electronics distributors handled 85% of MPS's FY2025 revenue and direct customers the other 15%. The largest distributor, which MPS does not name, took 26% of FY2025 revenue and 32% in Q3 FY2026.
- Where does MPS sell its chips?
- Customers in China took 55.3% of MPS's FY2025 revenue by ship-to location, Taiwan 19.7% and South Korea 9.1% (Cityfort calculation from the FY2025 10-K).
- How big is MPS?
- MPS had revenue of $2,790.5 million and net income of $621.5 million in FY2025, the year ended Dec 31, 2025. In Q3 FY2026 MPS had revenue of $1,202.4 million and net income of $271.1 million.
- Does MPS have debt?
- MPS had no borrowings at Sep 30, 2026 and held $1,091.2 million in cash and short-term investments, according to its Q3 FY2026 10-Q.
- Who owns MPS?
- MPS has one class of shares with one vote each. At the Apr 15, 2026 record date, officers and directors as a group held 3.6% of MPS, and the 2026 proxy names The Vanguard Group (12.1%), BlackRock (10.0%) and FMR (8.1%) as the largest holders.
- Does MPS pay a dividend?
- MPS declared dividends of $6.24 per share in FY2025, up from $4.00 in FY2023. In February 2026 the MPS board raised the quarterly dividend from $1.56 to $2.00 per share.
Terms on this page
- Capital expenditures (capex)
- Customer concentration
- Debt-to-equity
- Earnings per share (EPS)
- EBITDA
- Free cash flow
- Net debt
- Net margin
- Operating margin
- Revenue vs net income
Each explains the term in plain English, with the same number from other companies on Cityfort.
Go deeper
More detail from the same filings. Open any section.
12What it sells
12What it sells
What does MPS sell?
DC-to-DC converters
Chips that turn one direct-current (DC) voltage into another, for parts such as processors and memory.
AC-to-DC converters
Chips that turn alternating current (AC) from the wall into the DC power that devices run on.
Drivers and MOSFETs
Power switches, and the circuits that control them, that pass current to the parts that use it.
Power management ICs
Integrated circuits (ICs) that oversee several power supplies inside one device.
Current limit switches and lighting control
Chips that cap current to protect a circuit, and chips that drive lights such as LEDs.
Think of it like this
Like the fuse box and transformers of a house, shrunk onto a chip that sits next to each part needing power.
What it does
- Does: Designs power chips sold into six end markets, from enterprise data to cars
- Does: Uses its own chip-making process, installed on equipment at partner foundries
- Does: Sold 85% of FY2025 revenue through distributors
What it does not do
- Does not: Run its own wafer factories: third parties make, assemble and test its chips
- Does not: Make the main processors in servers or cars: it supplies the power chips around them
- Does not: Name its largest distributors or end customers
Sources (1)
13How the money flows
13How the money flows · FY2025
How does money flow through MPS?
Money in
- Revenue$2.8B
- Other income, net$37.6M
The company
MPS
$2.8B came in
Money out
- Cost of making the chips (cost of revenue)$1.3B
- Research and development$382M
- Selling, general and administrative$429M
- Income tax$145M
- Net income$622M
- Customers paid MPS $2,790.5 million for chips in FY2025; other income added $37.6 million.
- Having outside foundries make the chips cost $1,250.7 million, leaving $1,539.7 million of gross profit.
- Designing new products cost $382.3 million; selling and running the company cost $428.8 million.
- Income tax took $144.7 million.
- The remaining $621.5 million was net income.
Sources (1)
14What it needs to run
14What it needs to run
What does MPS need to run?
Partner foundries
Several contract foundries in China, Taiwan, South Korea and Singapore make its silicon wafers. Testing sites are in China, Taiwan, Singapore, Malaysia and South Korea.
Its own process technology
Unlike many chip designers that use a foundry's standard process, MPS developed its own and installs it on equipment at partner foundries.
Patents
MPS had 2,231 patents issued or pending at Dec 31, 2025, including 654 issued in the U.S.; the issued ones expire through December 2045.
Engineers and staff
Over 4,500 employees in Asia, Europe and the U.S., according to the FY2025 10-K.
Supply commitments
Purchase obligations were $442.2 million at Dec 31, 2025, with $389.8 million due within a year.
Sources (1)
15Where it sells
15Where it sells · FY2025, by the ship-to location of direct customers (Cityfort calculation from the FY2025 10-K)
Where does MPS sell?
- China55.3%
- Taiwan19.7%
- South Korea9.1%
- Southeast Asia5.3%
- Europe4.1%
- United States3.5%
- Japan3%
Sources (1)
16Competitors and what protects it
16Competitors and what protects it
Who does MPS compete with?
Texas Instruments
NASDAQ: TXN
Named by MPS in its FY2025 10-K among the companies it competes with in power electronics.
Analog Devices
Named by MPS in its FY2025 10-K among the companies it competes with in power electronics.
Infineon Technologies
Named by MPS in its FY2025 10-K among the companies it competes with in power electronics.
onsemi (ON Semiconductor)
NASDAQ: ON
Named by MPS in its FY2025 10-K among the companies it competes with in power electronics.
Renesas Electronics
Named by MPS in its FY2025 10-K among the companies it competes with in power electronics.
What protects the business
Each strength is scored 1 (weak) to 5 (strong) for the business, with the reason. It is not a rating of the share.
- Own process technology4 of 5
MPS developed its own chip-making process and packaging, which it installs at partner foundries, rather than using a foundry's standard process.
- Patents3 of 5
2,231 patents issued or pending at Dec 31, 2025, 654 of them issued in the U.S.
- Spread across end markets3 of 5
Six end markets in FY2025, none above 26.3% of revenue; by Q3 FY2026 Enterprise Data had reached 42.1%.
Weak spot
Sales run through a few distributors
Distributors handled 91% of Q3 FY2026 revenue, and the largest, unnamed, took 32%.
17Where growth could come from
17Where growth could come from
Where could MPS' growth come from?
MPS said in its Q3 2026 earnings commentary (Oct 29, 2026) that it forecasts Q4 FY2026 revenue of $1,315 million to $1,385 million, with GAAP gross margin of 55.2% to 55.8%. It gave no full-year forecast.
Enterprise Data
Working$506.7M in Q3 FY2026, up 164.6% from a year earlier
Enterprise Data was 42.1% of Q3 FY2026 revenue, against 26.0% a year earlier. MPS said in its Q3 2026 earnings commentary (Oct 29, 2026) that it expects demand from existing customers to continue into 2027.
Status: Working, on track against what the company said.
Communications
Working$187.4M in Q3 FY2026 vs $79.9M in Q3 FY2025
The Q3 FY2026 10-Q names enterprise data, communications and automotive as the markets behind higher revenue.
Status: Working, on track against what the company said.
Automotive
Working$180.7M in Q3 FY2026 vs $151.5M in Q3 FY2025
Automotive revenue rose 43.1% in FY2025. In its Q3 2026 earnings commentary (Oct 29, 2026), MPS said it received first orders for 48V power products. It expects 48V and zonal design wins (being picked for a carmaker's new design) to drive growth in 2027.
Status: Working, on track against what the company said.
Manufacturing capacity
EarlyAbove $6 billion of yearly revenue support in Q3 FY2026
Capacity passed $6 billion of annual revenue support, MPS said in its Q3 2026 earnings commentary (Oct 29, 2026). It expects $8 billion of capacity by the second half of 2027.
Status: Early, too early to judge.
Robotics and data center power designs
NewRobotics ramp started in Q3 FY2026
MPS said in its Q3 2026 earnings commentary (Oct 29, 2026) that its robotics ramp began. It is also sampling GaN-based (gallium nitride) products for 800V data center power designs.
Status: New, recently announced.
Status compares progress with what the company itself said it would do: Working = on track against what the company said; Mixed = partly on track; Behind = behind the company's own plan; New = recently announced; Early = too early to judge.
18The company's own measures (non-GAAP)
18The company's own measures · Q3 FY2026
What do MPS' own measures show?
Official (GAAP): Net income, Q3 FY2026
$271M
Company's own measure: Non-GAAP net income, Q3 FY2026
$403M
MPS leaves out items such as stock-based compensationPay given as shares instead of cash, which spreads ownership more thinly. Learn more and applies its own 15% non-GAAPThe company's own "adjusted" numbers, not the official (GAAP) ones. Always read them next to the official figure. Learn more tax rate.
Official (GAAP): Operating expenses, Q3 FY2026
$308M
Company's own measure: Non-GAAP operating expenses, Q3 FY2026
$205M
The Q3 2026 earnings commentary ties most of the gap to stock-based compensation, $106.3 million in the quarter including cost of revenue.
Official (GAAP): Operating margin, Q3 FY2026
29.7%
Company's own measure: Non-GAAP operating margin, Q3 FY2026
38.6%
GAAP operating margin as stated by MPS in its Q3 2026 earnings commentary (Oct 29, 2026).
These are the company's own measures, defined by the company. They are not comparable across companies, and they are not added together. Each sits beside the nearest official (GAAP) figure.
Learn: Non-GAAP measures: what a company's "adjusted" numbers leave out · Stock-based compensation and dilution: pay that becomes shares
19Financial strength and debt
19Financial strength · Sep 30, 2026
How much debt does MPS have?
- Total debt$0M
- Cash and investments$1.1B
- Net cash (cash minus debt)$1.1B
- Net worth (shareholders' money)$3.7B
- Debt to equity
- 0×
- $ of debt for every $1 of shareholders' money
- Net cash of $1,091.2 million: Cityfort calculation from the Q3 FY2026 10-Q (cash and short-term investments minus zero borrowings).
- Its $111.5 million of other long-term obligations are deferred compensation and dividend equivalents, not loans.
- Cash and short-term investments were $1,256.5 million at Dec 31, 2025, MPS said in its Q1 2026 earnings commentary (Apr 30, 2026); MPS spent $453.4 million on buybacks in Q3 FY2026.
- Deferred tax assets, mostly tied to a foreign tax incentive, were $1,183.0 million of the $4,672.6 million of total assets at Sep 30, 2026.
20Who owns it
20Who owns it · ownership as of Apr 15, 2026
Who owns MPS?
- Officers and directors (as a group), shares
- 3.6%
Share classes
Holders of 5% or more
From the company's proxy statement (DEF 14A), later Schedule 13G filings and the share counts on its latest annual or quarterly report. Each holder row shows the date of its own filing.
Learn: How to read a proxy statement (DEF 14A): Nvidia's 2026 proxy · Form 4 insider filings: who files, the codes and the footnotes
21What it does with profit
21What it does with profit
What does MPS do with its profit?
Dividend per share
$6.24FY2025
Dividend paid for each share, by financial year.
$ per share
See the numbers
No buybacks or fund raises in the period covered.
Sources (1)
22Governance signals
22Governance signals
What do MPS' governance filings show?
- Auditor
- Ernst & Young LLP, since 2019
- Auditor changes
- None in the period covered
- Audit qualifications
- None reported
- Related-party dealings
- The 2026 proxy reports that MPS invested $10 million (July 2025) and $1 million (January 2026) in venture capital partnerships. Executive Saria Tseng personally invested $500,000 in each. The Audit Committee reviews and approves related-party transactions.
- Credit rating
- Not checked for this page
Flags to know about
disclosure
FY2024 and 2025 quarterly results restated
On Feb 26, 2026 the Audit Committee determined that the FY2024 statements and the three 2025 10-Qs should no longer be relied upon, the FY2025 10-K says. The error concerned deferred income taxes on a one-time foreign tax incentive. Restated FY2024 net income is $1,592.1 million, against $1,786.7 million first reported.
disclosure
Material weakness in tax accounting controls
MPS reported a material weakness in internal control over accounting for deferred income taxes. Its controls were not effective at Dec 31, 2024 and Dec 31, 2025. The weakness was not remediated at Sep 30, 2026.
other
Executives ended share-sale plans
In Q3 FY2026 Michael Hsing, Deming Xiao and Maurice Sciammas terminated Rule 10b5-1 trading plansAn insider's trading plan, set up in advance, that buys or sells shares on a schedule. Learn more. Hsing had sold 30,000 of up to 60,000 shares under his plan.
other
Hedging of company stock banned
The 2026 proxy says company policy prohibits hedging or monetizing stock obtained through company plans.
23How it got here
23How it got here
How did MPS get here?
1997
Milestone
Founded by Michael Hsing
Michael Hsing founded MPS in 1997; he is still CEO and chairman.
2004
Milestone
Initial public offering
Hsing took the company public in 2004; its shares trade on Nasdaq as MPWR.
2024
Milestone
Ten-year foreign tax incentive
A foreign subsidiary received a ten-year tax incentive starting in tax year 2025; MPS booked a deferred tax benefit of $1.1 billion in FY2024.
2026
Crisis
Results restated
In February 2026 MPS restated FY2024 and its 2025 quarters for an error in deferred tax accounting.
2026
Milestone
New finance chief
CFO Bernie Blegen stepped down on Feb 27, 2026; Tony Balow signed the Q3 FY2026 10-Q as CFO.
2026
Milestone
First $1 billion quarter
Revenue reached $1,202.4 million in Q3 FY2026, the first quarter above $1 billion.
24Sources and changes
Where every number on this page comes from
Sources (20 documents)
- S1Form 10-Q for Q3 FY2026 · SEC EDGAR · Tier 1: company or exchange filing · Nov 3, 2026
- S2Form 10-Q for Q2 FY2026 · SEC EDGAR · Tier 1: company or exchange filing · Aug 5, 2026
- S3Form 10-Q for Q1 FY2026 · SEC EDGAR · Tier 1: company or exchange filing · May 4, 2026
- S4Form 10-K for FY2025 · SEC EDGAR · Tier 1: company or exchange filing · Feb 27, 2026
- S5Form 10-Q for Q3 FY2025 · SEC EDGAR · Tier 1: company or exchange filing · Nov 5, 2025
- S6Form 10-Q for Q2 FY2025 · SEC EDGAR · Tier 1: company or exchange filing · Aug 4, 2025
- S7Form 10-Q for Q1 FY2025 · SEC EDGAR · Tier 1: company or exchange filing · May 5, 2025
- S8Form 10-K for FY2024 · SEC EDGAR · Tier 1: company or exchange filing · Mar 3, 2025
- S9Form 10-Q for Q3 FY2024 · SEC EDGAR · Tier 1: company or exchange filing · Nov 6, 2024
- S10Form 10-Q for Q2 FY2024 · SEC EDGAR · Tier 1: company or exchange filing · Aug 2, 2024
- S11Form 10-Q for Q1 FY2024 · SEC EDGAR · Tier 1: company or exchange filing · May 3, 2024
- S12Form 10-K for FY2023 · SEC EDGAR · Tier 1: company or exchange filing · Feb 29, 2024
- S13Form 10-K for FY2022 · SEC EDGAR · Tier 1: company or exchange filing · Feb 24, 2023
- S14Form 10-K for FY2021 · SEC EDGAR · Tier 1: company or exchange filing · Feb 25, 2022
- S15DEF 14A proxy statement 2026 (filed Apr 30, 2026) · SEC EDGAR · Tier 1: company or exchange filing · Apr 30, 2026
- S16Form 8-K Ex. 99.1: Q3 2026 earnings commentary · SEC EDGAR · Tier 1: company or exchange filing · Oct 29, 2026
- S17Form 8-K Ex. 99.1: Q2 2026 earnings commentary · SEC EDGAR · Tier 1: company or exchange filing · Jul 30, 2026
- S18Form 8-K Ex. 99.1: Q1 2026 earnings commentary · SEC EDGAR · Tier 1: company or exchange filing · Apr 30, 2026
- S19Form 8-K Ex. 99.1: Q4 2025 earnings release · SEC EDGAR · Tier 1: company or exchange filing · Feb 5, 2026
- S20Form 8-K Ex. 99.1: Q3 2025 earnings release · SEC EDGAR · Tier 1: company or exchange filing · Oct 30, 2025
Changes to this page (v1 · Nov 20, 2026)
- v1 · Nov 20, 2026First version. (first version)
Numbers come only from tier 1 and tier 2 sources. Read how we research.
Disclaimer
For learning only. Cityfort is not a registered investment adviser or broker-dealer and does not recommend buying or selling any security. Prices shown are dated and may be out of date.
Investing in securities involves risk, including loss of capital. Before making any investment decision, do your own research and consider consulting a registered investment adviser or other qualified professional.
Cityfort, its owners and contributors may or may not hold securities of companies covered. Cityfort is not paid by any company it covers. Content is not an offer or solicitation to buy or sell any security, including in any initial public offering.
Read the positions policyRead the full disclaimerHide the full disclaimer
Cityfort publishes general educational content that explains how listed companies work. Cityfort is not registered with the US Securities and Exchange Commission or any state securities regulator as an investment adviser, and is not a broker-dealer or a member of FINRA. Cityfort does not provide investment, tax or legal advice, recommendations, ratings, price targets or any opinion on whether to buy, sell or hold any security. Nothing on the site is tailored to any person's circumstances.
All information is taken from publicly available sources, mainly company filings with the SEC, which are listed on each page with dates. We work to keep it accurate and correct errors publicly, but we do not guarantee that it is complete, accurate or up to date. Any market price or price-based ratio shown is dated, may be out of date by the time you read it, and is included only to explain concepts.
Statements by company management, including forward-looking statements and guidance, are reported as the company's statements, with their date and source; they are not our forecasts. Adjusted (non-GAAP) figures are the company's own measures and are shown next to the official (GAAP) figures.